What is Ad Hoc Reporting?

Remember when you thought you performed well on a test in school, but you had to wait over the weekend until the teacher graded it? In the world of business, you often need data in real-time, so you can make vital decisions that impact people, operations or revenue. If something big happens today, you’ll need a report on it today that can’t wait over the weekend.
In other words, you need ad hoc reporting. Instead of run-of-the-mill reports that you send or receive weekly/monthly/quarterly, ad hoc reports are created whenever the need arises.
Let’s show you why these reports are crucial for your business.
What is an ad hoc report?
Ad hoc is an expression from Latin that means “to this” or “as needed”. An ad hoc report is one that you create when there is a need for it. For example, you just launched a new Facebook ad campaign and you want to see the results immediately instead of waiting for a week until the next marketing meeting.
Ad hoc reports help you run a more data-driven business as you can make important decisions on the go and drill down into data early, to strike the iron while it’s hot.
Businesses from all types of industries can benefit from these kinds of reports, but having this functionality comes at a cost. To be able to create ad hoc reports, business users need to be familiar with business intelligence tools. This way, they can create reports and dashboards on their own, without calling up the IT department. But more on that in a second.
Ad hoc reports can be created within organizations, when different team members take on the task of the report creation. If you’re building a data-powered product, it’s also possible to create ad hoc reports within embedded analytics. For example, a SaaS app can allow the end user to create reports with their own data, without having to leave said SaaS app.
Tools like Luzmo Studio allow developers to embed dashboards directly into their applications, while Luzmo IQ and Luzmo AI help end users explore their data and generate reports instantly without relying on analysts.
The benefits of ad hoc reporting
Making data-driven decisions is the biggest advantage of running ad hoc reports. But there are some others you should be familiar with too.
Empowering non-technical users
In traditional BI settings, only those who are proficient in data analysis and engineering can create reports. This can cause bottlenecks and slow down decision-making. On the other hand, ad hoc reports allow for self-service analytics.
With some training and the right ad hoc reporting tools, anyone can learn how to create an interactive dashboard with data visualizations.
Flexibility and customization
When the IT or data analytics department creates a report for you, that’s a done deal. You can just look at the data and interpret it, with some level of exploration.
On the other hand, ad hoc reports let the end user customize the experience and choose the KPIs and metrics relevant for their business questions. Once again, choosing the right BI tool is crucial to turn this into reality.
If you are adding customer-facing analytics to your SaaS, these two attributes are crucial for getting more users to create dashboards and reports.
Improved decision-making
You don’t just get the right data more quickly compared to traditional reports. The added benefit is that the end-user can create the kind of tailored reports that answer their specific questions.
For example, marketing and sales could be working on the same datasets related to the most recent campaign. Sales can create an ad hoc report focusing on the cost per lead, while marketing could focus on the quality of leads and the sources they came from.
Through this data, you can make better decisions about the profitability of your specific business. One dataset could yield countless graphs, reports and dashboards, but not every graph is as valuable to everyone. With ad hoc reporting, you can pick out those insights that are most relevant to you and focus on data-driven decision making.
Decreased workload for IT departments
Data analysts probably have more important things to do than create a report every time decision-makers need the latest sales stats. Okay, that may not be always the case, but the reality is that when anyone can create an ad hoc report, the IT department can breathe more easily.
In the long run, this type of reporting can also save plenty of money for the company, as none of the stakeholders will have to wait for the IT department to deliver a finished report.
Improved communication and collaboration
No more 50 versions of different Excel spreadsheets. When you start out from the same datasets, everyone can create their own reports and they will all be accurate. This can streamline operations in your business environment, but more importantly, it ensures that all teams are aligned.
You can achieve higher operational efficiency by giving everyone the ability to go from raw data to valuable insights, on their own terms.
The challenges of ad hoc reporting
So far, you get the impression that this reporting type can speed up business decisions and make life easier for just about every stakeholder in your organization. But there are some considerations that you should be aware of too.
User training and adoption
Creating reports on demand may sound easy in theory, but in practice can be wildly different. While many reporting solutions today are easy to use, the end user should still know the foundations of business intelligence and data analytics.
In other words, to make the most out of sales data, a sales professional has to go beyond their day-to-day tools and metrics to be able to make more informed decisions.
Depending on the tool you choose, make sure your end users get sufficient training before they can attempt creating their own dashboards and reports.
Data quality and consistency
Your business provides the clay for the end users to shape and create their works of art. That starting point is the data, and if it’s not clean and well-structured, each of your reports will be inaccurate, leading to wrong ad hoc analysis.
This is why most teams who use ad hoc reporting have at least one expert in data governance, modeling and structure. This person should ensure the integrity, cleanliness and structure of data before it’s passed on to different stakeholders for reporting purposes.
Cost considerations
Depending on the number of users, data sources, and your individual use cases, a BI solution for ad hoc reporting can be pretty expensive. The likes of Looker can cost upwards of $100k per year, for example.
Besides the monthly and annual license costs, you have to factor in the costs of training and onboarding. If you’re starting off with something like Power BI and you don’t have experienced Power BI developers, it can take months for your team to be able to create reports independently.
Besides the pricing, carefully weigh out the pros and cons of the self service BI tool you choose and ensure the user experience facilitates easy ad hoc reporting.
Data security, compliance and access control
When IT teams create one-time, static reports, they’re the one in charge of the data from start to finish. The end user only gets to see the finished product.
Ad hoc reporting allows everyone access to that data, and you need to have systems in place to ensure the right people can use it for their reports. Good BI tools can take this off your plate and they are also compliant with most international data protection laws.
Examples of ad hoc reporting across industries
Want to get inspired on how to use ad hoc reporting in your day-to-day work? Here are some illustrative examples.
Healthcare: a patient administrator can generate an ad hoc report on the average patient wait times in the emergency room or the reduction in hold times thanks to emergency dispatch software to remove potential bottlenecks.
Retail: a sales manager can pull an ad hoc report to investigate the sales performance of different stores during a promotional period, helping to find the most efficient sales reps.
Financial reporting: a financial analyst can generate a report to assess the risk exposure of a certain portfolio in light of recent market conditions and changes.
Manufacturing: a manager creates reports to analyze the downtime of certain machines and production delays, with the aim of improving operational efficiency.
Education: a professor can generate a report on student performance in an exam for a specific class using an AI paper grader, helping identify areas where students struggle and need additional teaching materials.
Marketing: a performance marketing manager creates a report to evaluate the effectiveness of a recent PPC campaign and will monitor keyword performance over time to determine those with the best ROI.
Ad hoc reporting tools for software products in 2026
The tooling for ad hoc reporting has split into two distinct categories. Internal tools are built for analysts and data teams who need direct data access, query flexibility, and the ability to build reports from scratch. Embedded tools are built into software products so that end users can generate reports on their own data without leaving the application.
Internal ad hoc reporting tools
Metabase and Redash are popular open-source options for teams that want to give analysts SQL access with a visual layer on top. Looker and Sigma Computing are commercial alternatives with stronger semantic modeling and governance features. These tools are designed for internal use — they assume the user has some data literacy and can navigate a query interface.
Embedded ad hoc reporting for product users
For software products, the challenge is different: end users need to generate reports on their own data without SQL access, without leaving the product, and without training. This is where embedded analytics platforms purpose-built for the use case add value. Luzmo AI allows end users to type a question in plain language and receive a chart or table as an answer, without any query-building interface — making ad hoc reporting accessible to non-technical users who would never open a BI tool.
The selection criterion that matters most for embedded ad hoc reporting is whether the tool can be scoped to a specific user's data — showing each customer only their own records — while still allowing flexible exploration within that scope. Many BI tools are not architected for this kind of row-level security at the end-user level.
How to implement self-service ad hoc reporting for your end users
Self-service ad hoc reporting for end users is one of the harder analytics features to implement well. The goal is straightforward — let users answer their own questions — but the implementation involves several layers that are easy to underestimate.
The first layer is data access and scoping. Each user should only be able to query data that belongs to them or their organization. This requires a multi-tenancy architecture where data is either physically separated by customer or filtered by a tenant identifier at the query level. Getting this wrong is a serious security issue, not just an analytics problem.
The second layer is the data model. Raw database tables are rarely user-friendly — column names like created_at or user_id_fk are meaningful to engineers but not to an end user who wants to know "how many customers signed up last month." A semantic or business logic layer that maps raw fields to human-readable concepts is what makes self-service feel self-service rather than self-confusing.
The third layer is the query interface. Traditional query builders with dropdowns and filter panels require users to know what they want before they start. Natural language querying — where users type a question and the system interprets it — lowers the barrier significantly and allows users to discover answers to questions they did not know they could ask.
For product teams evaluating whether to build or buy this capability: building a reliable self-service analytics layer that handles multi-tenancy, semantic modeling, and natural language querying typically takes six to twelve months of engineering time. Luzmo AI provides all three layers as an embeddable product, with most teams shipping a working implementation in days rather than months.
Ad hoc reporting best practices: getting it right in your product
Ad hoc reporting that works well in practice requires more than giving users access to data. The most common failure mode is not that users cannot find answers, but that they find different answers depending on how they ask the question — which destroys trust in the reporting feature faster than any technical bug.
Consistent metric definitions are the foundation. If "active user" means different things in different parts of the product — or if two users building reports on the same question get different results because they applied date filters differently — the reporting feature becomes a source of confusion rather than clarity. Defining metrics centrally and making them the default rather than requiring users to define them each time solves most of these consistency problems.
Guardrails matter as much as flexibility. The ideal ad hoc reporting experience lets users explore freely within a bounded space rather than giving them unlimited access to raw data. Presenting curated dimensions and metrics, rather than every column in every table, reduces the chance of misinterpretation while still covering the questions most users actually need to answer.
Saving and sharing reports is often an afterthought but significantly affects adoption. When a user finds a useful answer, the ability to save it, share it with a colleague, or promote it to a scheduled report creates compounding value. One well-constructed ad hoc report that gets saved and shared becomes a resource for the whole team.
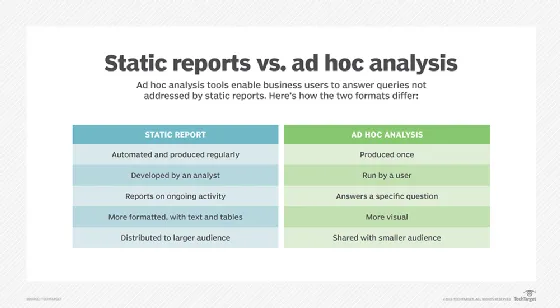
Ad hoc reporting vs. scheduled reporting: when to use which
Most reporting in organizations falls into one of two categories. Scheduled reports run automatically at a fixed cadence — weekly sales summaries, monthly financial closes, quarterly board updates — and deliver a consistent view of predetermined metrics to a predetermined audience. Ad hoc reports are created on demand when a specific question arises that the scheduled reports do not answer.
Scheduled reports are efficient for monitoring known metrics over time. Because they are built once and run repeatedly, the investment in design and data validation happens upfront. The tradeoff is rigidity: a scheduled report answers the question it was built to answer, and nothing else. When something unexpected happens — a sudden drop in a metric, a product launch that needs immediate performance data, a customer escalation that requires historical context — a scheduled report is rarely the right tool.
Ad hoc reports are designed for those moments. They are faster to create than a full scheduled report because they do not need to be built for long-term reuse, but they require the person creating them to have either data access or a tool that abstracts it away. The risk is inconsistency: two people building ad hoc reports on the same question with slightly different parameters can reach different conclusions from the same underlying data.
For teams building analytics into a product, understanding this distinction matters for design. Scheduled reports work well as the default view for most users. Ad hoc reporting capability — the ability for a user to ask a new question on demand — is what turns a dashboard from a passive display into an active tool.
Start creating ad hoc reports today
If you have a SaaS app, you want to make it easy for the end user to view reports with their data, or even create their own reports from scratch. Just a few years ago, this seemed incredibly complex and expensive. Nowadays, embedded analytics platforms like Luzmo make ad hoc reporting for SaaS users a reality.
Sign up and within a few hours, you’ll have a live, finished dashboard in your app. Don’t take our word for it - sign up for a free demo so we can show you how it works in practice. Plans start at $495/month for Starter, $1,995/month for Premium, with custom Enterprise pricing available as you scale.
FAQ
All your questions answered.
What makes ad-hoc reporting different from canned reports?
Ad-hoc reports are created on-the-fly based on specific business questions at a moment in time, whereas canned reports are prebuilt, scheduled, and repeated regularly. Ad-hoc reporting gives on-demand insights without waiting for analysts to build them manually.
What skills are needed for good ad-hoc reporting?
Users should understand what questions they’re trying to answer and have access to semantic models or friendly interfaces that let them explore data without writing SQL.
Can ad-hoc reports become standardized over time?
Yes. Frequently pulled ad-hoc reports often become candidates for scheduled dashboards or templates once they prove repeat value.
How do analytics tools enable ad-hoc reporting?
Modern platforms provide drag-and-drop builders, natural language queries, and dynamic filters so users can shape data and answer queries without coding.
Written by

Ship the future of your data
Let us show you what Luzmo can do for your product.

Leave your e-mail and one of our analytics experts will reach out to you