

Maps studio
A geographic drill-down dashboard pairing a Luzmo custom chart map with a configurable dashboard for spatial drill-down analysis.
Learn more (opens in new tab)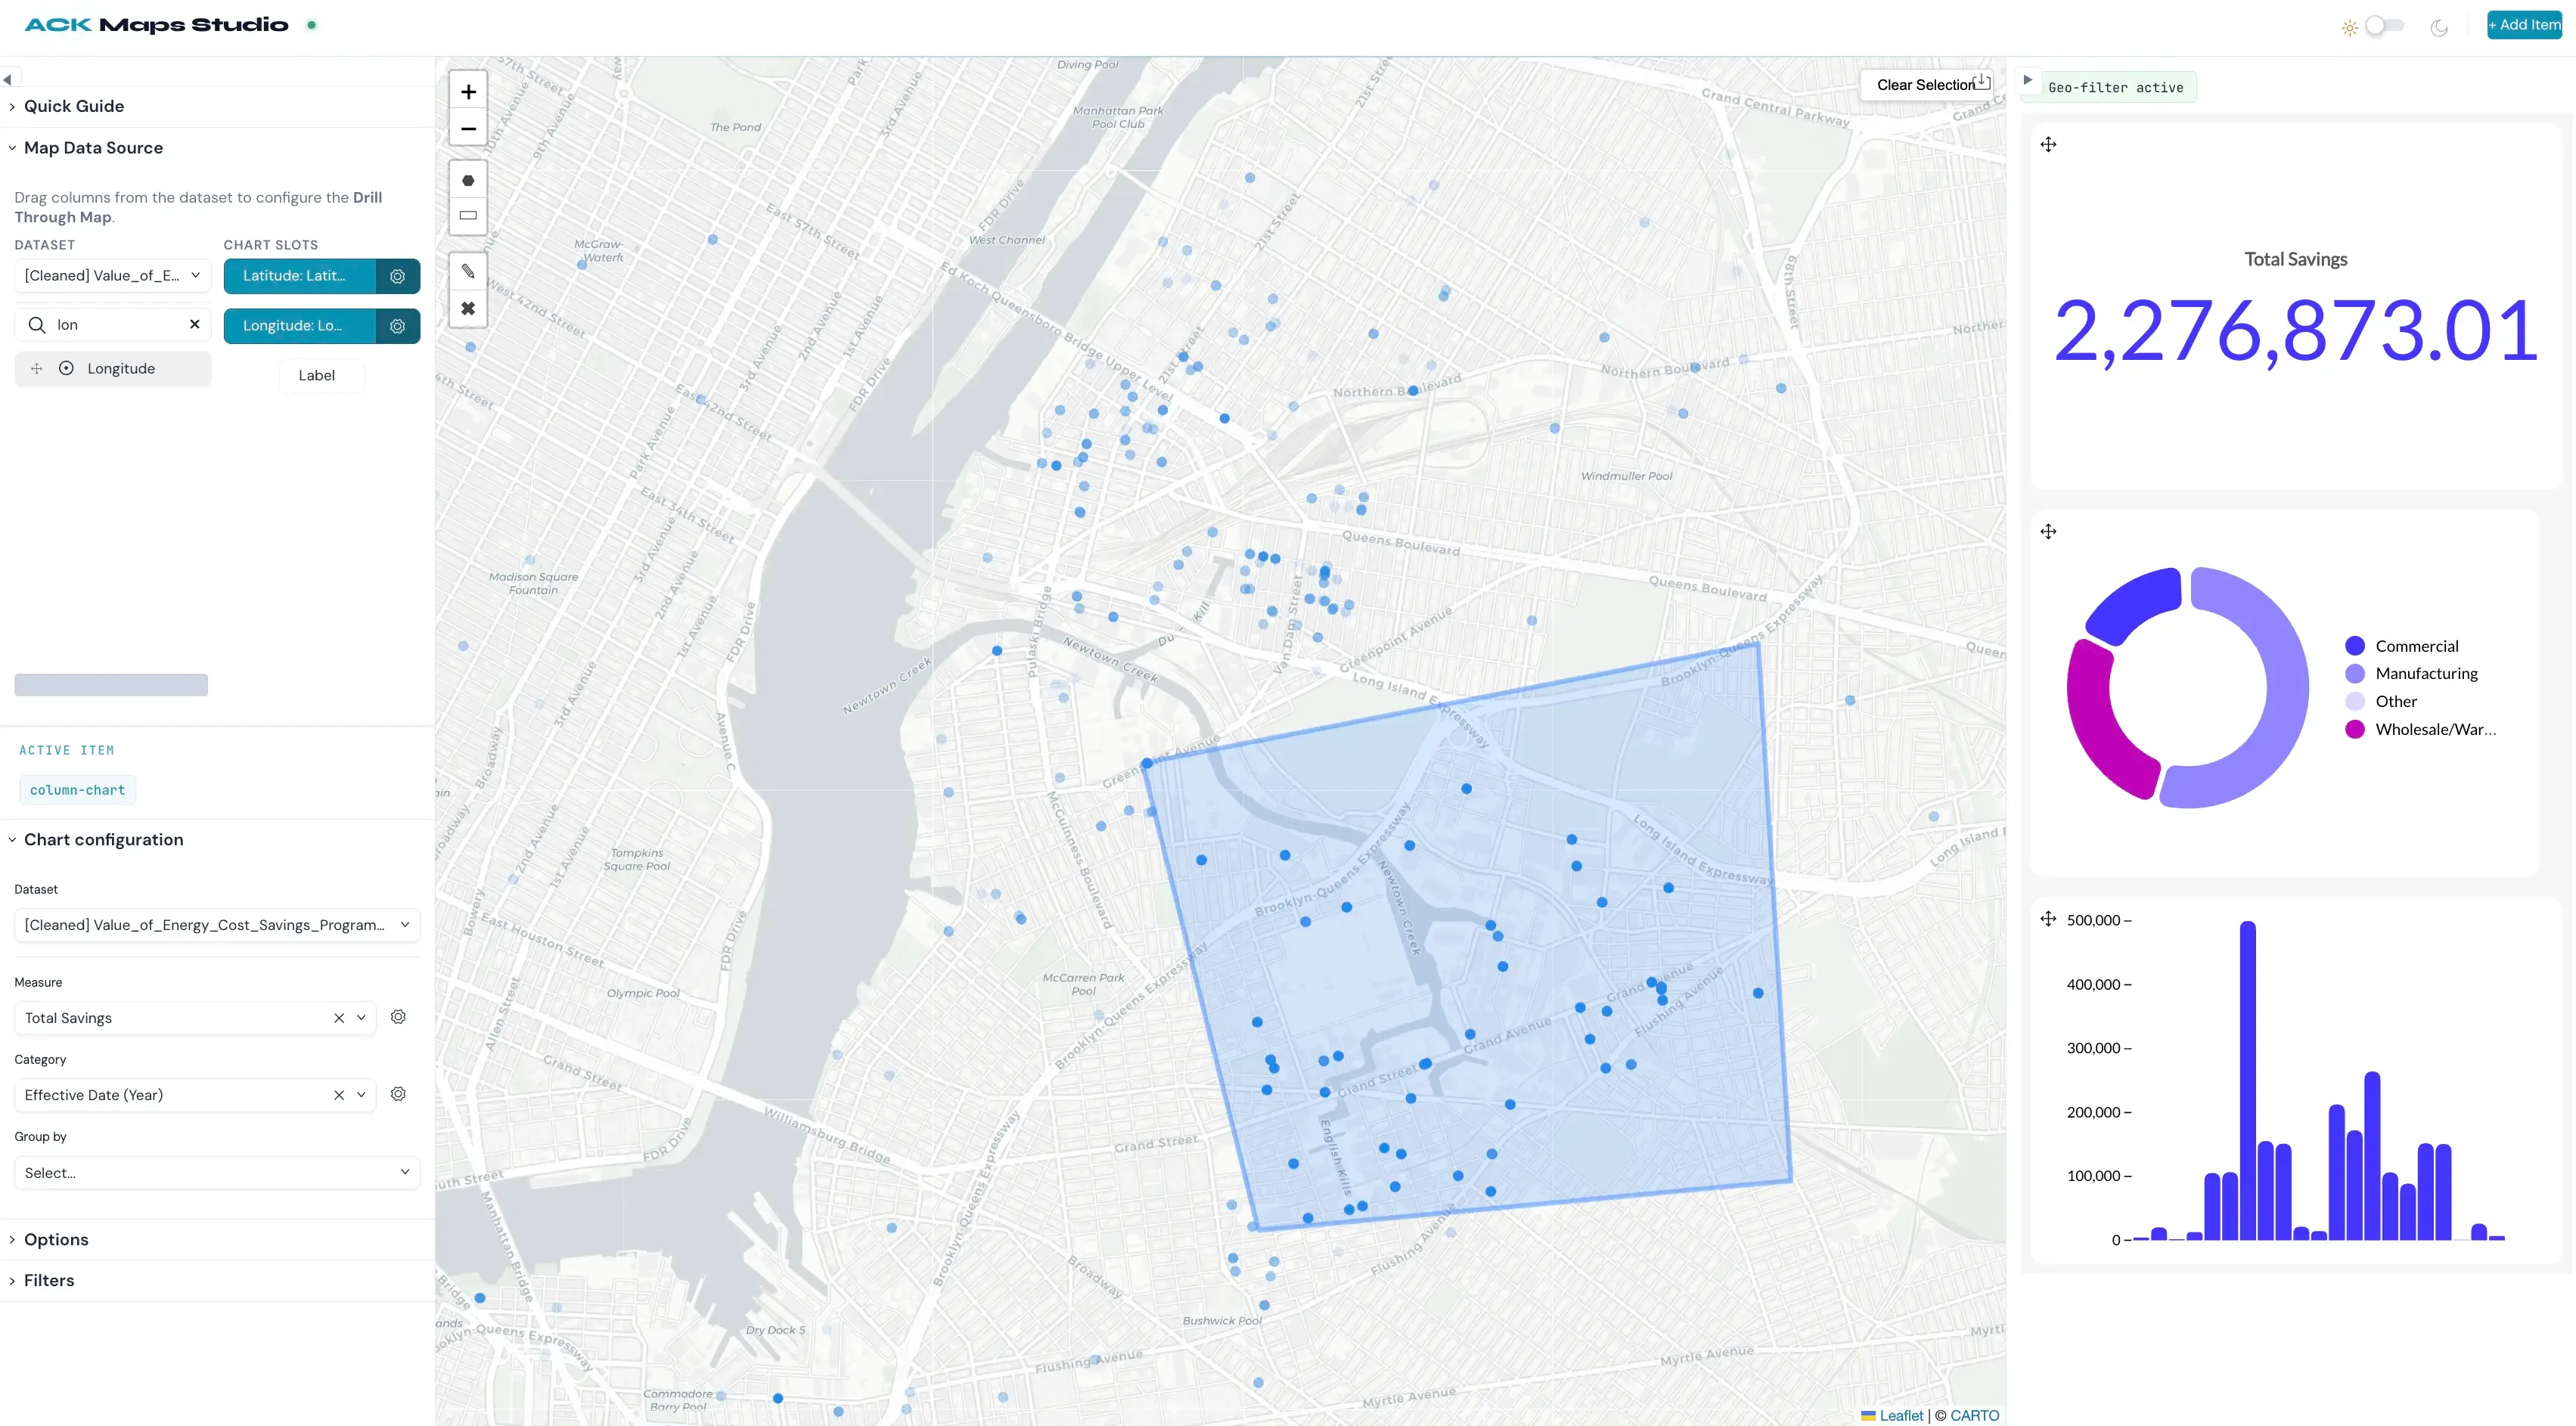
Composable analytics
Build analytics that look and behave like the rest of your product: charts, filters, layouts, interactions, all yours. Luzmo takes care of the queries, caching, security and scale underneath.
“Beautiful, out-of-the-box dashboards that can convince new clients!”

Matthieu Vegreville
Co-founder & COO
“With Luzmo, we skipped three years of development time and immediately jumped to a full-blown solution.”

Maarten Saeys
CPO
“Luzmo's flexibility and ease-of-use were unmatched in any other platform we evaluated. It is so easy and fun to use.”

Cedric Spaas
Product Expert Analytics







Pick the level of control you want. Both paths run on the same queries, caching and security.
Define charts and interactions yourself, in your own components. Full control of every pixel and every event, without building a query layer or caching underneath.
Learn more (opens in new tab)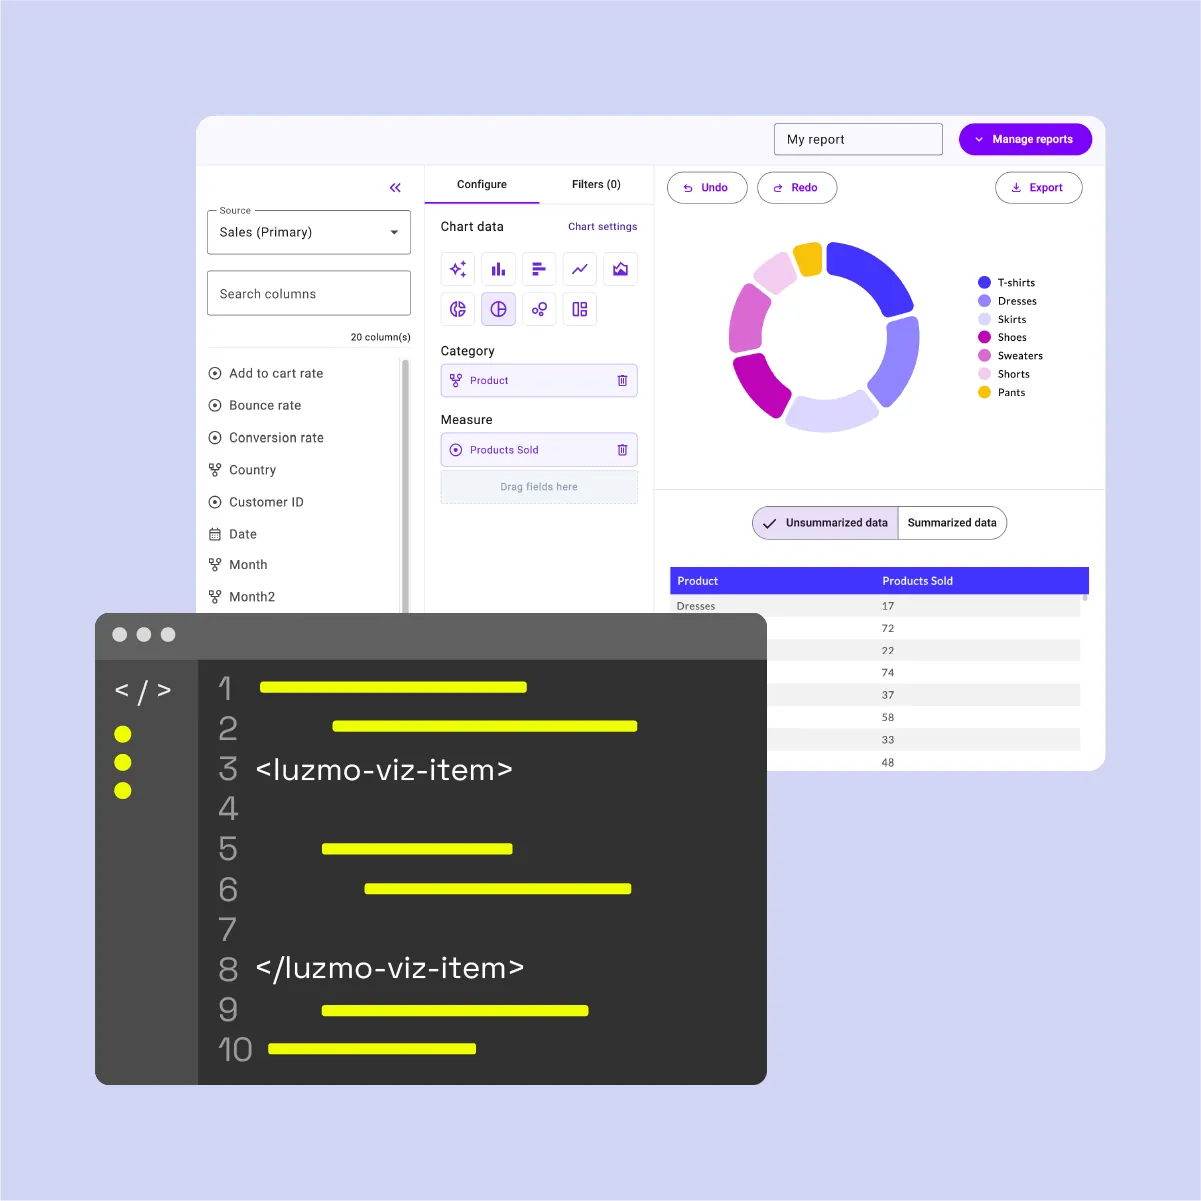
Configure components that render themselves. You control layout, theme and which pieces appear, and ship in days instead of sprints.
Learn more (opens in new tab)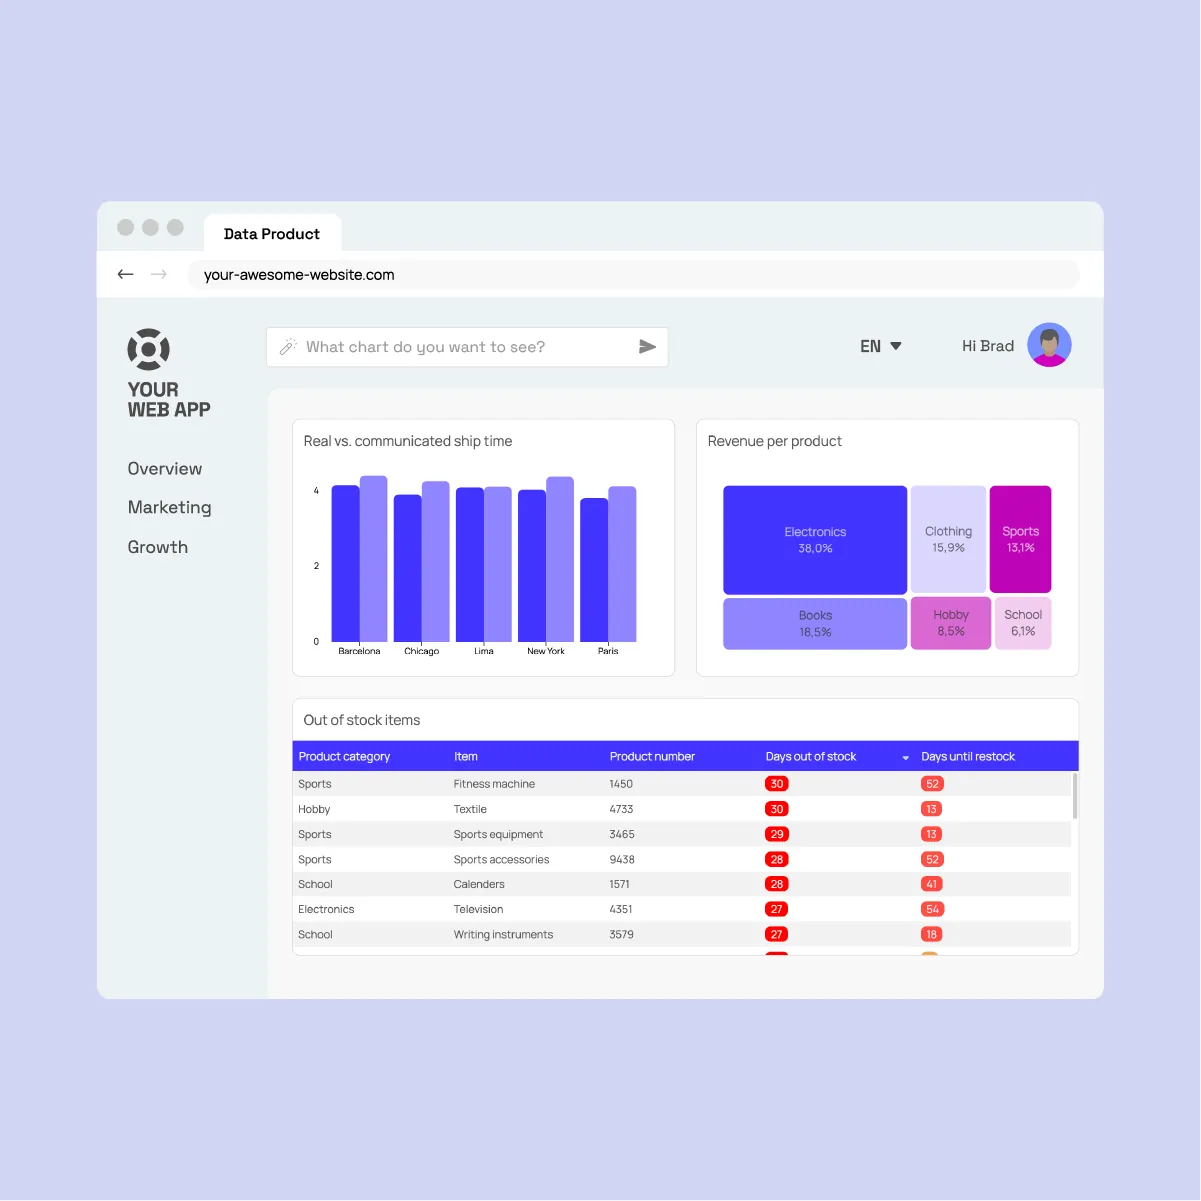


The components handle the heavy lifting of data processing and dynamic visualization.
1--luzmo-font-family: 'Inter', 'Segoe UI', sans-serif;2--luzmo-font-color: rgb(226, 232, 240);3--luzmo-font-size: 14px;4--luzmo-line-height: 1.5;5--luzmo-background-color: rgb(15, 23, 42);6--luzmo-background-color-highlight: rgb(30, 41, 59);7--luzmo-border-color: rgba(148, 163, 184, 0.35);8--luzmo-border-width: 1px;9--luzmo-border-radius: 12px;10--luzmo-primary: rgb(99, 102, 241);11--luzmo-primary-hover: rgb(129, 140, 248);12--luzmo-positive-color: rgb(34, 197, 94);13--luzmo-negative-color: rgb(239, 68, 68);14--luzmo-animation-duration: 0.2s;See how top product teams are transforming data experience for their users
A geographic drill-down dashboard pairing a Luzmo custom chart map with a configurable dashboard for spatial drill-down analysis.
Learn more (opens in new tab)Analytics for Engineering teams in a cyber-themed command centre: monitor bug queues and PR health, with on-demand chart generation.
Learn more (opens in new tab)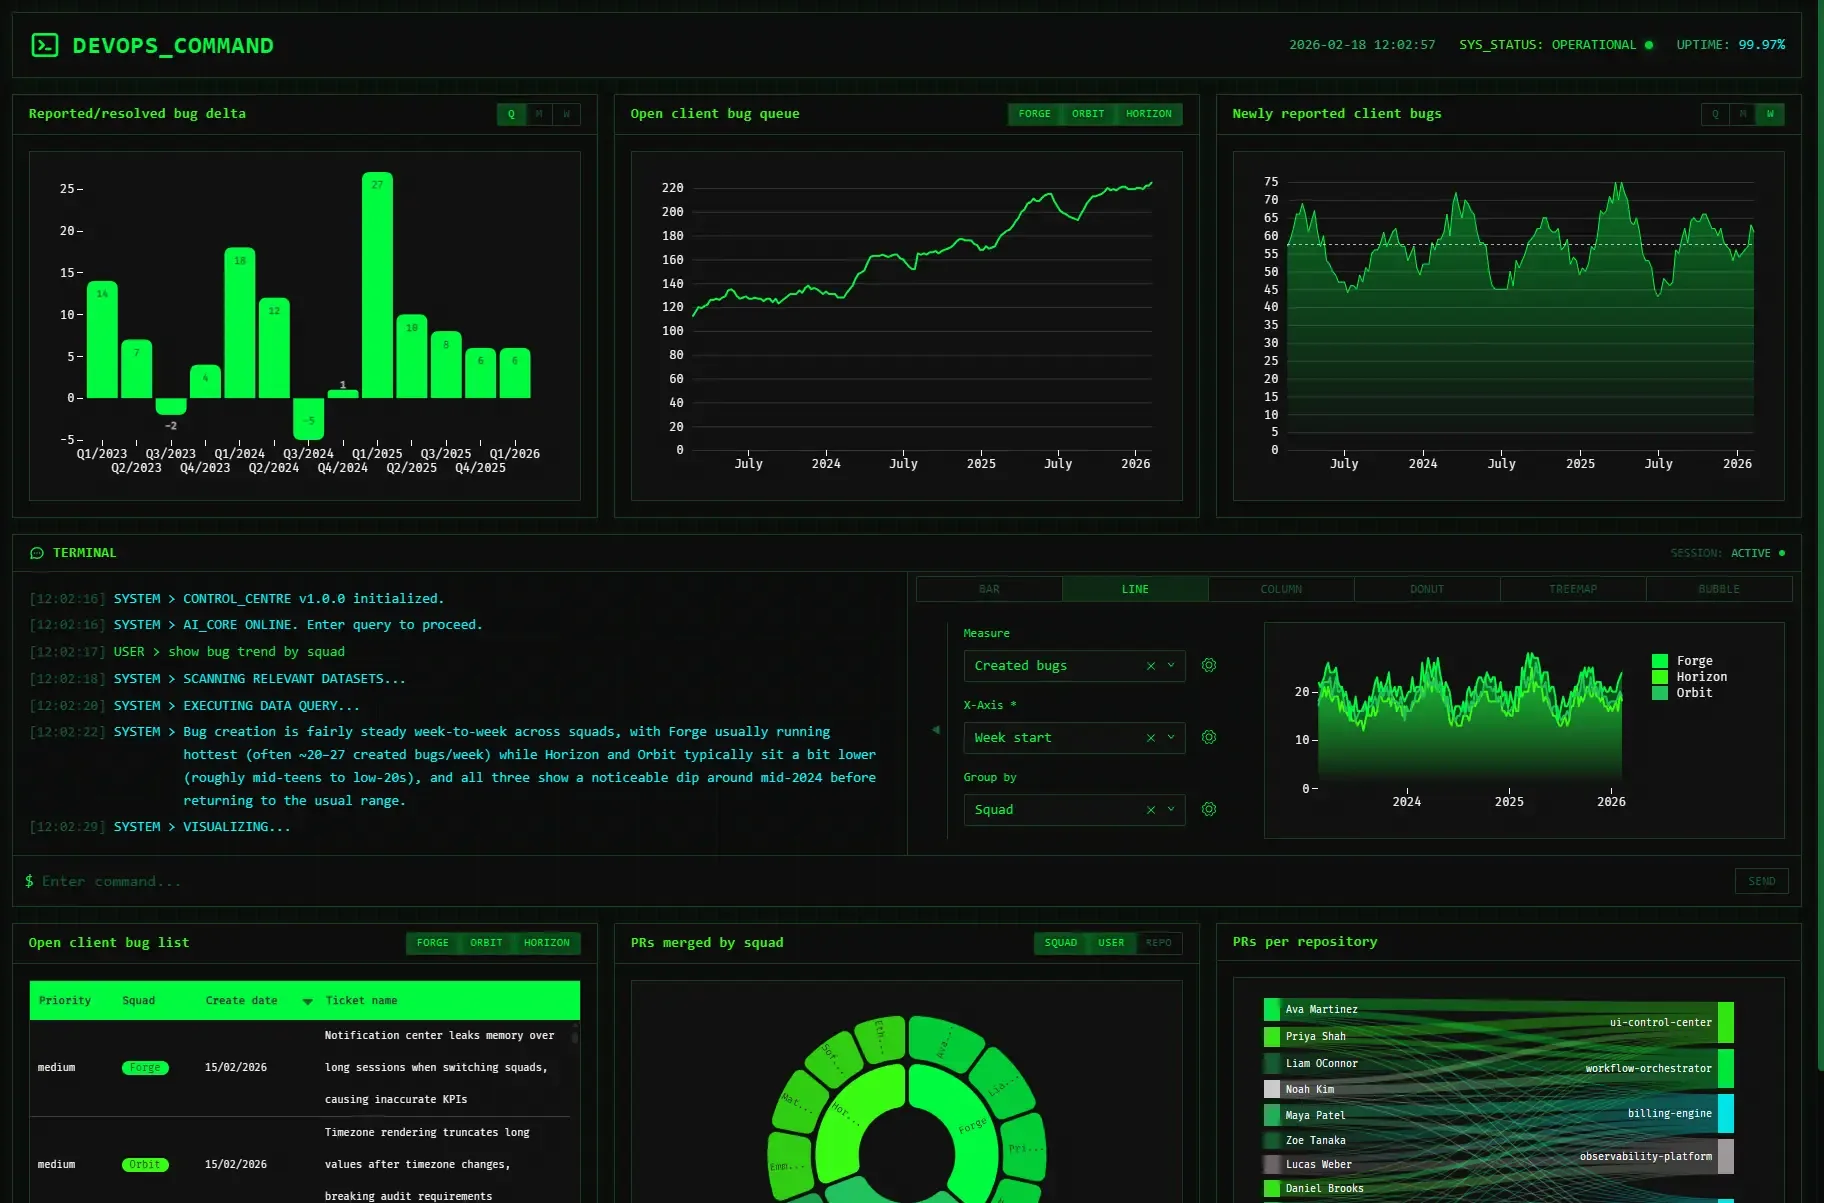
Guide users through building charts and tables from raw data, then compose them into interactive dashboards.
Learn more (opens in new tab)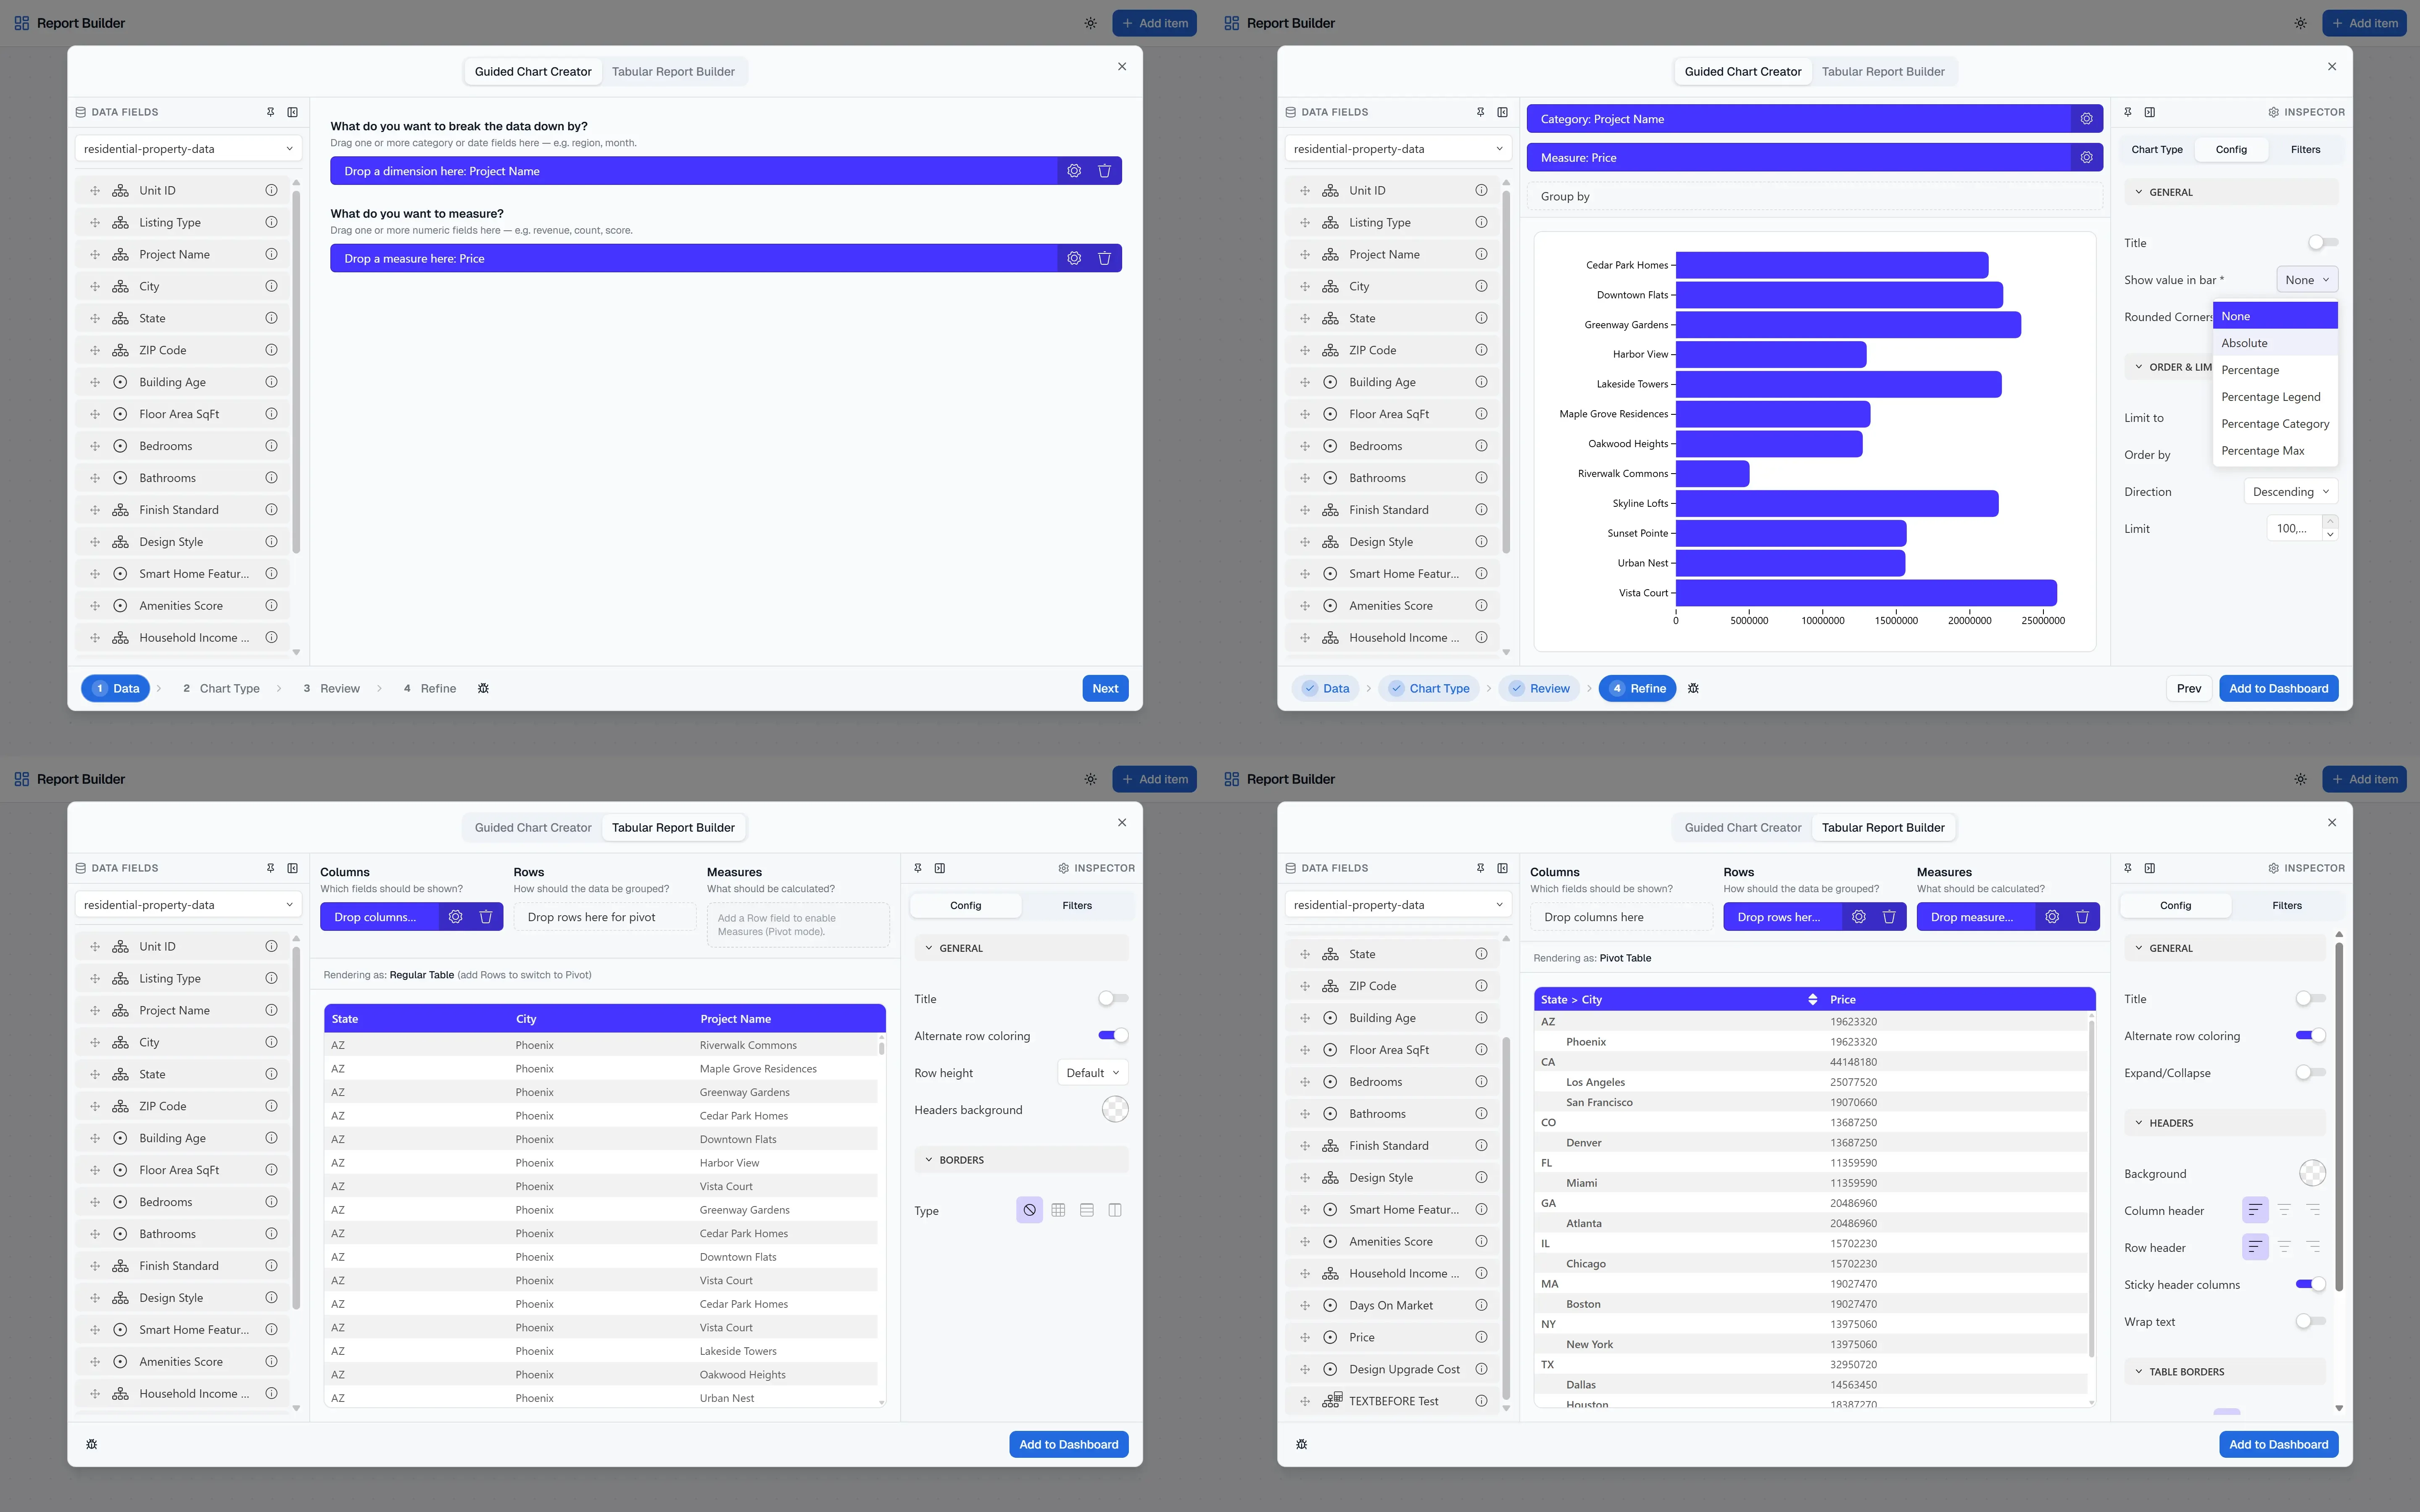
Scenario-driven financial planning dashboard with composable report builder, featuring scenario switching, global filters, and a guided/advanced report composer built on Luzmo ACK and Angular.
Learn more (opens in new tab)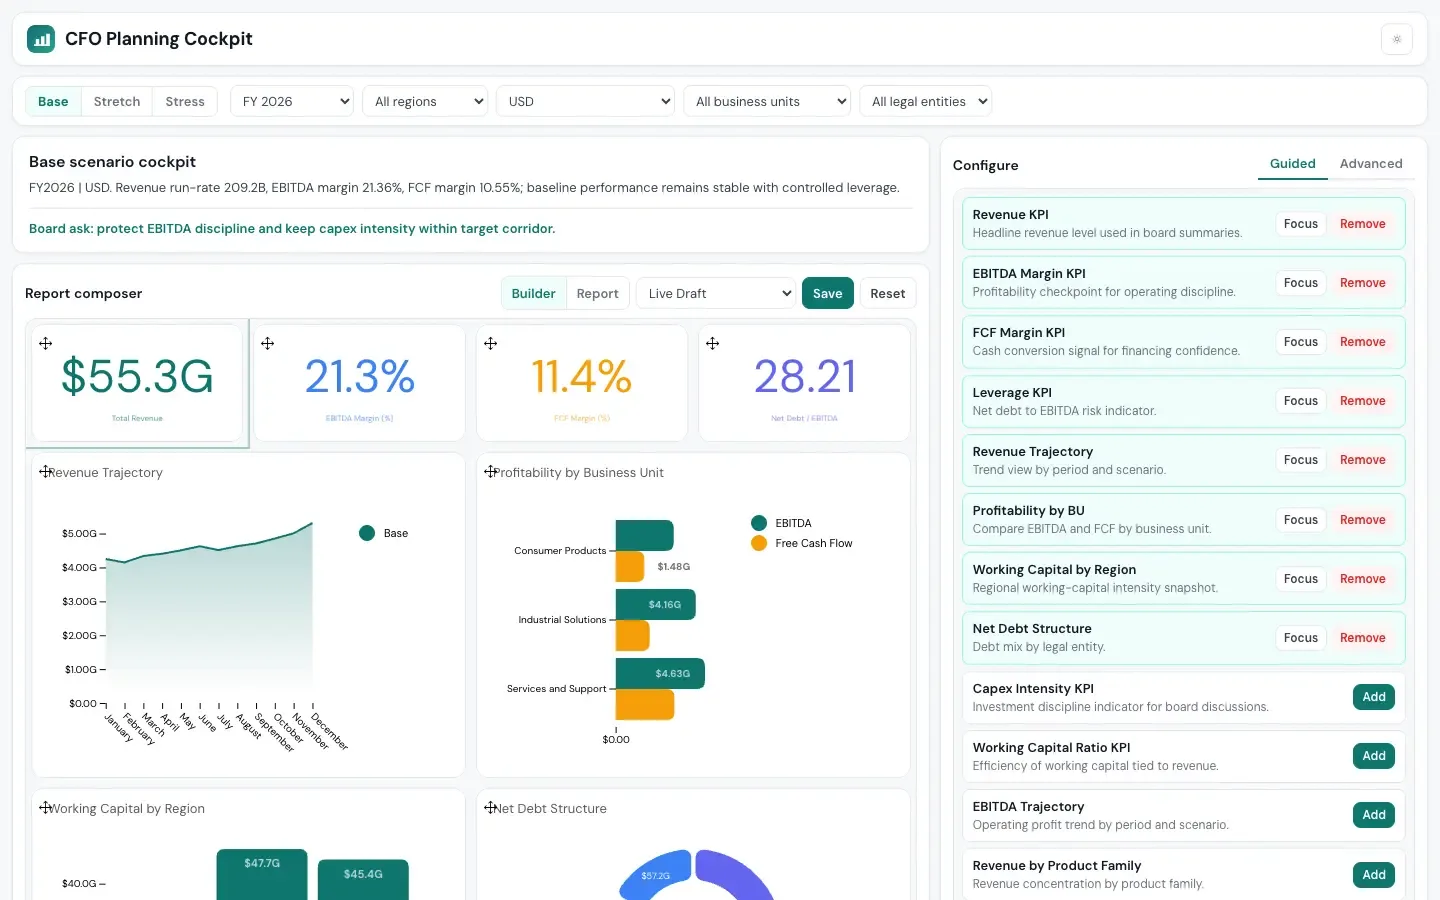
Use your own datasets and give your end-users the ability to create their own custom report.
Learn more (opens in new tab)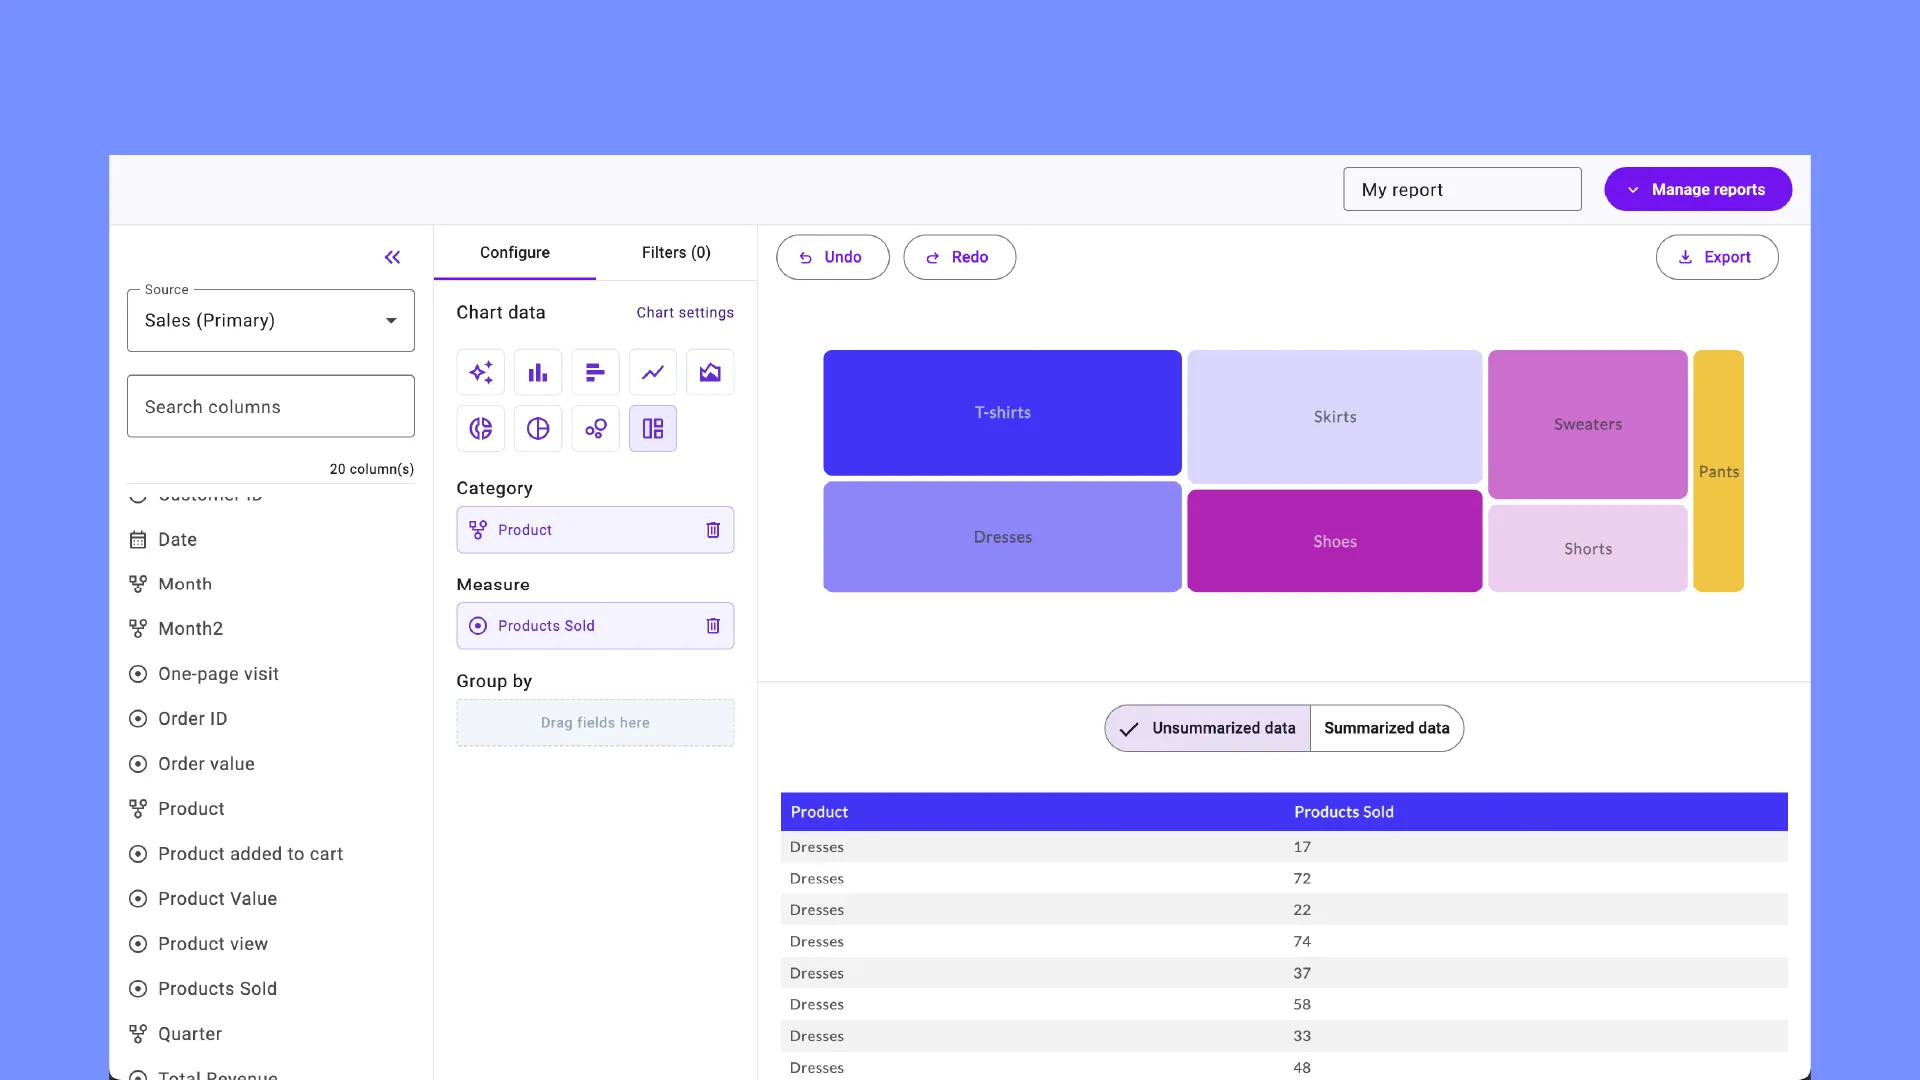
Click on a sample question or ask your own to create a chart, powered by AI.
Learn more (opens in new tab)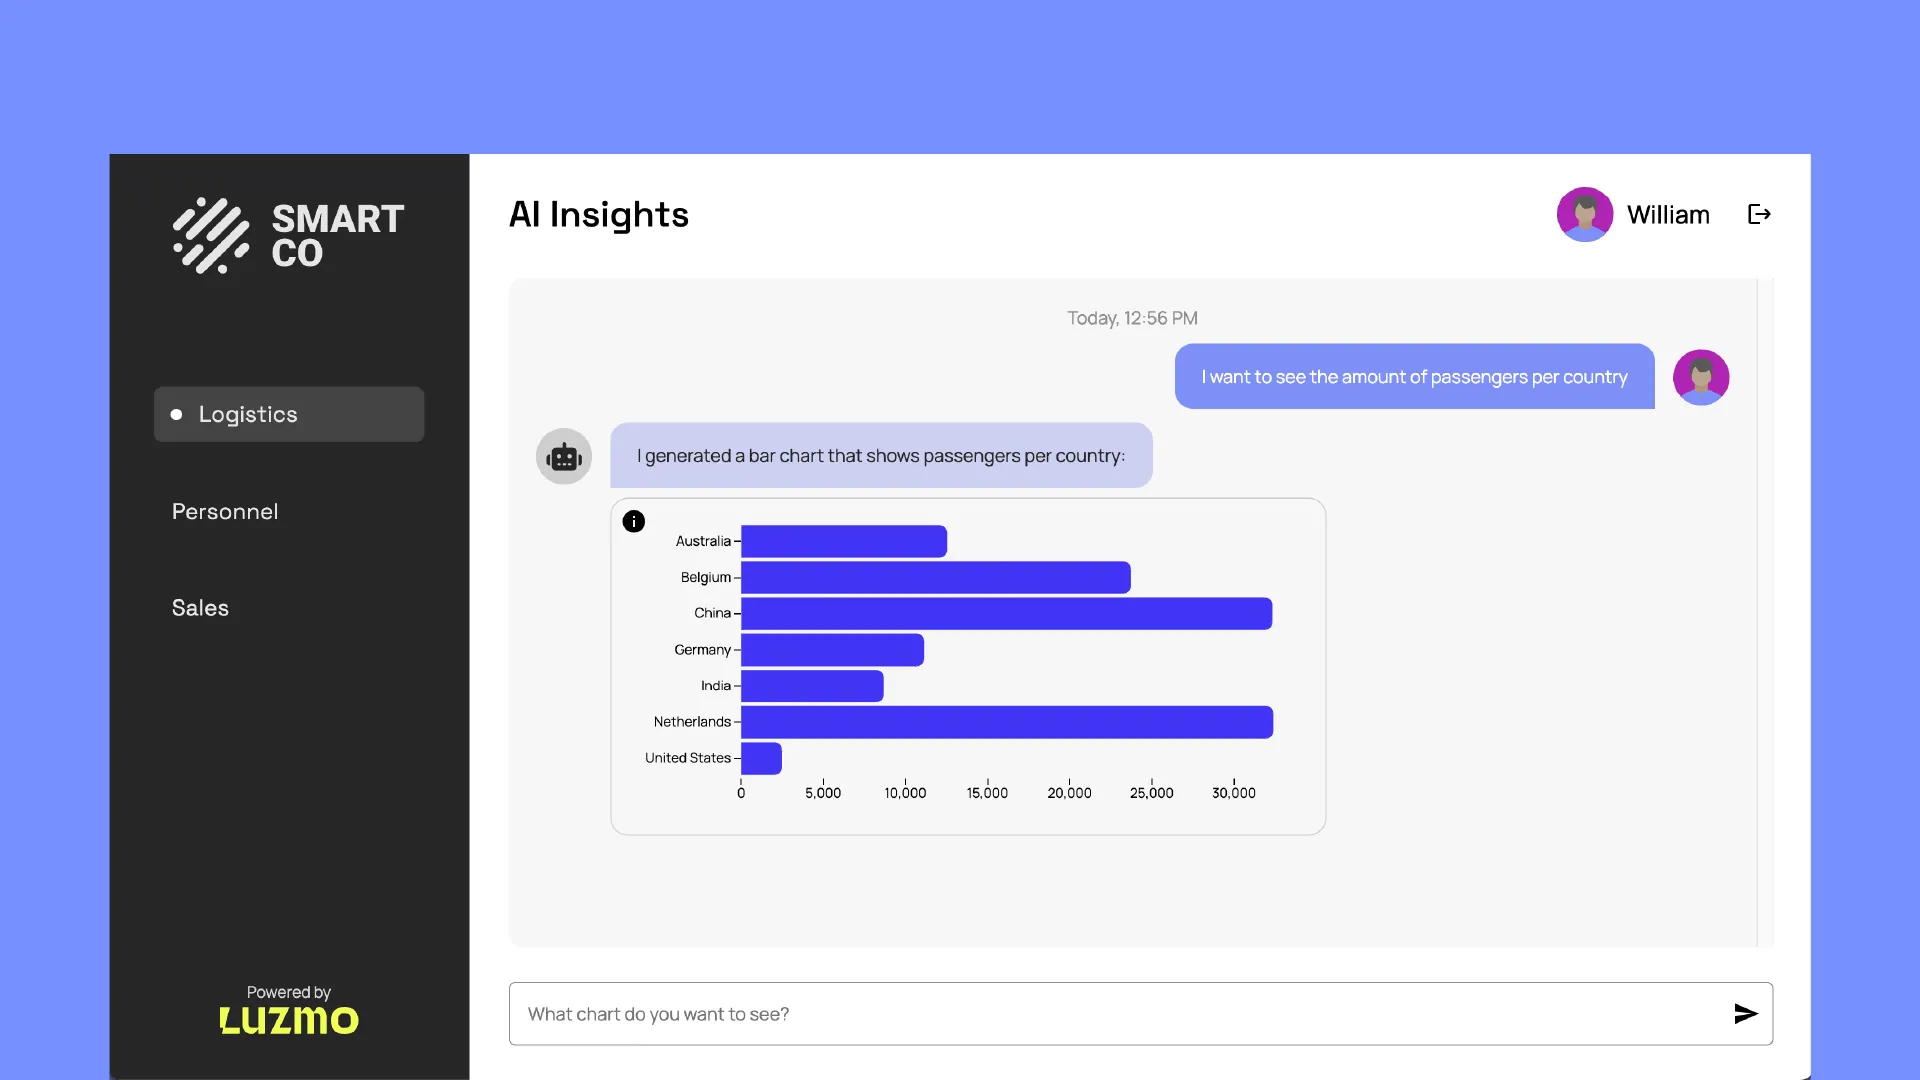
A chart library draws pictures. You still own the queries, the caching and the security. Here you do not.
Code-first speed without the limits of a basic chart library, and no query layer to maintain.
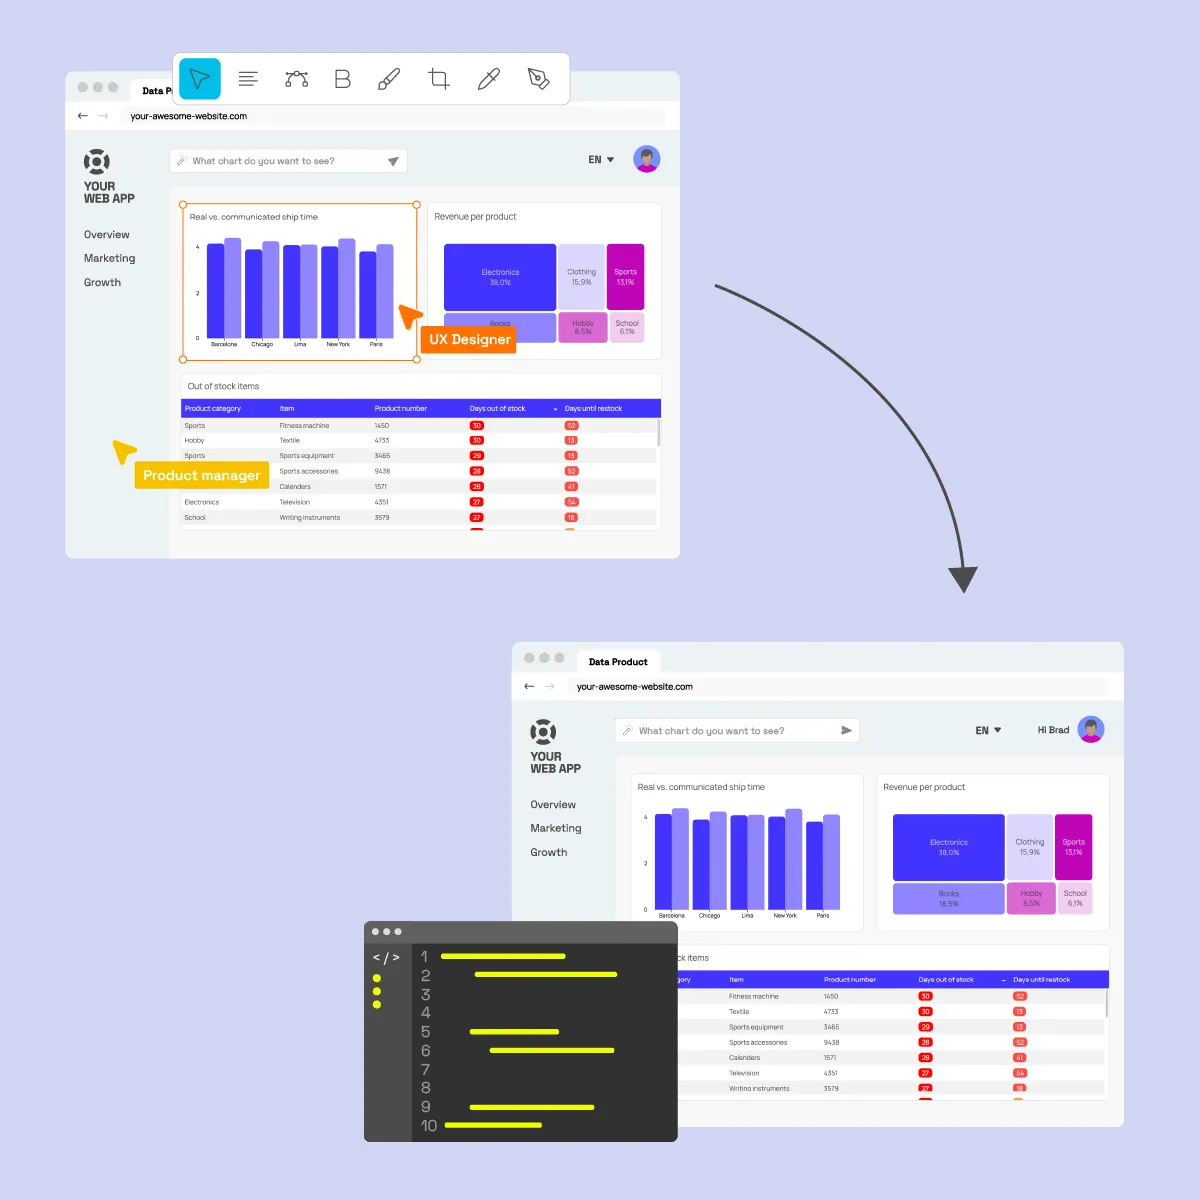
Leverage Luzmo's core features for easy data connection, auto-generated data queries, and secure data handling.
From ten customers to ten thousand on the same setup, with queries and caching that keep pace.
Customers

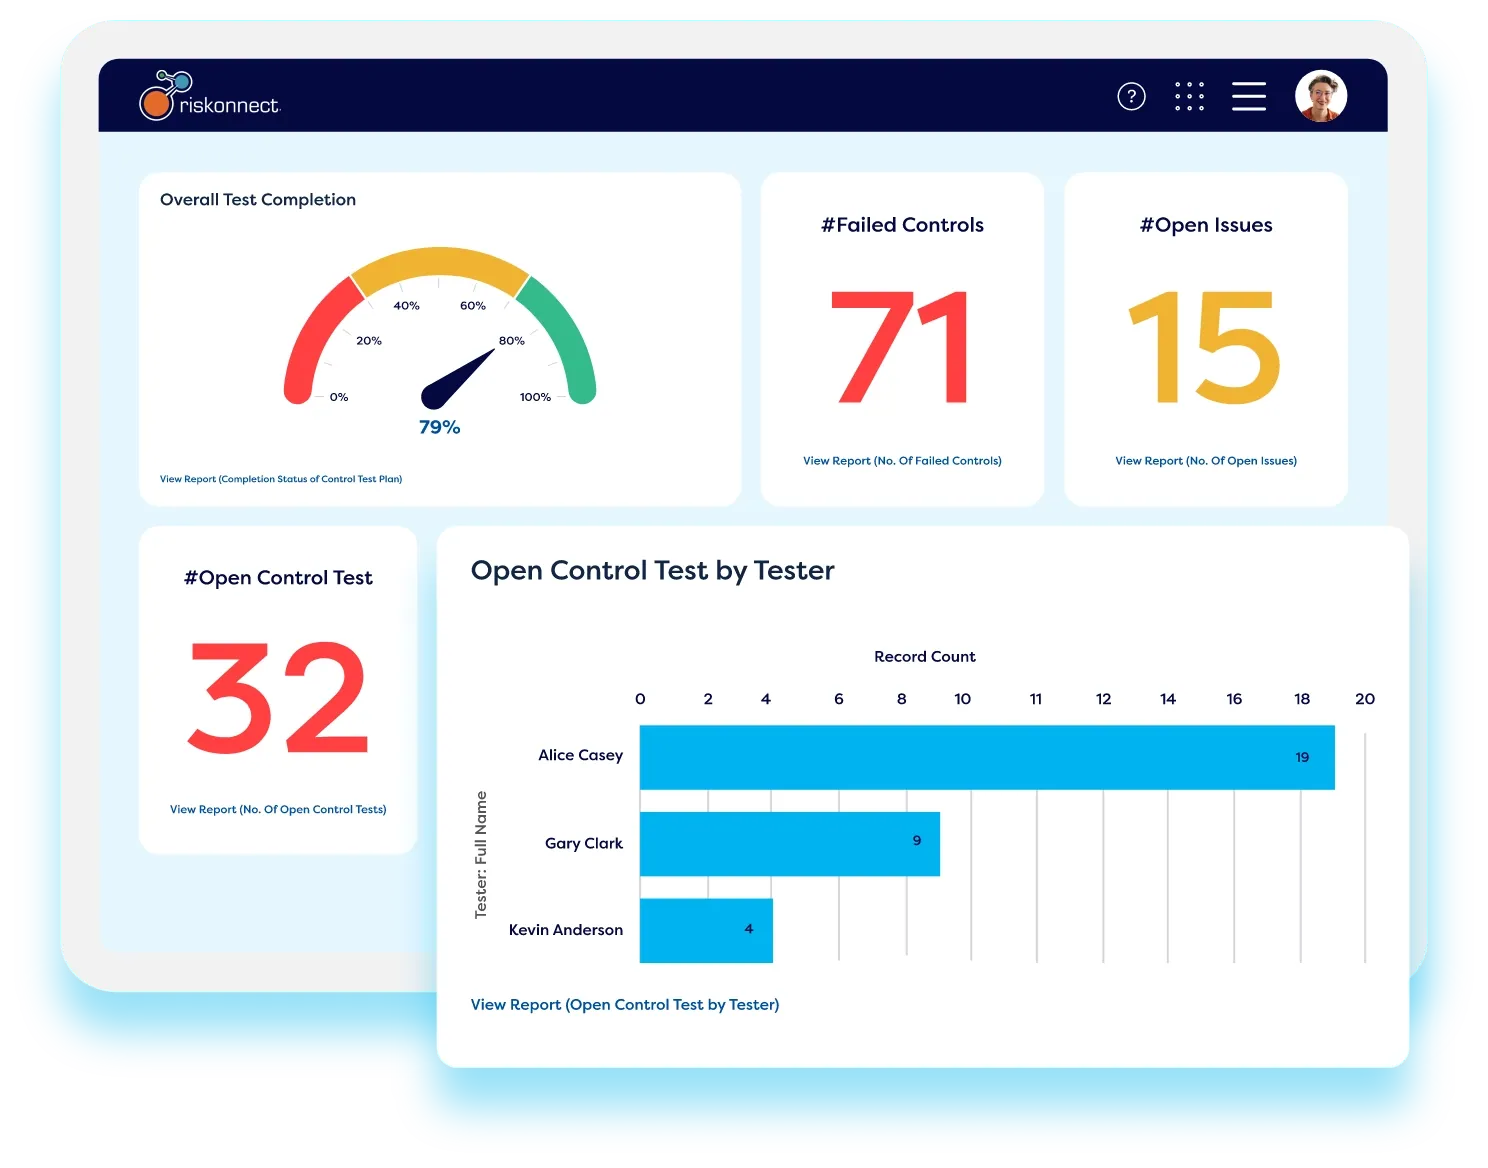
We used to receive hundreds of individual reporting requests every week. By embedding Luzmo, our customers now build and edit their own dashboards — giving our team faster support cycles and a real competitive advantage.Read case study

Sarah Zoloth
Product Manager at Riskonnect
Sarah Zoloth
Product Manager at Riskonnect
Reviewed by Yannick Crabbé, Product Manager
Your roadmap is too important to be stalled by legacy BI. Launch native, self-serve analytics this sprint.

Book your session with our analytics expert.