

NewContext for embedded AITake a look
Embed AI analytics your customers trust, everywhere they work.
Every question becomes a grounded, visual answer. Right in the tools your users live in: from your product to any bot you build.
4.6/5 on G2 and Capterra
Animated demonstration: one AI assistant answers follow-up questions about a retailer’s store performance, and the same answers appear inside their own product, in Slack, in Claude, in a bot they built, and on WhatsApp. Use the buttons below to see each one.
Same customer-facing analytics, right inside your product
Trusted by
- 4.6/5 from 100+ reviews on G2 & Capterra
- Lansweeper skipped 3 years of build
“Beautiful, out-of-the-box dashboards that can convince new clients!”
Case study
Matthieu Vegreville
Co-founder & COO
“With Luzmo, we skipped three years of development time and immediately jumped to a full-blown solution.”
Case study
Maarten Saeys
CPO
“Luzmo's flexibility and ease-of-use were unmatched in any other platform we evaluated. It is so easy and fun to use.”
Case study
Cedric Spaas
Product Expert Analytics







Grounded intelligence
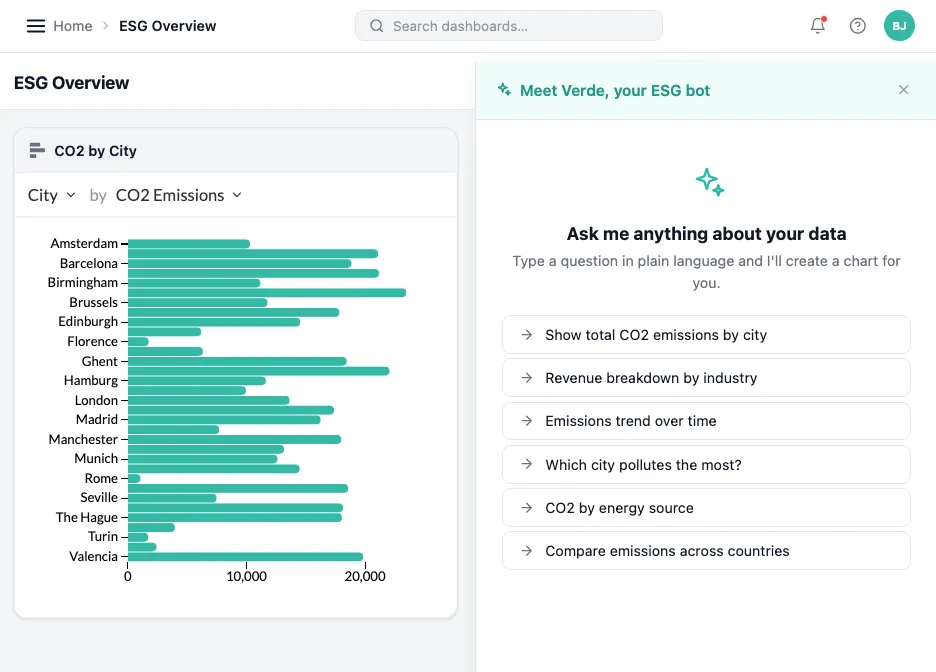
Agentic AI built into your product.No AI team required.
Three families of agents. For builders, for developers, for end users. All grounded in Luzmo's query engine, not in freeform LLM SQL.
Answers for your users
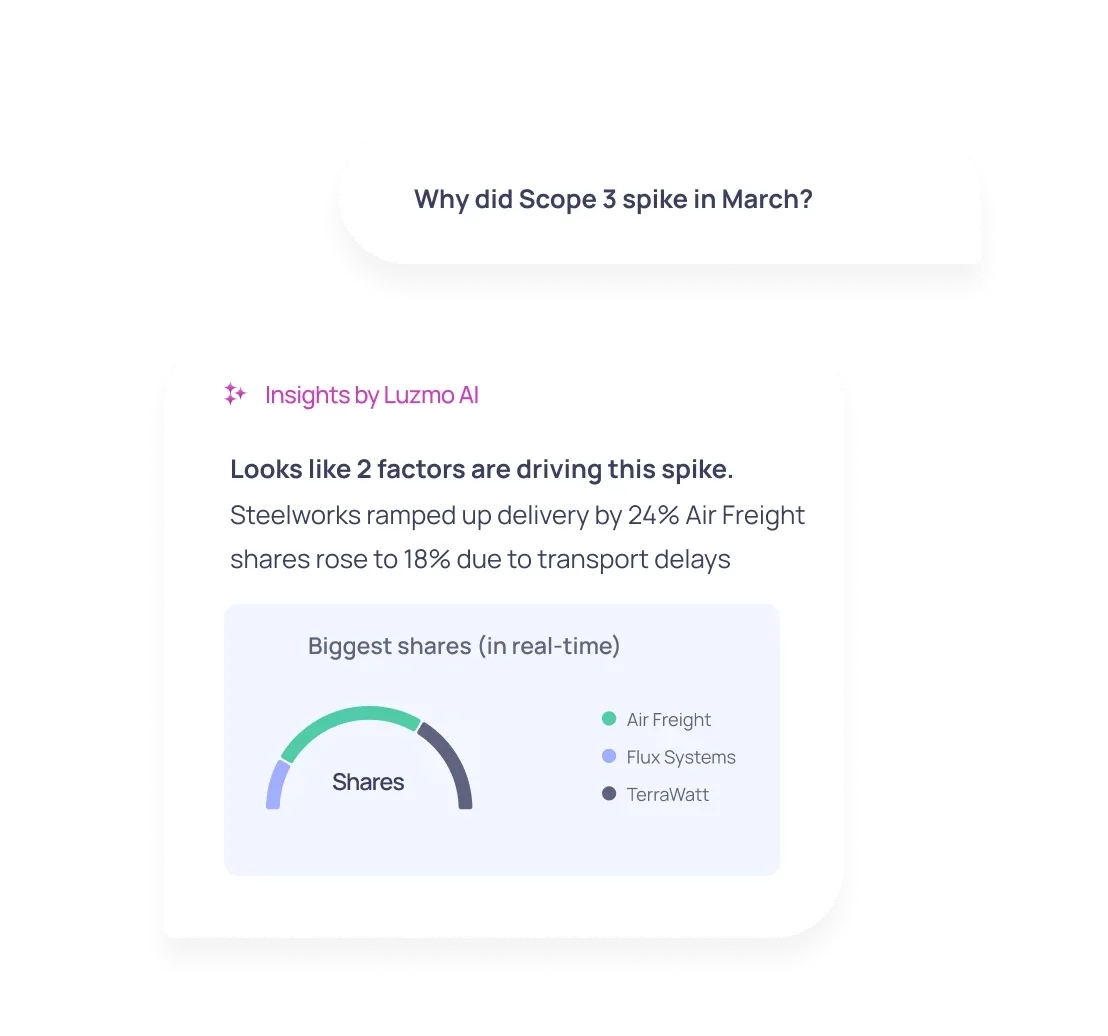
Your customers ask. Your data answers.
Natural language questions, computed by Luzmo's query engine. No hallucinated SQL, no leaked data.

AI ecosystem
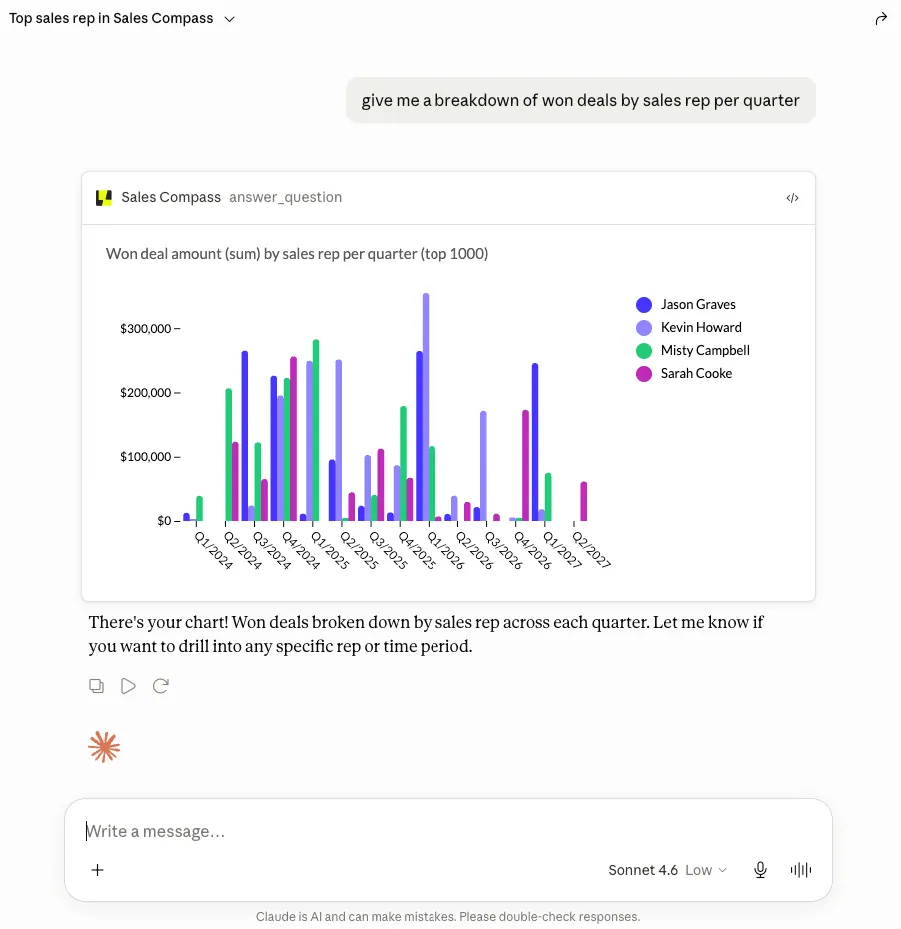
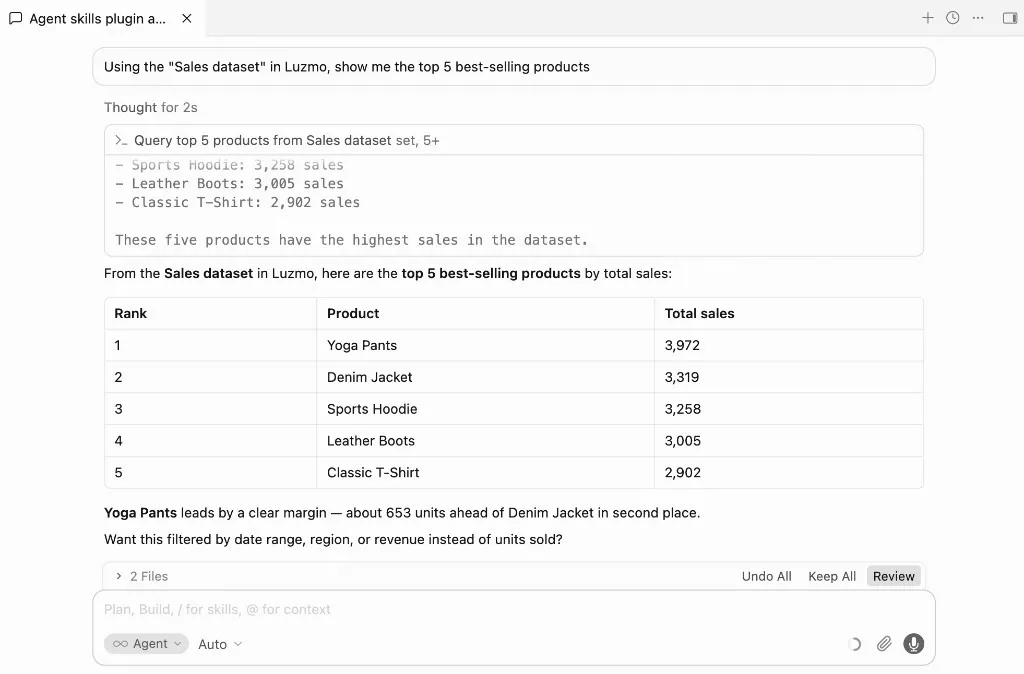
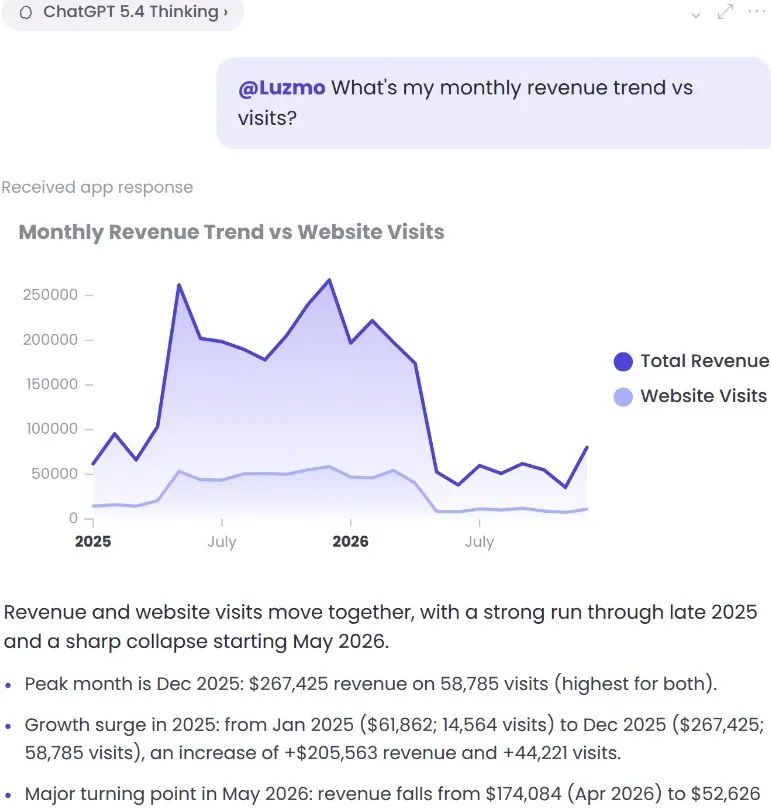
Meet Luzmo in the AI tools you already use.
Ask questions, visualize data, and uncover insights without leaving Claude, ChatGPT, Cursor, or your own AI agent.
Why Luzmo
Start fast with AI. Ship customer-ready with Luzmo.
A coding agent gets you started quickly. Luzmo turns it into a data product your customers can rely on.
@@AI alone → Luzmo
12-Scaffolds a chart, fast
12+Ships a governed data product, just as fast
13-Answers guessed by the LLM
13+Answers grounded in your business logic
14-You build security and multi-tenancy
14+Secure and multi-tenant from day one
15-Locked to the screen it was built for
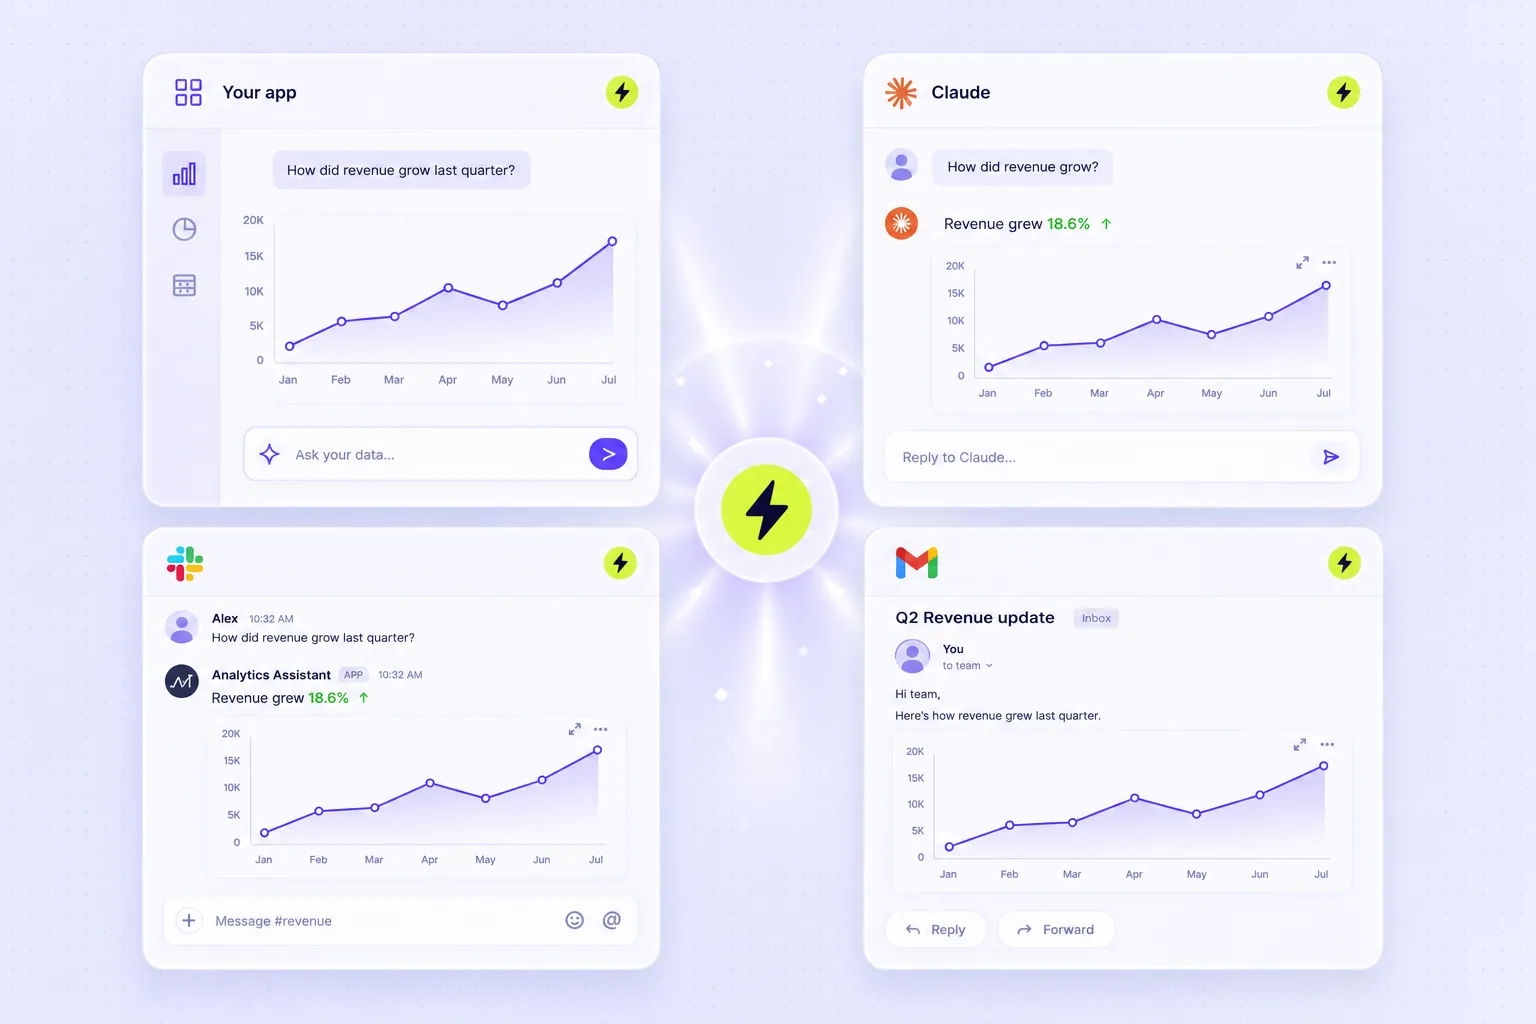
15+Works across app, chat, MCP and agents
16-You maintain the hard part forever
16+We run the production layer for you

With Luzmo, we skipped three years of development time and immediately jumped to a full-blown solution.
Maarten Saeys
CPO, Lansweeper
Product overview
Analytics that lives inside your product, not next to it
Give users insights and answers in a fully native product experience.
Start building with Luzmo.Using your own data.
Customers
How other product teams use Luzmo
Real products. Real integrations. Real users.

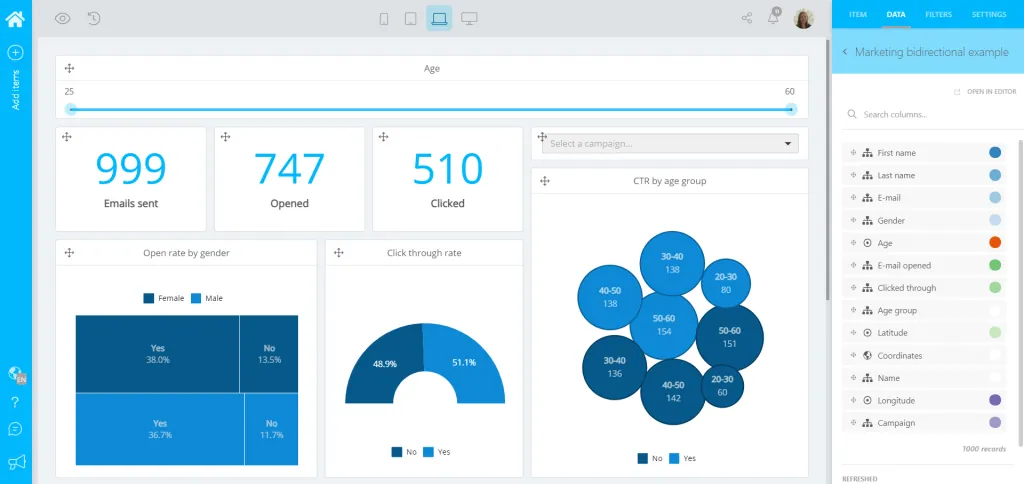
Luzmo's flexibility and ease-of-use were unmatched in any other platform we evaluated. It is so easy and fun to use.Read case study
Cedric Spaas
Product Expert Analytics at Marigold
Cedric Spaas
Product Expert Analytics at Marigold
Ship the future of your data
Let us show you what Luzmo can do for your product.

Book your session with our analytics expert.