What is Self Service Analytics? Definition, Examples and Tools
Up until a few years ago, business intelligence was reserved only for those with extensive knowledge of data analytics, data science, and engineering. But as BI tools evolved, it became easier for the average business user to explore and analyze data. This new democratization has a name - self-service analytics.
With self-service analytics, businesses across industries can become more data-driven by exploring data through dashboards, reports, and other types of visualizations.
What is self-service analytics?
Self-service analytics is an approach to data analysis where business users can access, analyze, and visualize data without requiring extensive knowledge of data science, engineering or analytics.
The purpose of self-service analytics is the democratization of data. Instead of leaving it in the hands of experts only, it allows the average user to create dashboards, reports and other types of visualizations to better understand their data and make improved business decisions.
The benefits of self-service analytics
Besides not having to hire data scientists to create the most simple graphs, there are quite a few benefits to self-service BI and analytics.
Empowering business users
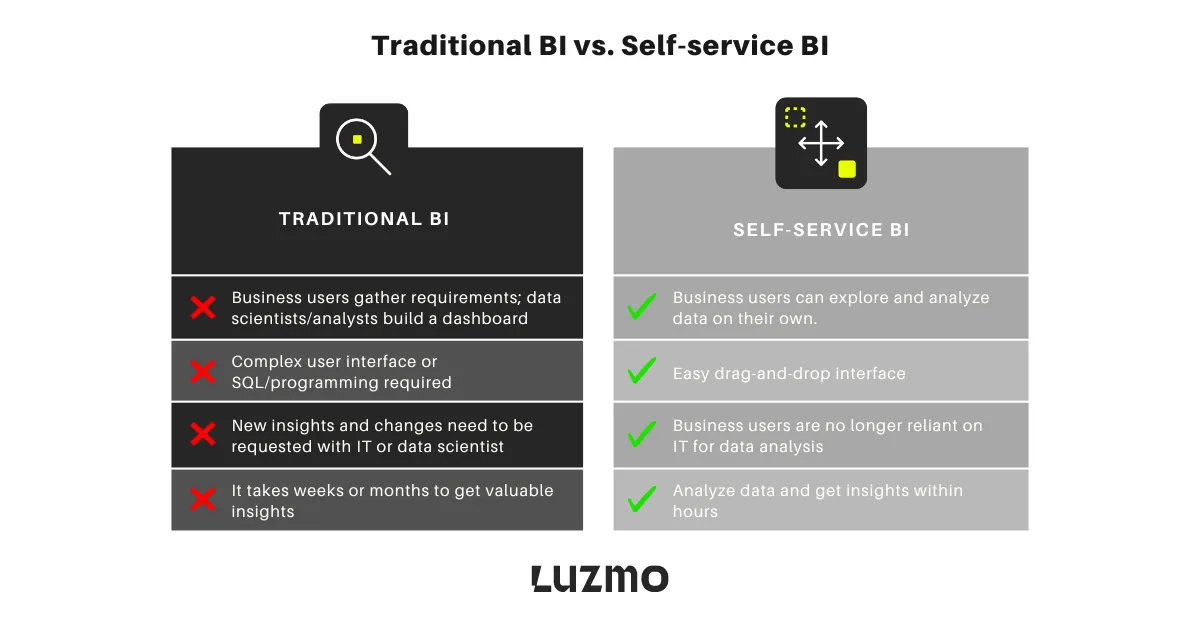
Self-service data analytics allows anyone with the most basic data literacy skills to create their own dashboards. Instead of waiting for a data analyst to connect the data sources, prepare and model the data and then visualize it, a marketer or salesperson can just create the visualizations on their own.
Improved decision making
You can create a data-driven culture with centralized data models. If everyone has the same data access, they can explore, analyze and visualize data on their own. This leads to higher independence from IT teams, but also better decision-making through all the layers of your business.
Cost-effectiveness
Modern self-service analytics tools use machine learning and natural language processing to allow anyone to explore their data. This helps your business because you no longer need 10 data analysts to connect a data warehouse and make a dashboard. Anyone who can work in Excel can work with a modern BI tool. The result is significant cost savings.
Improved scalability
Need to create analytics dashboards for hundreds of users? Self-service BI tools make it easy for 50 people just as it is for 5. Adding new users is a breeze, provided that you’re working on fully prepared and modeled data. You can streamline your operations and safeguard yourself from future changes by investing in a great self-service BI tool early on.
Improved collaboration across functions
If you’re tired of data silos, self-service analytics is the solution for you. Multiple teams can use these BI tools to create dashboards and analyze data in real time. Since you’re all working on identical datasets, you can collaborate more effectively on cross-department initiatives.
Better customization
Thanks to automation features, smart templates and great onboarding, anyone can not only create but also customize their dashboards to meet their needs. You can change the widgets, the design, the layout, visualization types, levels of access and much more. And you don’t need a team of developers to do any of this.
The downsides of self-service analytics
While self-service analytics promise actionable insights, there are some challenges that you should be aware of.
Lack of expertise
Just because your end-users have access to self-service analytics tools, this does not make them data analysts. Without proper training on data governance and data visualization, they’ll rely on tools too much and make the wrong conclusions.
For example, non-technical users could choose the wrong metrics or visualization types and turn good datasets into a proper data visualization mess.
Before empowering them with the tools for data analysis, make sure to give your team or your end-users some basic knowledge on how the tool works and what they can expect.
Tool complexity and usability
If you want to help your customers make more data-driven decisions, you may choose popular analytics solutions such as Tableau, Power BI, Qlik and others. And while these are incredibly powerful tools, they are not always the best solution for self-service business intelligence.
They are primarily built for in-house data analytics teams, which means that they may not be user-friendly for the typical person who wants to create a dashboard based on a prepared dataset.
Choose a self-service analytics platform built primarily for self-service BI and you’ll ensure that your end-users can create visualizations without constantly nagging the IT team when they get stuck.
The BI tool pricing
Take a look at a Gartner report for self-service analytics tools and try to figure out how much it will cost you to use one for your team or customers. Each tool has its own use cases, APIs, connectors and workflows and, more often than not, pricing is based on usage you can’t predict.
For most of the enterprise-grade tools, pricing is not only difficult to figure out, but once you do, you’ll be blown away. Tools such as Looker can cost $90,000 and more per year for self-service analytics. Sisense pricing is another notorious example.
Get a self-service analytics tool that grows with your business
At Luzmo, we built our platform as self-service from the start. Unlike major players such as Tableau or Power BI, embedding and self-service features are not an afterthought. Luzmo features are built for SaaS teams looking to enable their customers to make more data-driven decisions.
Luzmo is easy to use for your customers and developers, the pricing is predictable and we can help you out if you get stuck along the way.
Want to learn more? Grab a free demo with our team to learn how your product can benefit from self service analytics!
Written by

Ship the future of your data
Let us show you what Luzmo can do for your product.

Leave your e-mail and one of our analytics experts will reach out to you