7 Best Self Service BI Tools to Try in 2025

Up until recently, business intelligence and data analytics were something only reserved for those with high levels of tech literacy. As BI tools became more common, creating dashboards from various sources became available to a larger group of people. Most importantly, business users of your apps can now create and interpret dashboards.
Self-service BI allows people who use your product to get in control of their data through data visualization and analysis. But how do you choose a BI platform to help you get there?
Let’s explore some of your options for self-service BI in 2025.
What is self-service business intelligence?
Self-service business intelligence or self-service BI is the practice where non-technical users use analytics tools to access, analyze, and visualize data on their own.
In traditional BI settings, teams of data analysts, data scientists and other professionals use business intelligence tools to for data preparation and analysis. The end-user merely views the data.
Self-service BI puts the power in the hands of business users, letting them explore data on their own terms and make more informed decisions, more quickly.
Benefits of self-service BI
Giving the power of data analysis to your software users has a few upsides, both for the user and your business.
Empowering end-users to create real-time, ad hoc reports. With user-friendly self-service BI tools, your team or users don’t have to ask the IT department to create a dashboard or analyze some data for them.
Improved decision-making process. Your end-users now have access to key business data in a format they can easily understand and act on.
Higher revenue. Use interactive dashboards to upsell your existing and new customers. You can charge them extra for analytics capabilities through an add-on or create an entirely new plan with analytics at its core. With actionable insights in your app, your customer lifetime value grows too.
Improved collaboration. With self-service tools, you get improved data management. Everyone can work on the same datasets and create different dashboards for their own use cases. For example, marketing and sales can use the same data to create two entirely different visualizations, but the data stays consistent, fostering better collaboration.
Top features to look out for in self-service BI tools
There is a lot of BI software out there, and if you’re looking for a self-service use case, you should pay attention to a specific set of features.
- Easy embedding
Unlike dashboards for internal use, self-service dashboards have to be embedded in your SaaS product. You don’t want to send your end-users away from your platform, into a separate BI tool, to analyze their data. This means a great API, plug-and-play libraries and other factors that make it easy for your developers to embed a dashboard.
- A variety of data sources
Great self-service BI tools connect with data warehouses, data lakes, and many other business tools through connectors. This makes it easy for your developers to put everything together without running into bottlenecks that require custom code from scratch.
- Ease of use for the end-user
To get to data-driven decisions, the end-user of your SaaS product should be able to easily and quickly create a dashboard in your app, without any knowledge of data analytics tools. Non-technical users should be able to create data visualizations and interpret them. This feature is even more important if you offer an embedded dashboard editor, where users not only view dashboards but create their own.
- Customization
The BI solution you choose should look and feel like a part of your app. This means that the design of the dashboard should fit neatly into the user experience of your product.
- Security
Through SSO and other protocols, a self-service BI tool should allow your team members and no one else to access their dashboards. Whether you need internal or customer-facing dashboards, access management is crucial.
The best self-service BI tools for SaaS products in 2025
Some BI tools are built with self-service as their core functionality. Others (such as Tableau) are primarily made for internal reporting and offer self-service capabilities as an extra for businesses with SaaS products.
Luzmo
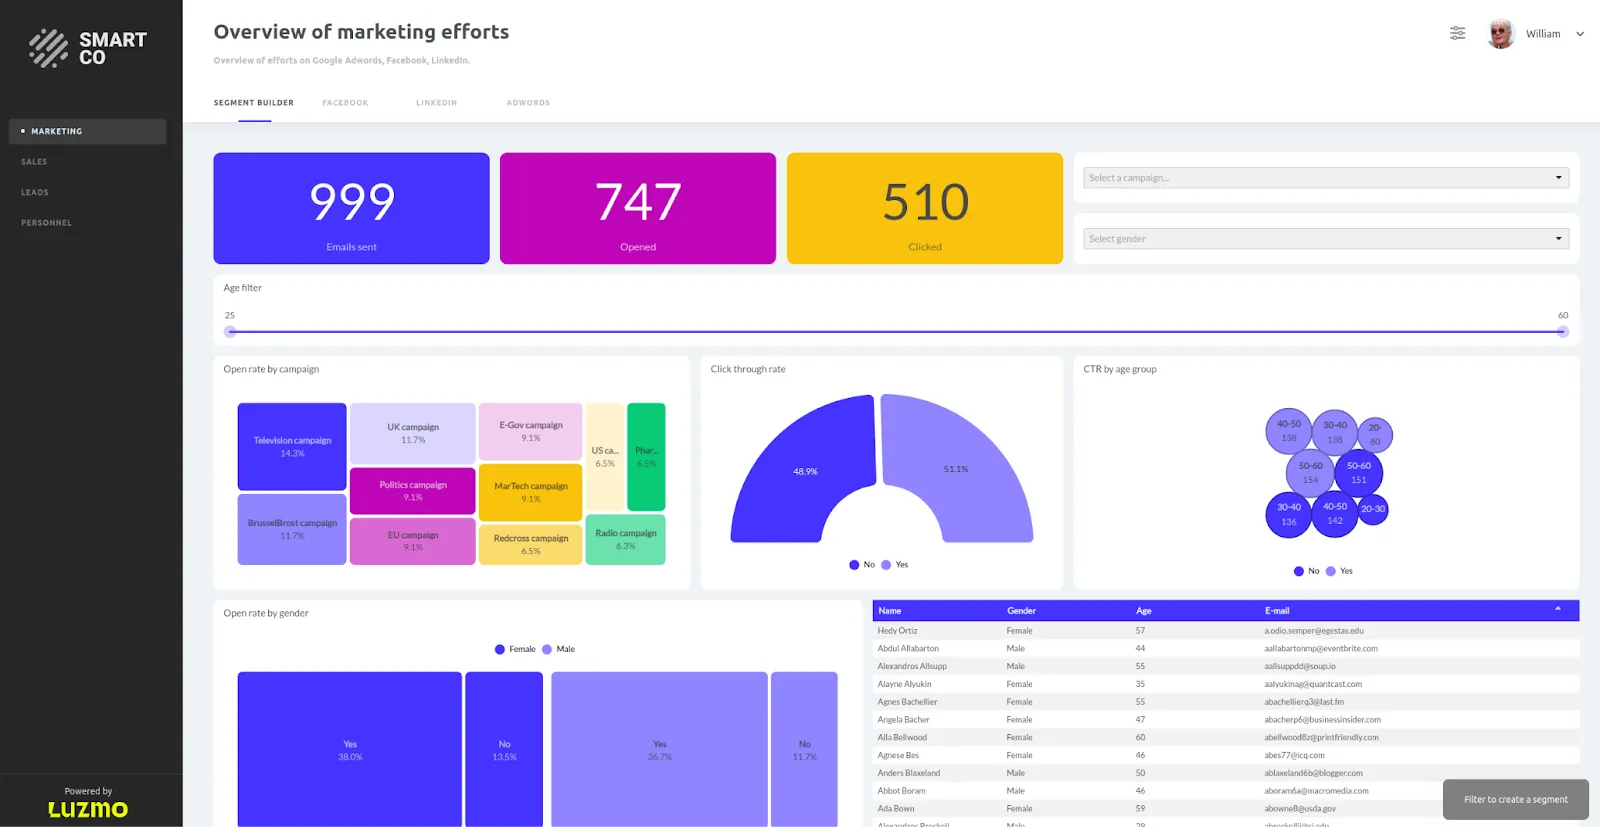
You can have your cake and eat it too with Luzmo. In other words, your developers will have an easy time creating and embedding dashboards in your product, and your end-users will enjoy the great user interface.
Luzmo has a powerful API, allowing you to connect a variety of tools and data sources to your dashboards and embed them quickly. The rich customization options mean that your dashboard will match the UI and UX of the rest of your product.
For self-service analytics, Luzmo comes with a set of pre-built dashboard templates. Your business users can pick a template without wondering which metric to use and without calling up your IT teams for help.
And if you want to take things to the next level, you can build your own custom templates to expose to your end-users. They can make their own edits to your templates, or even build dashboards from scratch, all within your SaaS app’s interface.
SaaS teams love Luzmo because of its ease of use, drag-and-drop embedded dashboard builder, and how easy it fits into any business workflow. Last but not least, there is the transparent pricing.
You can get a free trial of Luzmo today, and paid plans start at $995 per month.
Tableau
Tableau for embedded analytics is a good choice if you’re already using this tool for internal reporting. And why wouldn’t you be - it has some of the best visualizations in the industry, a huge community and an endless pool of developers specializing in Tableau.
For embedded systems though, there are some issues. The dashboards are very easy to embed thanks to the powerful Tableau API. But other than that, doing anything than creating a super basic dashboard is going to take lots of workarounds and a capable Tableau developer.
Costs are another issue because of the complex viewer/user setup in Tableau. You can expect to pay at least $4,000 per month to use this BI tool in a self-service capability.
Domo
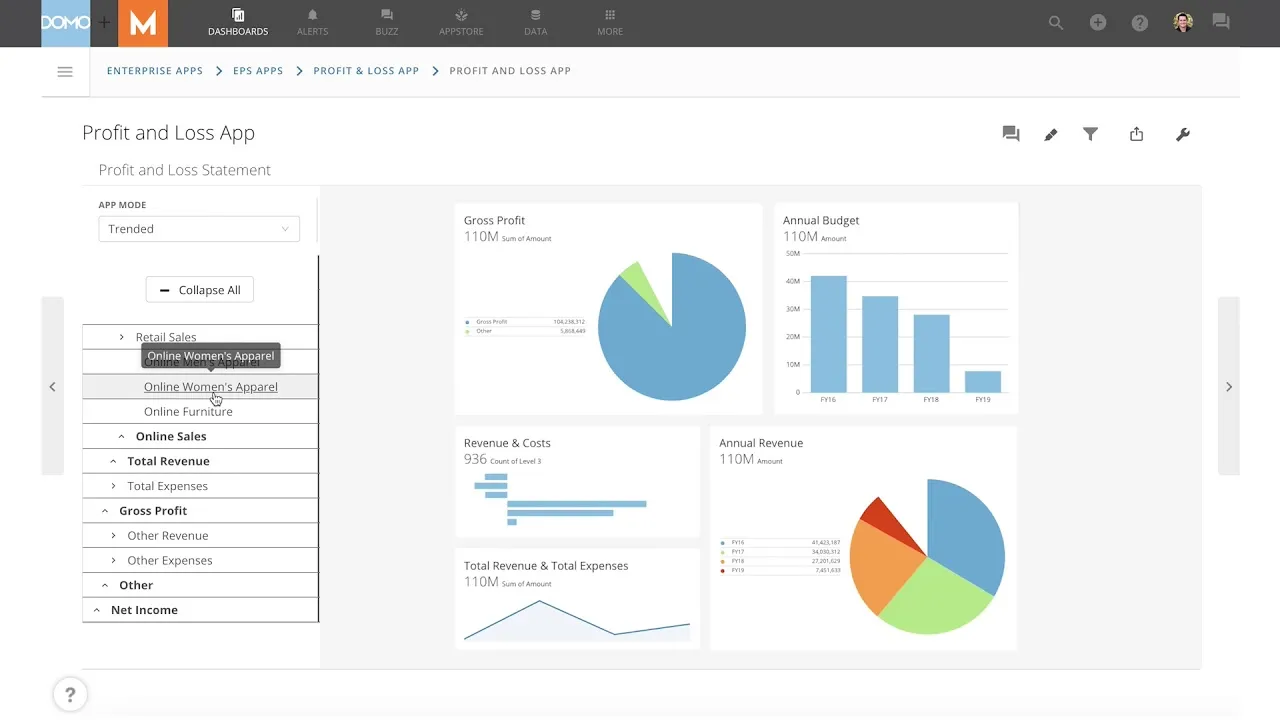
If you want an embedded analytics platform that also comes with ETL and performs exceptionally fast, Domo is your pick. Other key features include over 1,000 pre-built connectors and data sources, as well as relatively easy embedding process.
According to 2025 reviews, there are really two downsides to this provider. First, their customer support is lackluster and you’re going to have to troubleshoot on your own if you get stuck.
Second, figuring out the pricing may require a crystal ball because there are many different variables that go into the final amount you’ll get on your Domo bill each month.
Microsoft Power BI
Power BI can be used for embedded analytics and comes with a rich feature set translated from their main offering. You can set up different levels of authentication and allow the end user to either view or work on the visualizations, depending on your preferences and business use case.
If you want the most basic embedded dashboard, you can get this process done by using their SDK and you don’t need to spend a lot of time or code here. However, if you want to create more complex visualizations, you’re definitely going to need a Power BI developer to get the job done.
Pricing is not disclosed, but one thing is for sure - scalability goes out the window with this BI tool. Each viewer needs to have a Power BI license, which means that self service initiatives can be very costly for your business.
Sisense
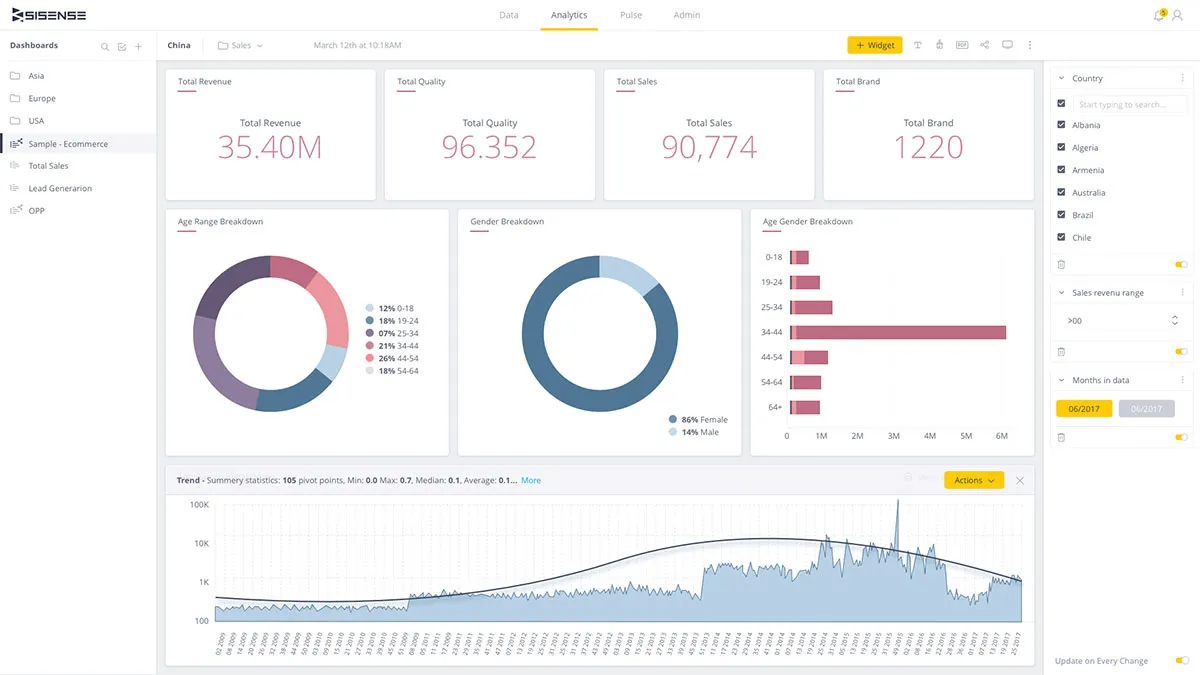
Sisense was built as a self-service BI tool from the start, which can be seen from some of its many ways to create and embed dashboards in your product. Through Sisense Fusion Embed or Sisense Compose SDK, you can plug a dashboard into your SaaS app.
Choose Sisense if you need real-time dashboards with fast access to every main KPI. It also comes with artificial intelligence features, allowing you to ask questions in natural language and get answers about your data, without any background in data science.
In practice, Sisense is very difficult to set up for dev teams, and getting it to work properly internally or for customer-facing use cases is complex. Also, it does not allow for a lot of customization in terms of both the visualizations and how they fit into your app.
Sisense pricing starts at a minimum of $10,000 per year for the most basic on-premise analytics setup.
Qlik Sense
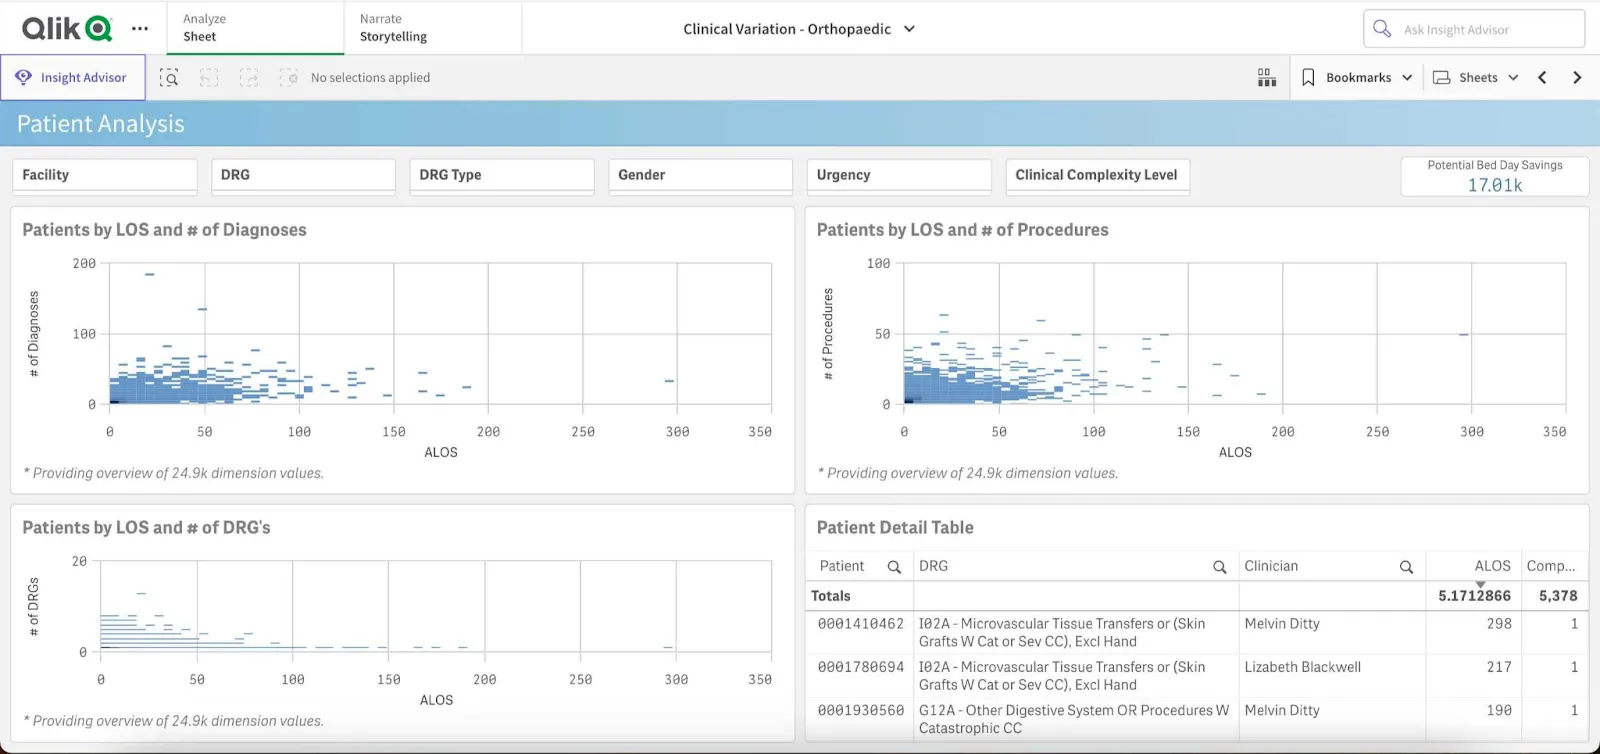
Qlik’s embedded analytics is not as well-known as the rest of its BI offer, but it’s still an excellent competitor to keep in mind for your self-service BI setup.
The good sides are: 160+ data connectors, fast performance, AI features for data exploration, solid user experience.
On the flip side, there is not a lot of customization you can do for your dashboards. For the AI features to work, the data needs to be cleaned, prepared and formatted ahead of time, so it’s hardly a case of data democratization.
To get self-service analytics in Qlik, expect to pay at least $2,700 per month, which gets you 50GB of data annually for 10 users.
Looker
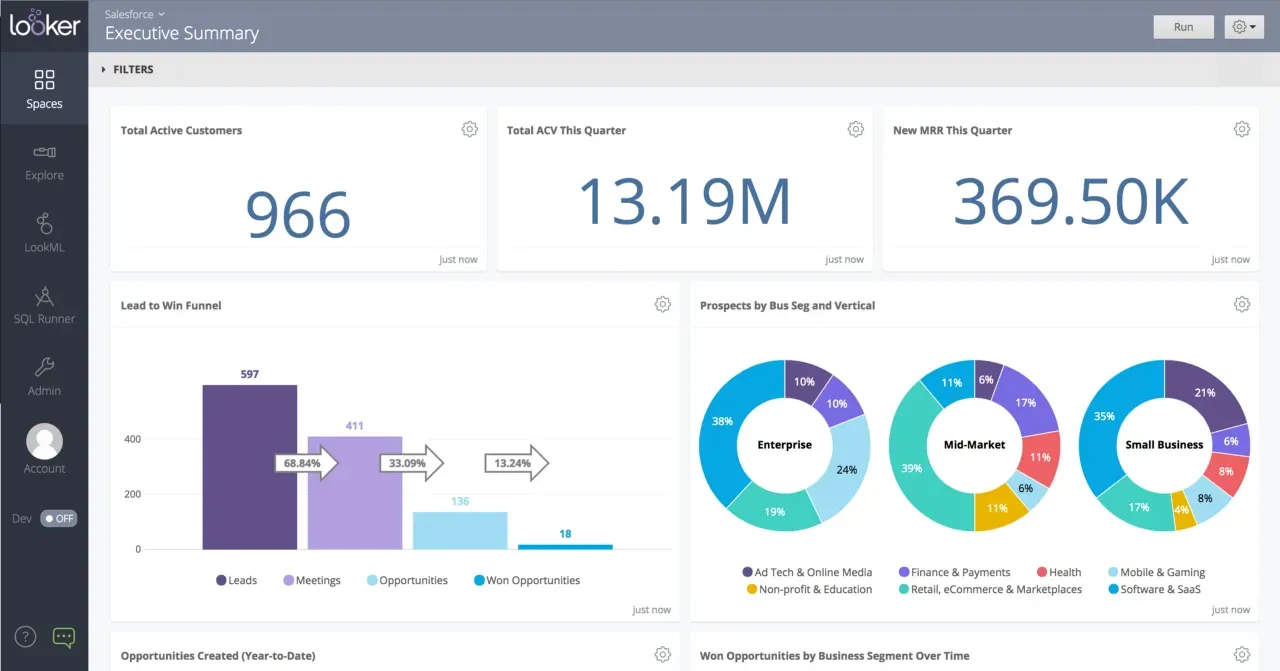
The powerful business intelligence tool now owned by Google, Looker is one of the most effective ways to turn countless data points into beautiful visualizations. Graphs, charts, histograms - Looker has one of the largest visualization choices in the world of BI.
However, it’s evident that Looker was not primarily built for embedded analytics. Instead of a drag-and-drop builder, you have to write queries in a language called LookML, a variation of SQL. Changing what the dashboard looks like within your app is also pretty complex.
Last but not least, Looker is very expensive, even more so when you get into self-service analytics and have to determine how many users will view dashboards in your app.
Looker will set you back at least $5,000 per month.
Wrapping up
Say goodbye to Excel spreadsheets and welcome the new era of business intelligence. Whether you want to use it for your internal stakeholders or for the customers who use your SaaS product, self-service analytics can empower everyone to make better decisions.
And if you want a tool that both your developers and customers will love, give Luzmo a try! Grab a free demo with our team to learn how your product can benefit from self-service analytics today.
Written by

Ship the future of your data
Let us show you what Luzmo can do for your product.

Leave your e-mail and one of our analytics experts will reach out to you