8 BI Tools To Start Using in 2026
Did you know that 35% of Amazon’s total sales come from something called Collaborative Filtering Engine? This functionality sounds complex but it’s actually simple - it uses data to recommend customers products based on their shopping history. Amazon collects about 1 exabyte of customer data for this purpose.
If you want this kind of success for your business, you need to collect, analyze and interpret a lot of data. And you don’t have to be Amazon to get started. All you need is a great business intelligence tool.
We’ve picked out the very best choices for you to try in 2026, and explained what each one is best used for.
Why great BI tools need data visualization
In its raw form, data is like having a list of ingredients. Flour and eggs on their own are great, but it takes a cook to know how to make a cake. Similarly, you can have a boatload of data available, but you’ll need clear data visualizations to make sense of it all.
Data visualization means using dashboards to show data points in context and connect the dots. Instead of plain numbers, visualizations from relevant data sources tell you a story. So, instead of looking at individual sales numbers, Amazon can, for example, determine which groups of products are often sold together by using data discovery.
Luzmo
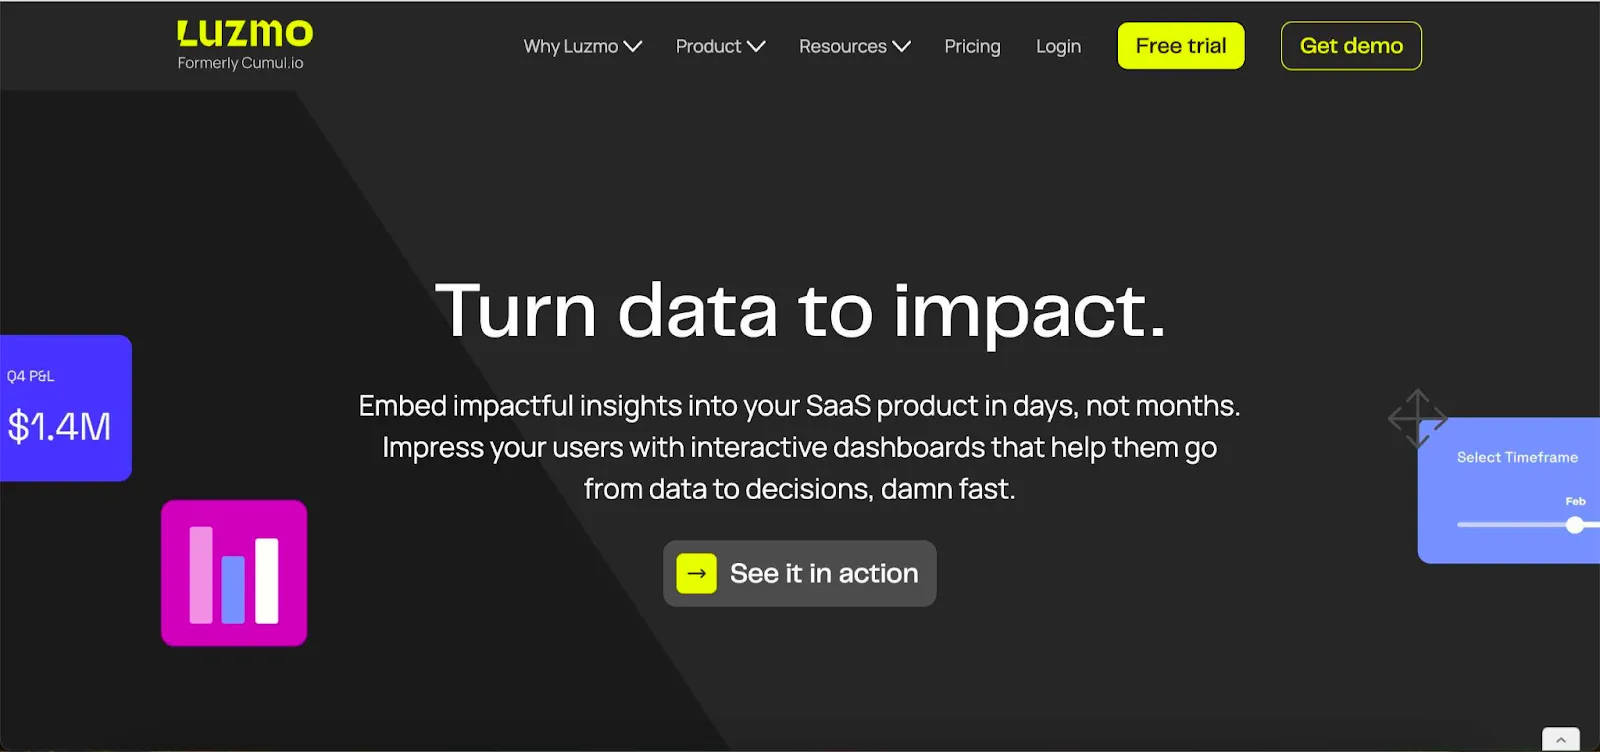
Best for: embedded analytics - adding embedded dashboards to existing products and websites
Luzmo lets you add interactive dashboards to SaaS products. With our tool, you can create a beautiful, intuitive dashboard and embed it in your SaaS app in a matter of hours - not weeks or months.
Some other business intelligence companies on this list offer this feature too. However, for most of them it’s not their core focus, which is why they are often too complex, requiremany resources and hiring additional team members.
With Luzmo, just about anyone can grab an account, connect their sources and data sets and add a functional dashboard to their SaaS tool. You can use this dashboard to provide more insights about the value of the product, upsell your existing users or create an add-on to existing pricing plans.
For customer-facing use cases, compare the best embedded analytics tools instead.
Or if you want to take your reporting experience to the next level, Luzmo even allows embedding a full dashboard editing mode. Let your product users build their own reports or edit your templates with simple drag and drop, and forget those hefty backlogs of analytical feature requests.
Want to learn more about how Luzmo can help you with embedded analytics? Book your free demo today!
Tableau
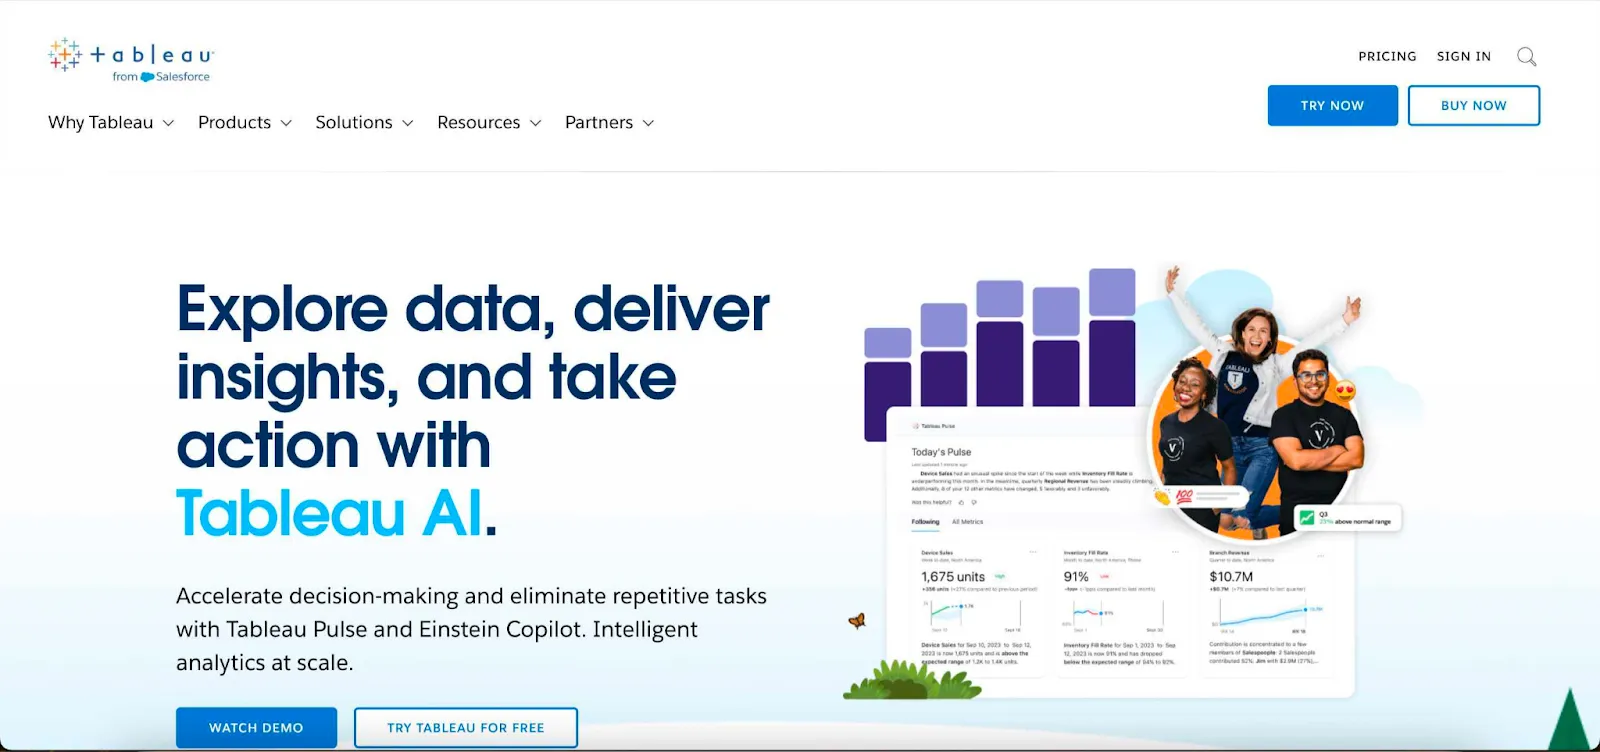
Best for: mid-to-large-sized businesses that need a big online community to tap into
It’s hard to talk about business intelligence software without mentioning the elephant in the room. After 20 years in the business (and one acquisition by Salesforce), Tableau is known as one of the most widely used BI tools today.
If offers a lot in one package: amazing versatility of analytics tools, wide range of visualizations and data sources, AI through Tableau Pulse and Tableau Agent, and much more. You can use it as a standalone, on-premises desktop tool or as part of the Tableau Server offering.
The wide array of features means that Tableau is not the most user-friendly and that making the most out of it will take quite a bit of learning. Luckily, their customer support is amazing so you can reach out and get answers quickly.
Even more importantly, it has a large and vibrant community of users that can show you the best way to get the maximum out of Tableau. So, if you need help with big data modeling or data integration, someone will help promptly.
Microsoft Power BI
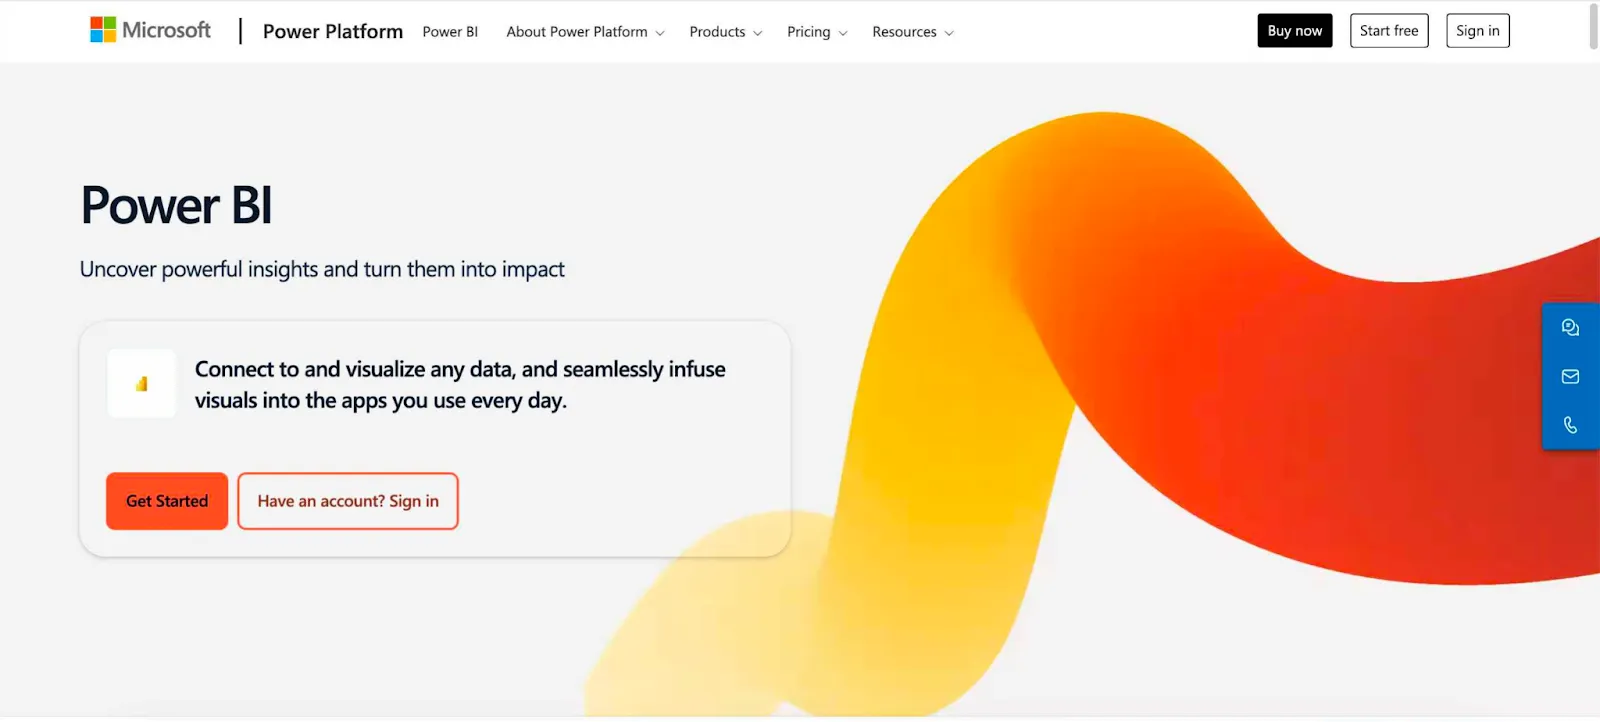
Best for: teams already using other Microsoft tools
If you’re already in the Microsoft ecosystem, using Power BI is a no-brainer. This massively capable tool is based on Azure and connects to a large number of databases and even some online sources such as Google Analytics and Facebook.
You can pick from a large number of data visualization types in your dashboards. However, unlike Tableau, it’s not very fast and does not handle large volumes of data very well. If you want the basic BI software capabilities, then Power BI might not be the best choice.
The selection of features, visualizations, and data exploration capabilities is vast. On the other hand, going from data to business decisions can take time because many users complain that Power BI is very clunky and difficult to use.
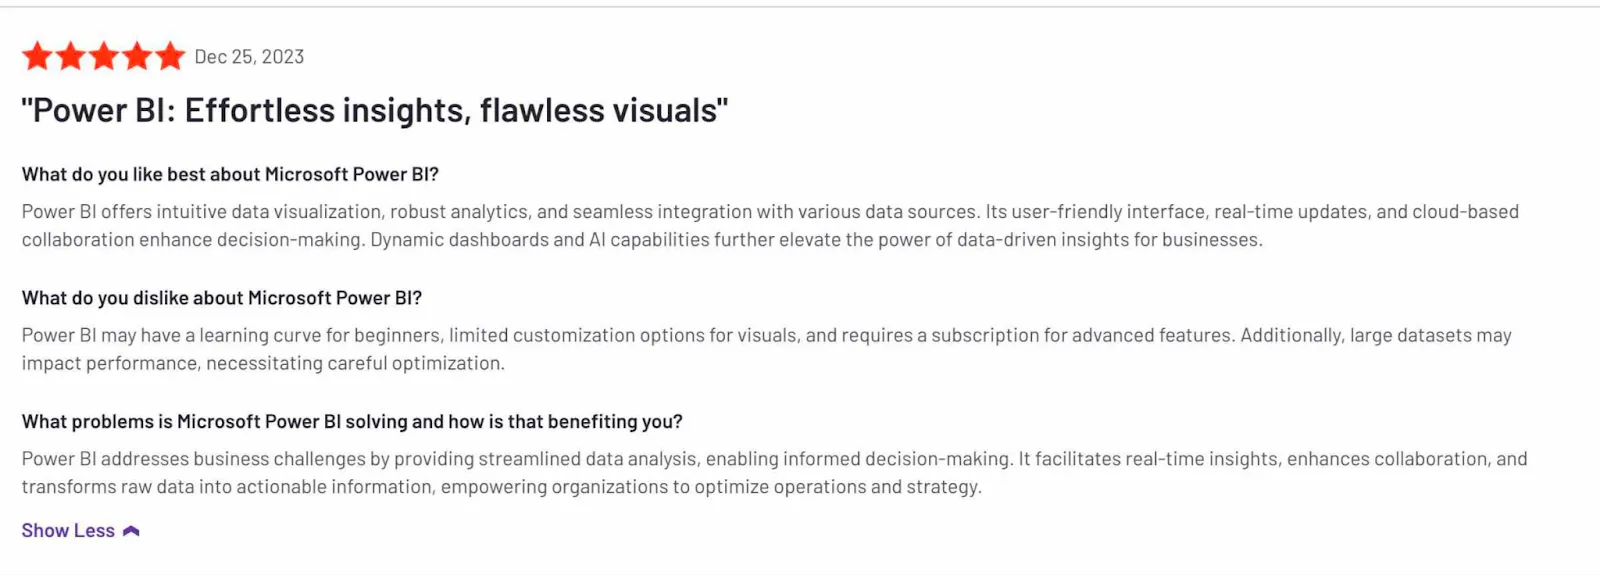
A large part of that is because Power BI is essentially built to be a desktop tool. Switching back and forth between the web and desktop tools can be a hassle. Just doing the basics such as adding branding to a business analytics dashboard can get very complicated.
One thing is certain though, a large portion of the Power BI user base sticks to this tool because they already use a variety of other Microsoft tools for data-
Domo
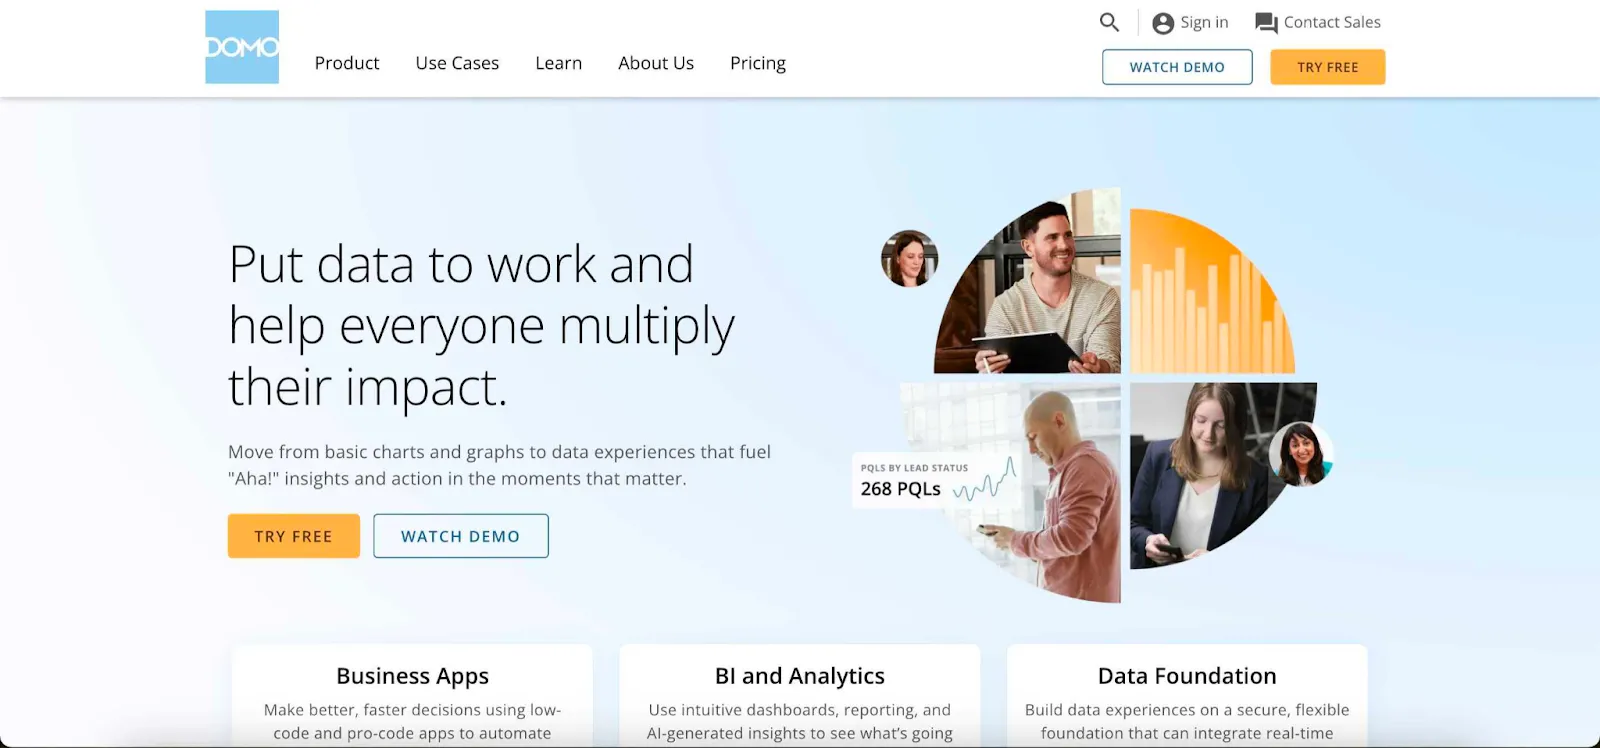
Best for: real-time data monitoring
Looking for a comprehensive business intelligence tool that has it all in one place? Data warehouse, ETL, visualization in one package - it’s what Domo is all about. One particular strength of Domo is that you can easily create dashboards and monitor data in real time. It also offers Domo Everywhere for embedded, customer-facing dashboards and Domo.AI agents.
The downsides? Many users complain that Domo is extremely expensive. Its pricing is consumption/credit-based and not published, and even for enterprise teams used to Power BI and Tableau pricing, Domo is considered pricey. It does automate a lot of the complex tasks such as predictive analytics, but the added cost of a new data team hire + Domo might not be worth it.
It’s also not very easy to use. If you learn how to navigate the user experience, you’ll be stuck with the speed of processing data. It does offer a lot of options but the real-time data monitoring may not be worth the hassle.
Looker
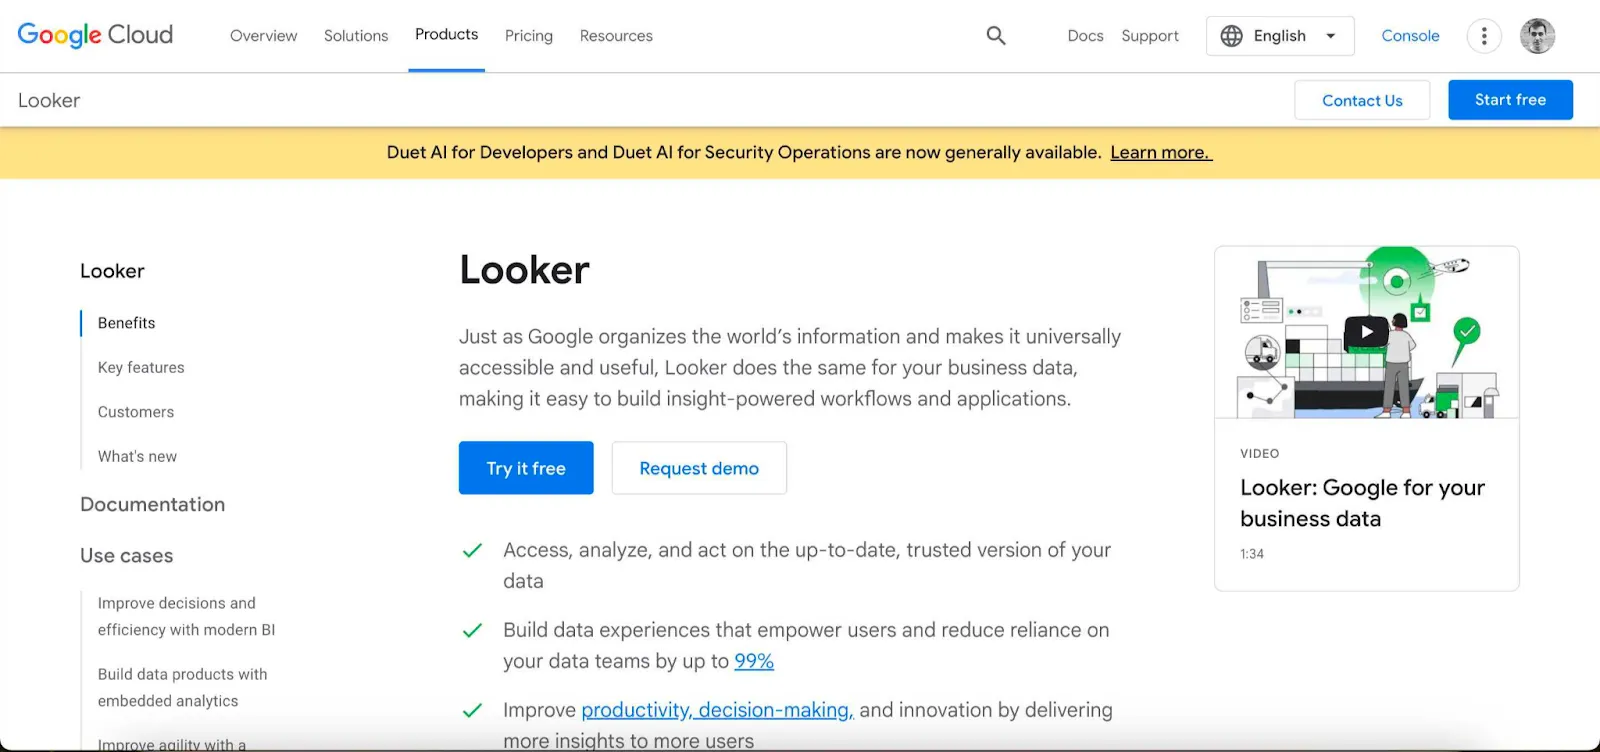
Best for: businesses that need data modelling + visualizations
Just like the rest of the Google products, Looker is an extremely capable tool whose output depends on the person behind the screen. If you have capable data analysts, you can display your business data through beautiful Looker dashboards.
There is a large choice of visualizations, such as graphs, charts, scatter plots and many others that help you go from raw data to actionable insights. But you’re going to need a good developer at hand.
First, because SQL is a must if you want to work in Looker. Second, Looker uses connectors as data sources and none of them connect directly to Looker. So, you have to look for third-party data warehouses and ETL tools to get everything set up and create a data analytics workflow.
The biggest problem with this business intelligence platform is the pricing — it’s sold through Google Cloud on a sales-led, annual-commitment basis and sits at the premium end (independent estimates run into five or six figures a year), and embedded gets pricier still because viewers are charged for. On the plus side, Looker has added Gemini-powered conversational analytics and an Embed SDK, so AI and embedding aren’t gaps.
Zoho Analytics
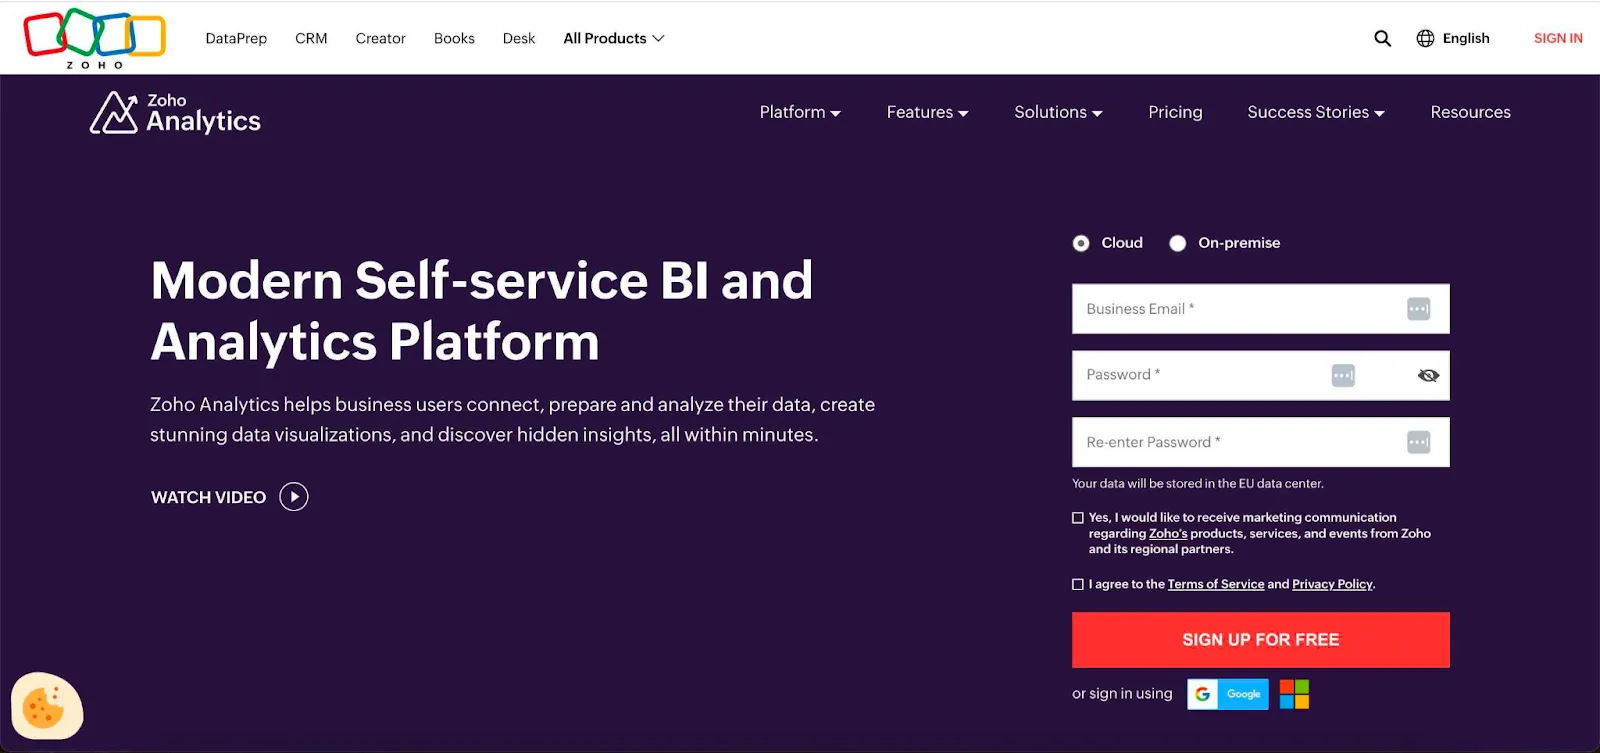
Best for: small businesses as it has a free version
You may already be using one of Zoho’s many apps, such as their small business CRM. When you need another app to make data-driven decisions, Zoho analytics is a logical choice. First, it’s easy to use and you don’t need a team of data scientists to get started. Second and perhaps even more important, there is a free plan, making it ideal for small businesses with a tight budget.
Zoho Analytics is the go-to choice for companies that want to harness the power of data management, data mining, data modeling and data science in general, without using dozens of different tools at once.
You don’t need a team of data analysts to do in-depth business intelligence operations. With Zoho, you can clean up and prepare simple datasets before sending it off to visualization within the tool. And like many competitors, Zoho has an AI module where you can ask the tool to give you insights from your data.
This makes it a versatile self-service BI app. It’s web-based and has decent visualization tools too. If you’re already in the Zoho ecosystem, it makes perfect sense to use Analytics too.
Qlik
Best for: experienced teams that want to tell stories with data
Spreadsheets belong in the 90s and thanks to tools such as Qlik Sense, anyone can get ad hoc, self-service data analytics. One of their most exciting features is something called Stories. As you collect data at different points in time, you take Snapshots of it.
You can then compile those Snapshots in one place and tell a story with data in Qlik. It’s a neat, drag-and-drop way to get a visualization dashboard and share it with relevant stakeholders without much sweat.
In theory, at least.
In practice, Qlik gets a lot of criticism because of how excruciatingly difficult it is to use. Even developers who work in Power BI (another tool notorious for its learning curve), state that Qlik is on another level. Doing something as basic as changing your dashboard can take hours.
If you have an experienced developer, Qlik is a good choice. It’s not Excel, but it’s not the most advanced thing in the BI world either.
Thoughtspot
Best for: people who are new to data analytics and want to use natural language to get to insights more quickly
Ever since ChatGPT launched, every business under the sun has added AI capabilities to their offer. The world of business intelligence is no different, with almost every analytics platform leveraging AI in some shape or form. However, there is one company betting big on AI - Thoughtspot. Today it markets an agentic analytics platform built on its Spotter agents and an MCP server, not just search.
The idea behind their tool is that data should be democratized and that you don’t need knowledge of SQL to be able to analyze, interpret and visualize data. Thanks to machine learning and AI, you can type out a command in English and get an answer to your question.
For example, you can ask something like “What is our top selling product in Q4 2025?” and Thoughtspot gives you the data and generates the visualization to support it.
While the ease of use for non-technical folk is great, there are some issues. As users report, Thoughtspot can get quite buggy and it does not cache results, unless you pay extra to get this feature. And pricey it is, especially when you consider the fact that the visualization options are very limited.
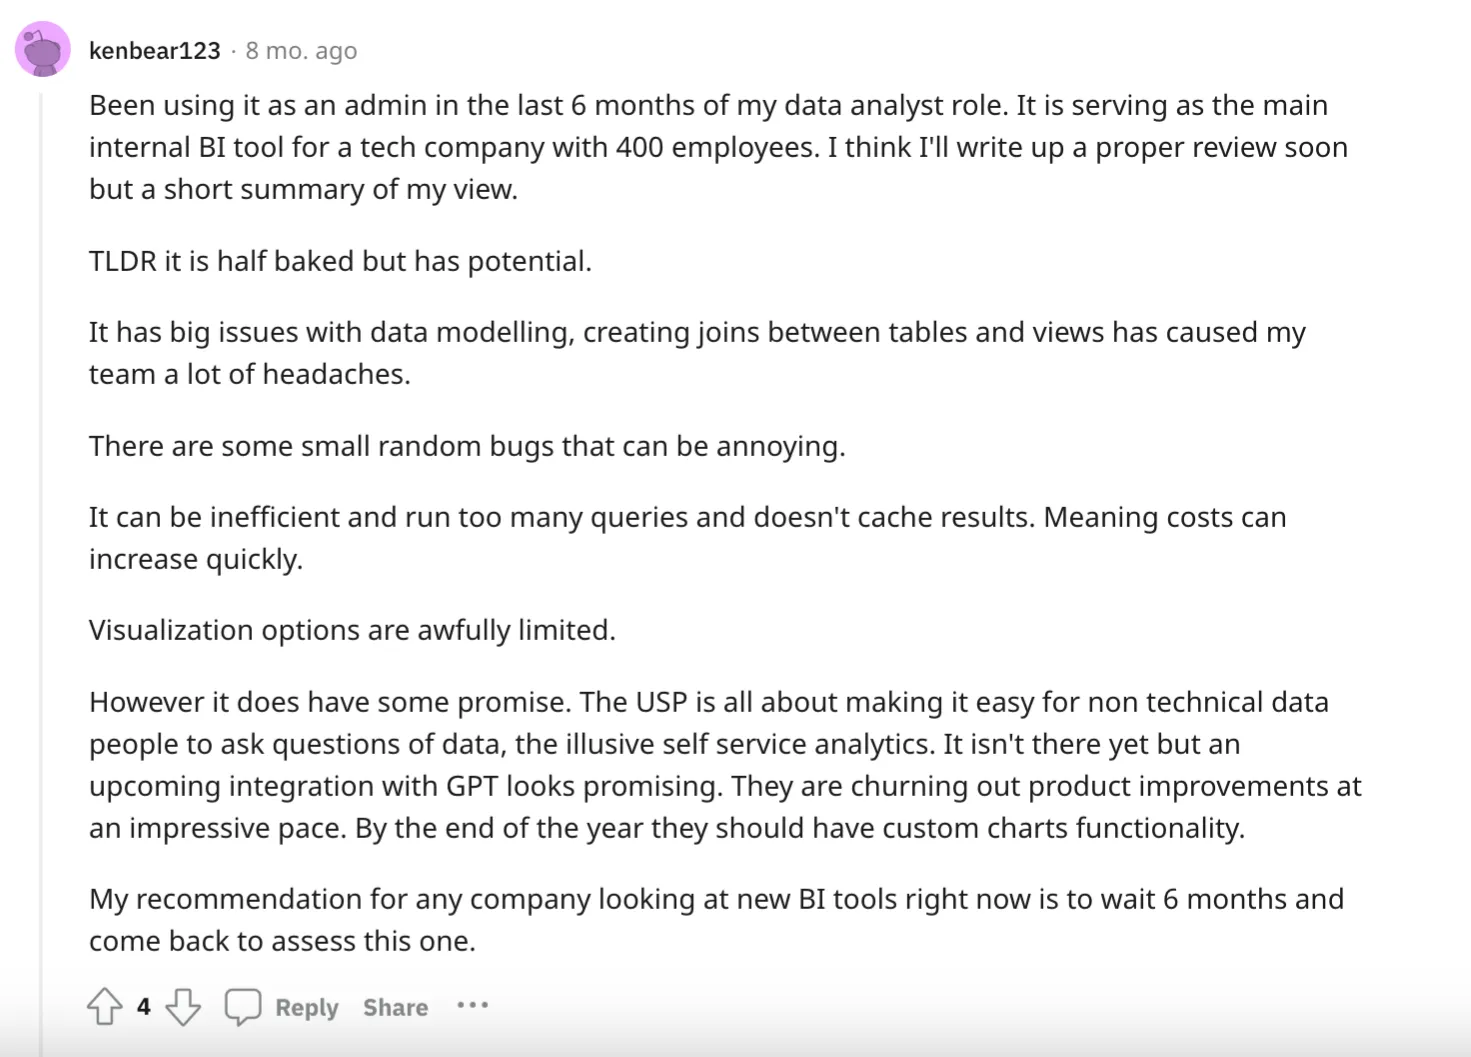
Overall, it looks like a promising tool but at this stage, it may not be robust enough for your more advanced BI use cases.
Wrapping up
Showing metrics and KPIs in real time with intuitive dashboards really is easier than ever before. Thanks to such a large choice of BI tools, there isn’t just one correct way to do business intelligence and data analytics anymore. Depending on your needs and budget, there is a BI platform out there that can help you win with data analytics.
At Luzmo, we can give you a great platform for embedding analytics capabilities in your SaaS tool.
Sign up for your free demo today and see how it works!
Written by

Ship the future of your data
Let us show you what Luzmo can do for your product.

Leave your e-mail and one of our analytics experts will reach out to you