Luzmo AI
Agentic AI, built into your product
Refine data, generate insights, and embed conversational analytics. All with one agentic suite.


Luzmo IQis easy to use and the results have been impressive. I'm genuinely excited about how it can transform decision-making for our customers.

Cedric Spaas
Product Expert Analytics, Selligent (Marigold)
Meet our intelligent agents
For product teams
Creator agents
Automate the behind-the-scenes analytics work, so you ship faster.

Visualization agent
Generate interactive charts directly from natural language.
Read more (opens in new tab)
Logic agent
Translate calculation descriptions into executable formulas.
Read more (opens in new tab)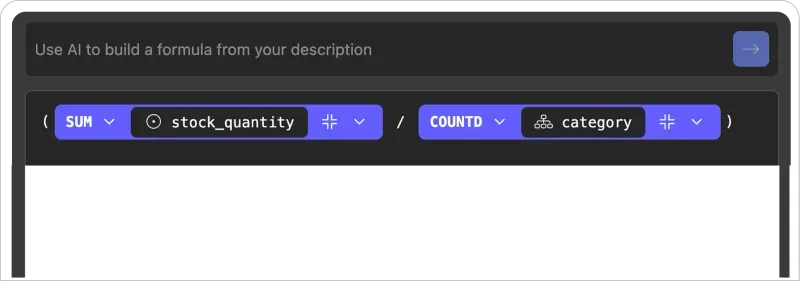
For developers
Agent APIs
Build and embed smarter analytics experiences with plug-and-play APIs.
Metadata agent API
When new datasets or columns appear, add descriptions automatically to keep your metadata up to date.
Discovery agent API
Quickly find the right dataset for downstream visualization and analytics workflows.
Visualization agent API
Give your product instant chart-building capability without writing visualization logic.
Formula agent API
Turn natural language into executable formulas for use in charts and workflows.
Read more (opens in new tab)Chat agent API
Build a chat assistant for your users to ask questions instead of analyzing dashboards.
Read more (opens in new tab)Chat history agent API
Let your users retrieve past conversations by keyword or time range.
Read more (opens in new tab)
For your users
Analyst agents
Give users instant answers and automated insights directly inside their analytics experience.
Conversation agent
Embed a data assistant that answers your users' questions in real time.
Read more
Summary agent
Add a narrative TL;DR to every dashboard so users instantly understand what matters.
Read more (opens in new tab)
Why build the infrastructure yourself?
Save months of custom development, and go live in weeks with Luzmo AI.
Feature
DIY
Luzmo AI
AI reliability
DIY
LLM hallucination risk
Luzmo AI
Accurate results (query engine calculations)
Performance
DIY
You optimize everything
Luzmo AI
Built-in data acceleration & query caching
Frontend & UI
DIY
Build from scratch
Luzmo AI
Ready-made components
Localization
DIY
Build it all yourself
Luzmo AI
By default (language, timezone, currency)
Security
DIY
Design and maintain permissions yourself
Luzmo AI
Secure by design (role-based access control)
Grounded intelligence. Strict governance.

Query engine-powered
No hallucinations. Every answer is grounded in your data.

API-first
Designed to fit your stack. Evolve AI strategy without changing your core product.

Security
Multi-tenant row-level security. No training on customer data.

Performance
Built-in data acceleration for fast, sub-second queries at scale.
Customers
What our customers say
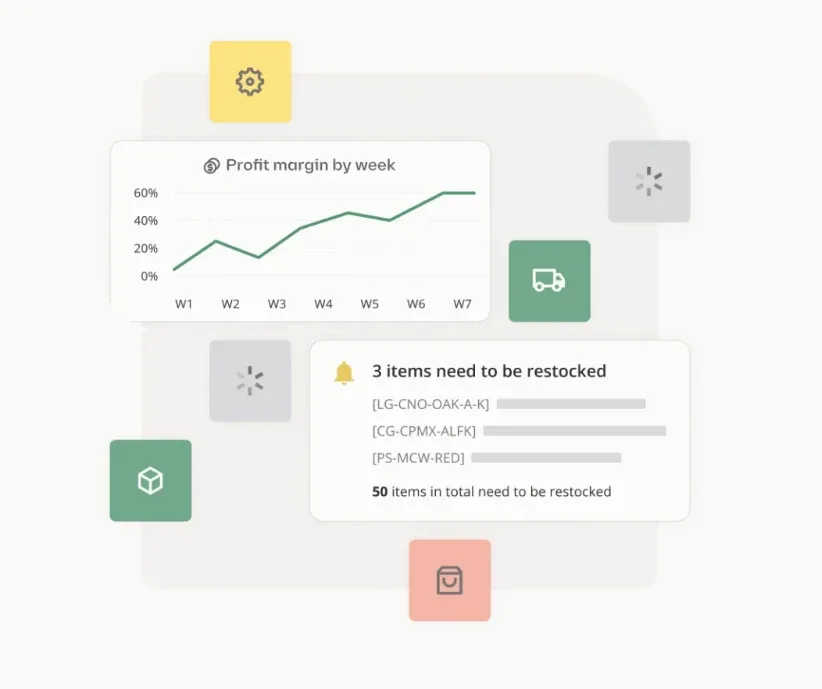
Luzmo IQ will help us to integrate an intuitive, AI-driven chat interface for our users to get actionable insights simply by asking questions. Instead of navigating dashboards and creating custom reports, they will get fast, visual responses to any data query. This will also help them to make informed business decisions and stay focused on optimizing their inventory.Read case study

Rainar Essenson
Senior Product Manager at Katana Cloud Inventory
Rainar Essenson
Senior Product Manager at Katana Cloud Inventory
Stop building the past. Ship the future of your data.
Your roadmap is too important to be stalled by legacy BI. Launch native, self-serve analytics this sprint.

Leave your e-mail and one of our analytics experts will reach out to you