Using AI for Data Analysis: The Ultimate Guide (2026)
It’s hard to scroll through your social media feeds without seeing a post about AI or ChatGPT. How to create sales email templates, blogposts, debug code,... The list of use cases for generative AI tools seems endless. McKinsey estimates that generative AI could add $2.6 trillion to $4.4 trillion to the global economy annually across 63 use cases.
How about using AI for data analysis?
In this article, we’ll explore why AI is great to speed up data analysis, how to automate data analysis each step of the way, and which tools to use. Let’s jump in.
What you’ll learn
- How AI transforms data analysis, from routine cleaning and reporting to real-time insights, predictive modeling and trend detection.
- The full analytics lifecycle explained: how raw data becomes reliable insight through collection, cleaning, analysis, visualization, and forecasting.
- Why AI-powered and embedded analytics matter today, and how they let even non-technical teams explore data, build dashboards, and act on results without heavy BI infrastructure.
- Concrete, real-world use cases, from inventory forecasting and sales planning to churn prediction, risk detection, and operational forecasting, showing how different data needs can benefit from AI analytics.
- How to embed analytics into your product or workflows: not just as internal reporting, but as a seamless, user-facing feature inside your app that adds value and drives engagement.
- What to watch out for, and how to stay safe: including data quality, privacy and compliance considerations when you use AI for analytics.
What is AI data analysis?
As data volumes grow, data exploration becomes harder, slower, and more dependent on specialist skills. AI data analysis refers not only to using artificial intelligence to process large datasets, but also to using AI to change how people interact with data and who can analyze it.
On the technical side, AI data analysis uses techniques such as:
- Machine learning algorithms → identify patterns, correlations, and make predictions across large datasets
- Deep learning → apply neural networks to complex problems like time-series analysis, forecasting, or image and signal data
- Natural language processing (NLP) → extract insights from unstructured text or allow users to query data in plain language
But AI data analysis goes further than modeling and prediction.
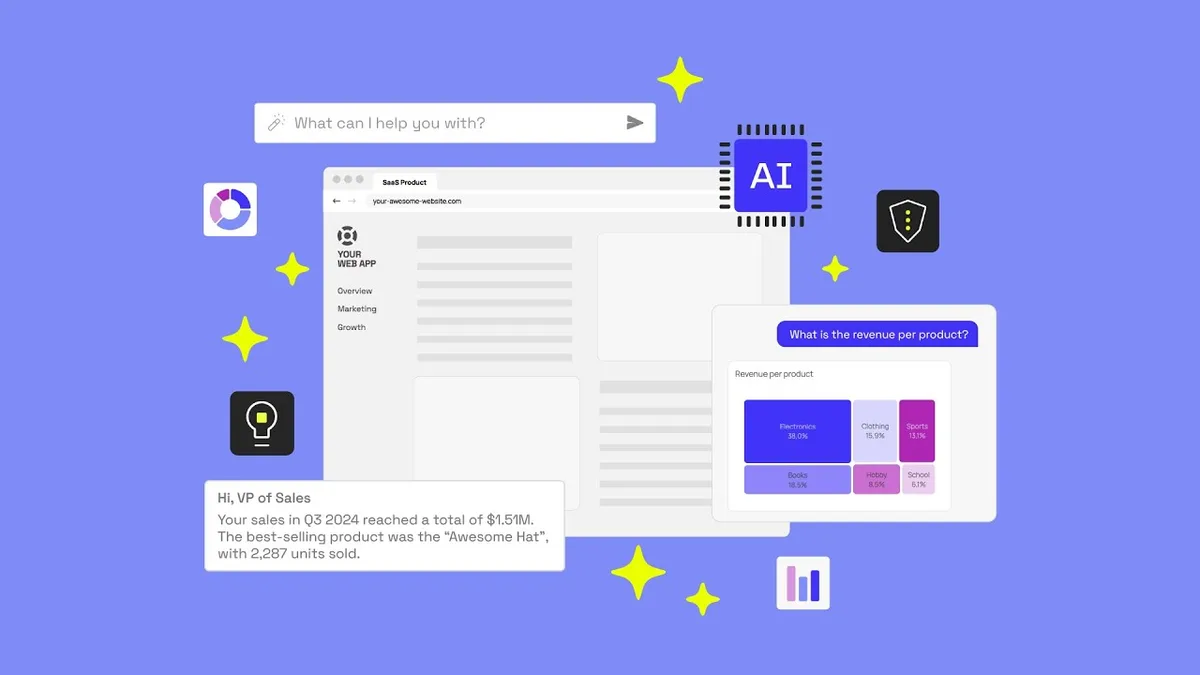
Modern AI-powered analytics also focus on unlocking data for a wider audience. Instead of changing the data itself, AI changes the experience of analysis. Intelligent agents can explore datasets, surface insights, suggest next questions, generate charts, and explain results automatically. Platforms like Luzmo IQ provide this kind of AI-powered exploration, while Luzmo Studio lets teams turn those insights into interactive dashboards embedded directly into their products. That means users no longer need to know SQL, BI tools, or data science workflows to get value from data.
In practice, AI data analysis combines:
- Automation of exploration and analysis work
- Natural, conversational interaction with data
- Guided insight discovery instead of manual dashboard building
The result is analytics that shift from a specialist task to a shared capability — faster, more accessible, and closer to everyday decision-making.
Imagine you work in a warehouse that stores and distributes thousands of packages daily. To run your warehouse procurement better, you want to understand things like:
- How long inventory stays in the warehouse on average
- How much warehouse space is occupied or unused over time
- Which items are low in stock and need replenishment
- The average time required to replenish stock per product type
- Which items have remained in the warehouse longer than a month, quarter, or year
Traditionally, answering these questions requires manual queries, dashboards, or analyst support. With AI-driven analytics, much of this exploration can happen automatically: patterns surface faster, anomalies get flagged early, and follow-up questions can be answered on demand.
So, the adoption of AI-driven insights is paving the way for the warehouse of the future, where operations are optimized through real-time data analysis and predictive analytics.
AI data analysis vs. traditional data analysis: what actually changes
Traditional data analysis is largely manual and sequential. A data analyst pulls a dataset, cleans it, runs queries or builds models, interprets the output, and writes up findings. The process is thorough, but it's slow — and it concentrates analytical capacity in a small number of specialized people.
AI changes three things about that process. First, it compresses the time between question and answer. A natural language query that would take an analyst hours to formulate and run can be answered in seconds when the data is connected to an AI layer. Second, it removes the SQL and scripting barrier. Non-technical users — product managers, account executives, operations leads — can interrogate data directly without writing a single line of code. Third, it shifts the analyst's role from doing the analysis to reviewing and interpreting it, which is where human judgment adds the most value. When those natural-language capabilities are packaged into a product, they often take the form of an AI analyst that users can ask directly.
What doesn't change is the importance of data quality. AI amplifies whatever is in the dataset. If the underlying data is incomplete, inconsistently formatted, or poorly joined, AI-generated analysis will reflect those problems — sometimes in ways that are harder to spot than a spreadsheet error.
The practical implication for software teams: AI for data analysis is most effective when it's embedded where decisions are made, not isolated in a separate BI tool. Luzmo AI integrates directly into your product so end users can ask questions about their own data in plain language, without routing every request through a data team.
Benefits of using AI for data analytics
AI often feels intimidating when paired with data analysis. Some teams see AI as “magic” that just works, while they experience data analysis itself as complex, slow, or hard to trust. In reality, both perceptions can reinforce each other in unhelpful ways.
When AI is treated as a black box, and data foundations remain unclear, results feel unpredictable. When data analysis feels inaccessible, AI outputs feel harder to validate. Understanding the benefits of AI-powered analytics helps cut through both issues — not by promising miracles, but by showing where automation, speed, and accessibility genuinely add value.
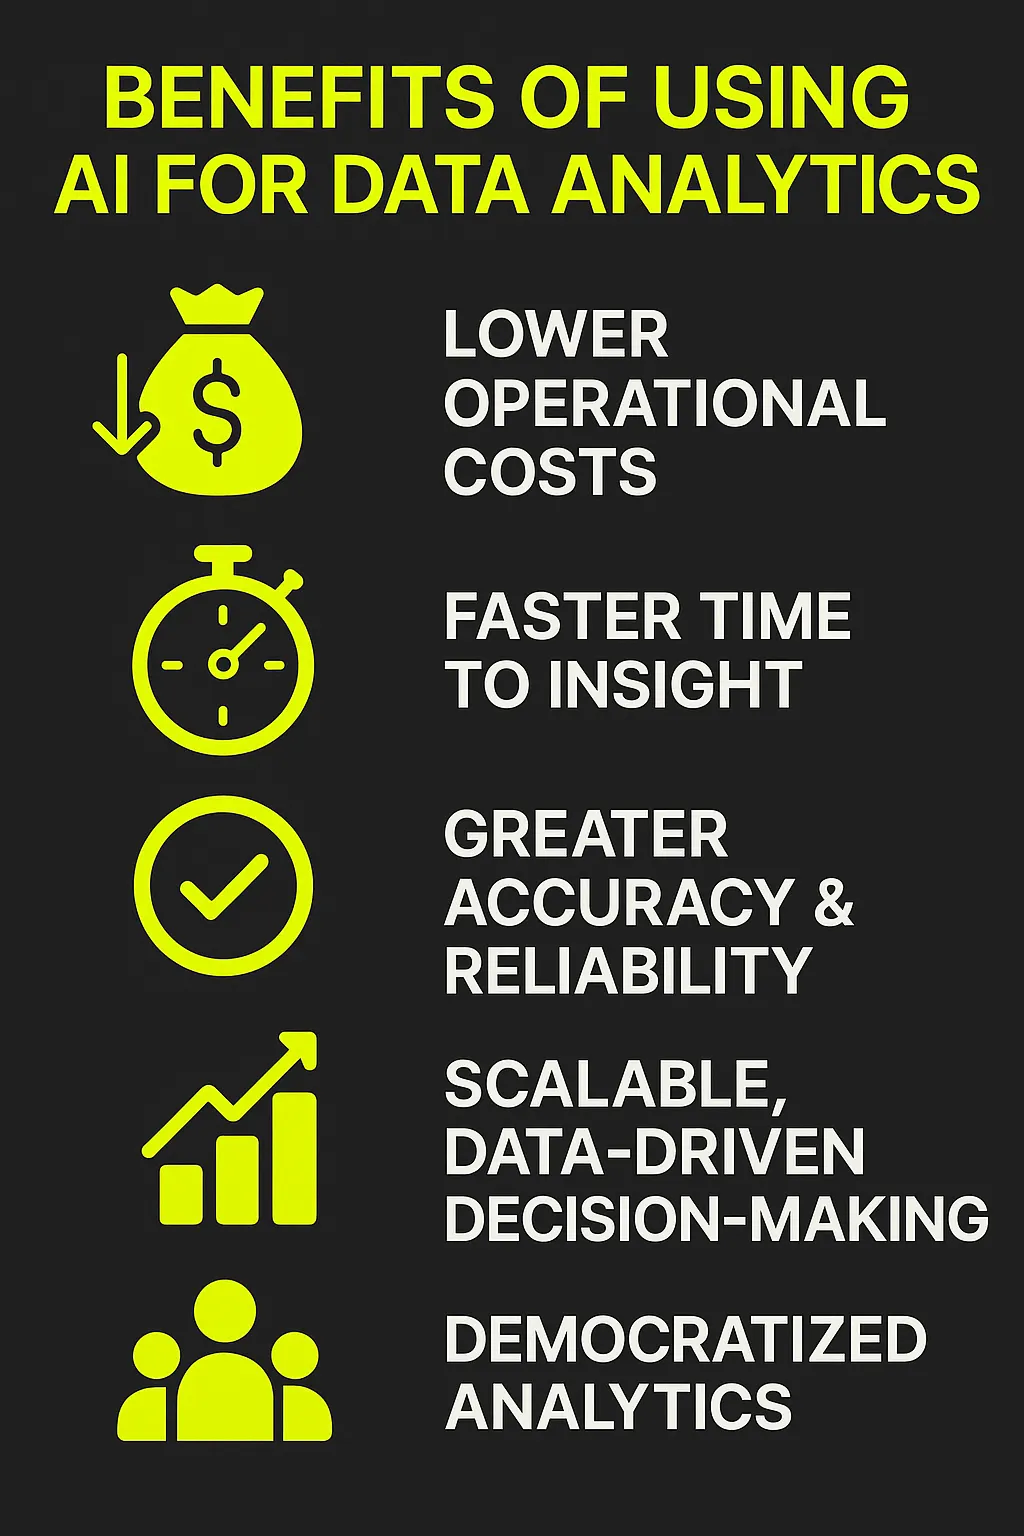
- Lower operational costs. AI reduces the manual workload needed for data cleaning, processing, and reporting, which cuts labour-intensive tasks and frees up resources for strategic work.
- Faster time to insight. What used to take hours or days (loading data, prepping it, generating reports) can now be completed in minutes or real time.
- Greater accuracy & reliability. AI helps catch errors, validate data, detect anomalies, and provide consistent quality; reducing the risk of bad data skewing decisions.
- Scalable, data-driven decision-making. AI handles large, diverse, even unstructured datasets! You can surface patterns, forecast trends, and make decisions based on comprehensive data rather than small samples.
- Democratized analytics. AI-powered analytics benefit both internal teams and external end users. By automating heavy lifting and making analysis more accessible, AI enables people across the organization – and inside customer-facing products – to explore, edit, and act on data without deep data science skills.
Many teams already feel blocked by their current analytics setup. According to our research, 51% of users say their biggest frustration is that dashboards don’t let them interact meaningfully with data. Another 37% say insights aren’t actionable, while 36% complain dashboards are simply too slow.

It’s a clear signal: people want analytics that go beyond static charts, and AI, when used right, can unlock faster speed to insight.
How non-technical teams can use AI for data analysis without SQL
One of the more significant shifts AI brings to data analysis is the removal of the technical access barrier. For most of the history of business intelligence, the ability to get a specific answer from a dataset required either writing SQL, building a report in a BI tool, or waiting for someone else to do it for you.
Natural language querying changes that. Instead of building a query, a user types a question — "Which accounts had the highest churn risk last quarter?" or "How did our feature adoption change after the June release?" — and the AI interprets it, retrieves the relevant data, and returns an answer in a readable format.
For this to work reliably, the AI needs to understand the data model behind the question. Generic AI tools struggle here because they don't have context about what your tables mean or how your metrics are defined. Embedded AI tools that are connected to your specific dataset and schema handle this significantly better.
The practical benefit for non-technical teams is time. Account managers can check customer health data before a call. Product managers can validate a hypothesis before writing a spec. Marketing teams can measure campaign impact without waiting for a weekly report. The analysis doesn't get deeper, but it gets faster and more accessible — which means more people actually use it.
Tools like Luzmo AI are built specifically for this use case: AI querying embedded inside the product your users already work in, connected to your data, returning answers in the context that makes them actionable.
How to use AI for data analysis?
AI-powered analytics relies on well-collected and well-prepared data. At the same time, its impact is felt where insights are generated and decisions are informed.
For that reason, we begin with analysis and insight, and then move to the underlying data processes that enable them.
1. Data analysis: extracting insight and meaning from prepared data
In practice, this is where most teams start. They review existing insights, usage analytics, or AI-generated answers to understand what’s happening and where questions remain. AI-powered data analysis turns this audit step into something fast, interactive, and accessible.
When data is clean, organized, and flowing through a reliable pipeline, AI can help transform raw numbers into actionable insight. Modern analytics — especially when augmented with AI — makes it possible to analyze large and complex datasets to identify patterns, correlations, anomalies, and trends that would be difficult or time-consuming to detect manually.
This can include:
- uncovering early warning signals, such as churn risk or unusual behavior
- spotting operational inefficiencies
- detecting emerging user segments
- highlighting outlier events
AI dramatically reduces the time between “data collected” and “insight delivered.” What traditionally required hours or days of analyst work — writing SQL queries, aggregating data, slicing dashboards — can now happen in seconds.
Just as importantly, AI brings accessibility. With natural-language querying and intelligent decision logic, non-technical users such as product managers, sales, operations, or marketing teams can explore data on their own. Analytics is no longer limited to specialists; it becomes usable across the organization (and even inside customer-facing products) without requiring deep data expertise.
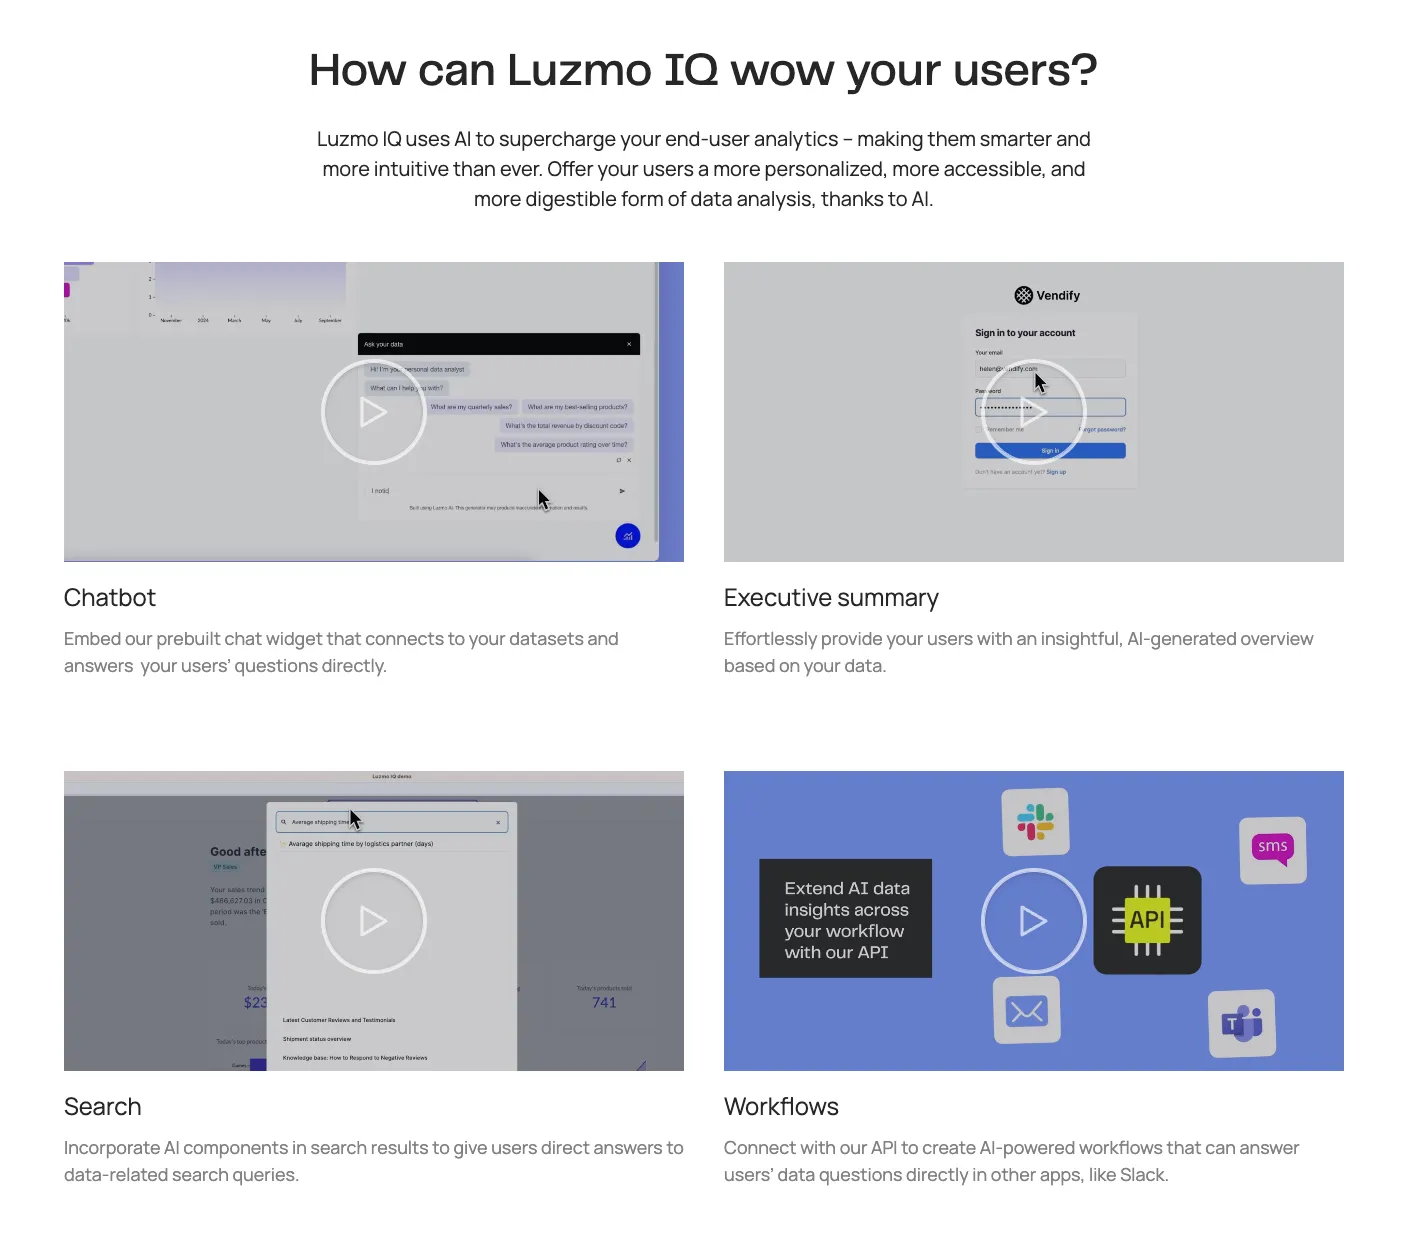
How Luzmo IQ elevates this process
Luzmo IQ is built to transform this analysis phase — from data to insight — in an accessible, user-friendly way:
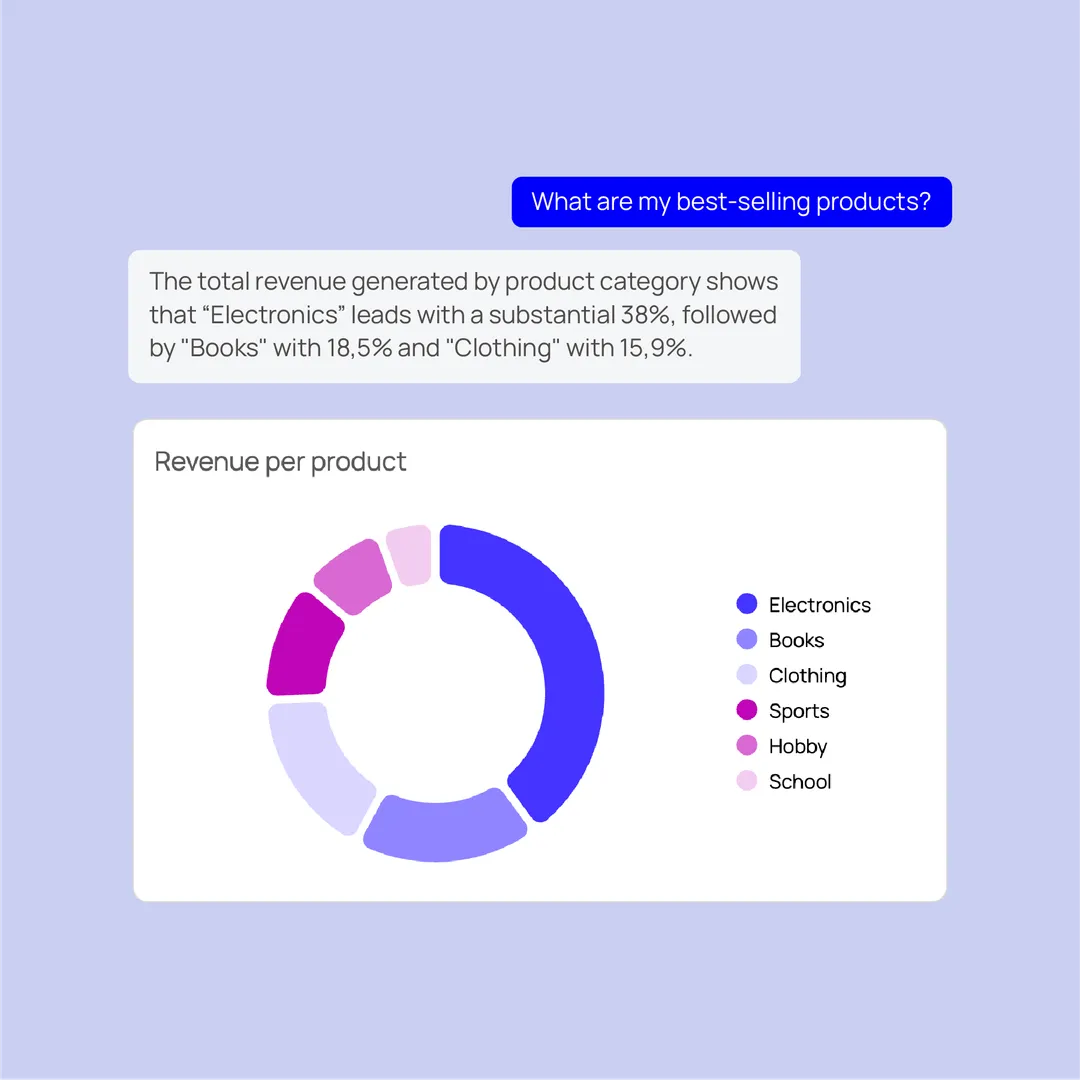
- Natural-language data queries. Rather than writing SQL or building complex queries, users can ask questions in plain English (for example, “What was revenue last quarter?”). Luzmo IQ identifies the relevant datasets, fields, and metrics, applies the right indexing and context, and returns instant answers — both in text and chart form.
- Context enrichment and semantic understanding. Luzmo IQ can augment your data with real-world context when needed. If a dataset contains country names but no regional classification, the AI can infer concepts like “European countries” so users can analyze and segment data without restructuring their data model.
- Instant chart generation and visualization. Charts and visuals are generated automatically from query results, without manual dashboard setup. This accelerates insight delivery and removes friction for non-technical users.
- Accessible insights for any user. The AI-driven interface lowers the barrier to entry, supporting a data-driven culture across roles — not just within data teams.
- Faster decision cycles and scalable insights. As data volumes grow or new datasets are added, Luzmo IQ handles the complexity, delivering scalable and performant analytics without manual overhead.
Combined with AI-augmented analysis, tools like Luzmo IQ turn analytics from a specialist task into a core part of how decisions are made: fast, democratic, and scalable.
Go even further with AI-powered embedded analytics: Meet Luzmo’s Agent APIs
If dashboards are the “view to your data,” Luzmo’s Agent APIs give you the building blocks to design how intelligence works inside your product. They aren’t an alternative interface to Luzmo IQ — they let you move beyond any predefined analyst experience and build your own analytics workflows, UX, and interactions.
Instead of being constrained to static charts or fixed query flows, the Agent APIs expose modular AI capabilities that you can combine however your product needs. You decide when AI steps in, what it does, and how results appear in your UI.
With the Agent APIs, you can build workflows such as:
- generating charts or dashboards programmatically based on user actions or product logic
- letting a natural-language question lead to structured insights, visualizations, or explanations without exposing a generic analytics UI
- translating questions into queries and formulas behind the scenes
- improving dataset and column metadata automatically as data evolves
- enriching, translating, or contextualizing data to match user language, region, or domain
For SaaS product teams, this means analytics becomes a native product capability rather than an embedded tool. Intelligence can live directly inside existing screens, flows, and decisions — whether that’s a reporting view, an operational workflow, or a guided assistant.
This “agentic analytics” approach shifts analytics from something users visit to something that works alongside them. Teams can start small, then scale toward fully custom, AI-powered analytics experiences over time. Because the APIs are modular and API-first, you retain full control over UX, security, permissions, and integration, while giving users flexible ways to explore and act on their data.
2. Data visualization: turning insight into clarity
Once analysis surfaces patterns, trends, or anomalies, visualization is what turns those findings into insight people can actually understand and act on. Raw tables or spreadsheets rarely communicate meaning on their own. Visual representations help translate complex data into something that’s easier to interpret, discuss, and use in decision-making.
Effective visualization matters because it:
- Simplifies complexity. Large, multidimensional datasets become easier to grasp when presented as charts, time-series graphs, heatmaps, or other visual formats.
- Reveals patterns and relationships. Visuals make correlations, trends over time, clusters, and outliers visible — signals that often stay hidden in raw data.
- Speeds up decision-making. When insights are visual, stakeholders don’t need deep data expertise to understand what’s happening. This shortens the path from insight to action and reduces reliance on gut feeling.
- Democratizes data access. Visualization lowers the barrier to data literacy across teams such as marketing, sales, operations, and leadership.
- Supports collaboration and monitoring. Shared visuals help teams align around the same metrics, track performance over time, and coordinate actions more effectively.
What good analytics experiences should offer
A clear overview of what matters. Whether insights appear in a dashboard, a report, or directly inside a workflow, users need an immediate sense of what’s happening. Key metrics, trends, or signals should summarize business or operational health without requiring extra interpretation.
Ability to explore and follow questions. Good analytics supports curiosity. Users should be able to drill down, filter, compare, and ask follow-up questions wherever insights appear — without switching tools, exporting data, or opening a separate BI interface.
Flexibility across workflows and users. Analytics should adapt to how people work. Sometimes that means dashboards, but it can just as well mean a chart embedded in a product screen, a contextual insight inside an operational flow, or an explanation triggered by a question. The experience should remain intuitive and accessible, even for non-technical users such as managers, operators, or clients.
Speed and clarity at the moment of action. Analytics delivers the most value when it fits naturally into fast-moving workflows. Lightweight charts, visual summaries, or concise explanations help users understand what’s happening and decide what to do next — without slowing them down.
With Luzmo, analytics isn’t limited to standalone dashboards.
Our embedded analytics platform lets you surface charts, KPIs, and AI-driven insights directly inside your application — wherever users already work. That can be a dashboard, but it can also be a product screen, a workflow step, or a guided experience tied to a specific action.
Non-technical users can still build or customize visualizations when dashboards make sense, while product teams retain full control over where and how analytics appears. As data volume, use cases, or user needs grow, the analytics experience scales without heavy engineering overhead.
3. Predictive analytics: moving from insight to foresight
While descriptive analytics explains what’s happening now, predictive analytics focuses on what’s likely to happen next. This is where artificial intelligence adds a clear advantage over traditional reporting. By learning from historical patterns, AI can forecast future outcomes and surface risks or opportunities before they fully materialize.
Predictive analytics uses models trained on past behavior, trends, and contextual signals to anticipate future states. Instead of reacting to changes after they occur, teams can plan ahead and act earlier.
Common use cases include:
- Forecasting inventory and demand. By analyzing historical sales, inventory turnover, seasonality, and supply-chain signals, AI-driven demand forecasting helps estimate how much stock will be needed in upcoming weeks or months. This reduces overstock, which ties up capital, and minimizes stockouts, which impact revenue and customer satisfaction.
- Setting realistic sales targets. Past performance, seasonal trends, customer behavior, and market conditions can inform predictive models that suggest achievable, data-backed sales goals rather than relying on guesswork.
- Predicting customer churn. AI can identify early warning signals that indicate customers may disengage or leave, based on usage patterns, engagement history, or purchasing behavior. This allows teams to intervene proactively.
- Detecting fraud or operational risk. Unusual patterns in transactions or behavior can be flagged early, helping teams investigate potential fraud or mitigate risk before it escalates.
- Anticipating maintenance or system failures. In manufacturing or logistics environments, predictive analytics can analyze historical usage or sensor data to forecast when equipment is likely to require maintenance or fail.
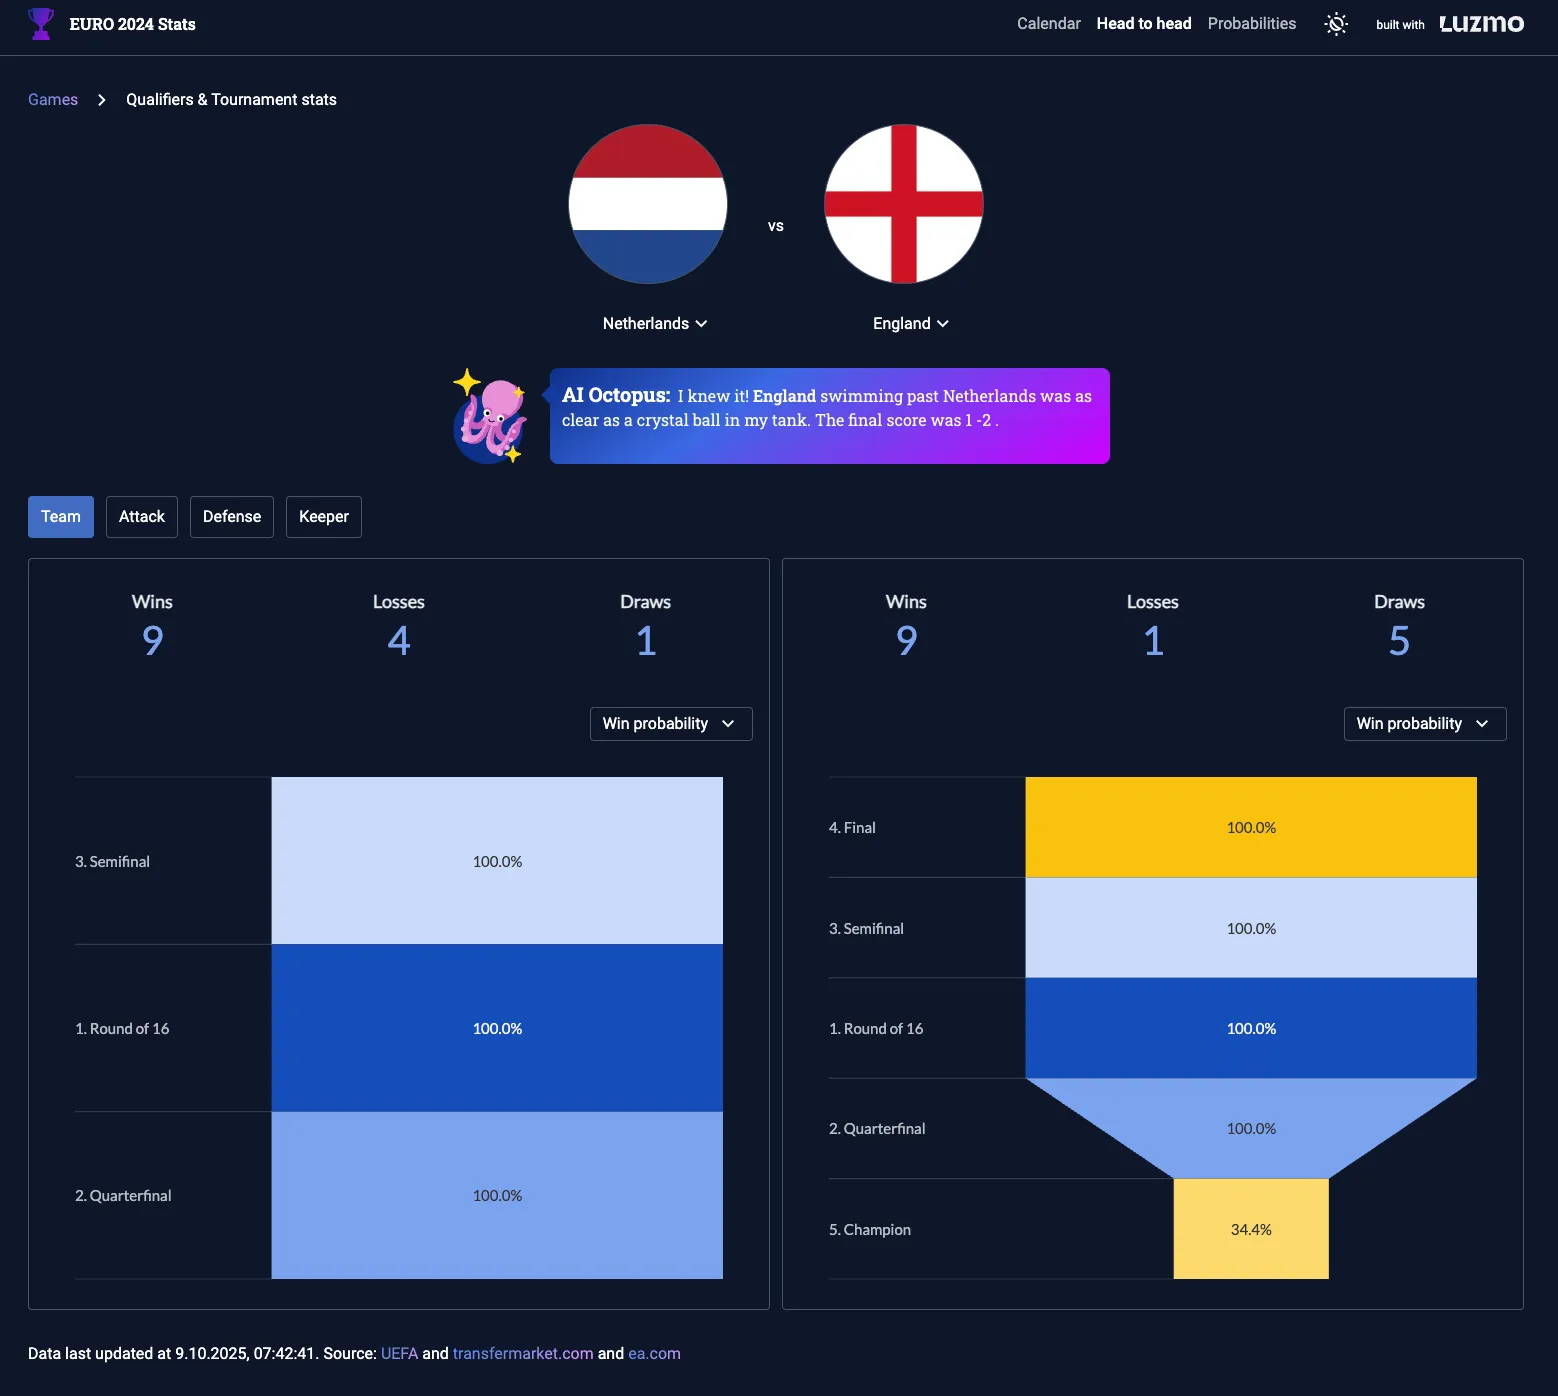
A good example of predictive analytics in action is this soccer app that forecasted match outcomes during EURO 2024. An LLM summarized predictions in natural language, while interactive visualizations allowed users to compare team metrics side by side — combining forecasting with explanation and exploration in one experience.
Predictive analytics works best when it’s tightly connected to visualization and decision-making. Forecasts need to be understandable, explorable, and grounded in real data so teams can trust the results and act on them with confidence.
4. Data collection: gathering the raw material for analytics
As insights deepen and predictions become more ambitious, teams often discover what’s missing. Forecasts may lack confidence, segments may feel incomplete, or follow-up questions may remain unanswered. That’s typically the signal to revisit data collection.
Data collection is the foundation of any analytics or AI-driven workflow. Without the right data, meaningful insight simply isn’t possible. The goal is to capture inputs that accurately reflect the reality you want to understand or predict — whether that’s user behavior logs, transaction records, outreach metrics, analytics events, or external data sources.
Effective data collection requires intention. Data should be gathered consistently, labeled or tagged where needed, and stored in formats that remain easy to retrieve and analyze later. When data originates from multiple sources — such as internal databases, external APIs, logs, or third-party services — it’s important to plan how those sources will be integrated and unified.
Poorly aligned schemas, missing identifiers, or inconsistent formats can break analysis downstream and limit what AI can do. By designing collection pipelines with integration in mind, teams avoid unnecessary friction later in the analytics process.
Strong data collection practices make everything that follows easier. A solid pipeline reduces manual work, minimizes integration issues, and supports scalable, repeatable analytics — allowing insights, visualizations, and predictions to improve over time rather than degrade as complexity grows.
5. Data cleaning: from noisy data to analysis-ready datasets
Collecting data is only the first step. Before analytics or AI models can be trusted, that data needs to be cleaned and validated. Raw datasets often contain duplicates, missing values, inconsistent formats, typos, or corrupted records. Without cleaning, any analysis — and especially predictive modeling — rests on shaky ground.
Data cleaning focuses on turning raw inputs into reliable, analysis-ready datasets. This typically involves:
- removing or correcting invalid or duplicate records
- standardizing formats such as dates, numeric fields, and categorical values
- handling missing or null values in a consistent way
- validating data against business rules and expected ranges
- ensuring consistency across datasets that come from different sources
Clearing this “noise” improves the accuracy and reliability of insights. When data is clean, patterns are easier to detect, forecasts become more trustworthy, and decisions are less likely to be skewed by errors or inconsistencies.
It’s also worth noting that data preparation (including cleaning) often represents the largest share of analytics work. Many data projects spend more time preparing data than building models or visualizations. While AI can automate parts of this process, clean inputs remain essential: AI amplifies the quality of your data, both good and bad.
Well-maintained, clean datasets close the loop between collection and analysis. They make it easier to iterate, scale analytics efforts, and support more advanced use cases such as AI-driven forecasting and embedded analytics.
6. Data-driven decision-making: turning insight into action
Insights only create value when they influence decisions. Data-driven decision-making means using analytics not just to understand what’s happening, but to guide what to do next — with clarity, confidence, and accountability.
When teams rely on real data instead of assumptions or gut feeling, decisions become easier to justify and easier to evaluate. A complete analytics stack — solid data collection, clean inputs, thoughtful analysis, clear visualization, and reliable forecasting — makes it possible to react faster and allocate resources more effectively.
Data-driven decision-making helps organizations:
- prioritize initiatives based on evidence rather than intuition
- reduce waste and inefficiencies
- align teams around shared metrics and goals
- respond earlier to risks and opportunities
To make sure analytics truly informs decisions, it helps to follow a simple checklist:
- Define clear business questions. Be explicit about what decision needs to be made (for example, “Which product lines should we invest in next?” or “Should inventory increase by X% next quarter?”). Clear questions keep analysis focused and relevant.
- Rely on up-to-date, trustworthy data. Decision quality depends directly on data quality. Outdated or inaccurate inputs lead to misleading conclusions, no matter how advanced the analytics.
- Combine descriptive and predictive insights. Understanding current performance matters, but anticipating what’s likely to happen next provides a stronger foundation for action.
- Translate insights into concrete actions or hypotheses. Dashboards and charts are only useful if they lead to decisions, experiments, or changes in behavior. Insight without action stays theoretical.
- Monitor outcomes and learn. Treat decisions as experiments. Compare results against expectations, learn from what worked or didn’t, and feed those learnings back into the next analytics cycle.
When analytics is embedded directly into workflows and products, this loop becomes faster and more natural. Insights appear where decisions are made, follow-up questions are easy to ask, and teams can continuously refine both their data and their actions.
That’s where AI-powered analytics delivers its real impact: not as a reporting layer, but as an everyday decision support system that evolves alongside the business.
⚠️ Data security & privacy: treat AI analytics with caution
AI-powered analytics can unlock tremendous value… but they also introduce real risks for data security and privacy. The more data your system ingests, the greater the responsibility to protect it.
- In 2023, employees of a major corporation mistakenly uploaded internal source code to a public AI chatbot. That leak triggered a company-wide ban on public generative-AI tools.
- AI systems often process large, sensitive datasets such as personal records, financial information, internal business data. If the tool or its usage is not properly managed, this data can be exposed accidentally or intentionally.
- Using external or third-party AI tools can create legal and compliance risks: data may be subject to data-protection regulations (like GDPR), and improper handling can lead to fines, loss of trust, or reputational damage.
What to watch out for when using AI analytics
- Don’t feed sensitive or proprietary data to public AI tools. Avoid inputting trade secrets, private customer info, or internal code into AI chatbots or generative-AI systems without strong safeguards.
- Ensure proper data governance and access control. Restrict who can upload or query sensitive datasets, and monitor data flows carefully.
- Encrypt data and control data handling when possible, both in storage and during processing/inference, especially if sensitive or regulated data is involved.
- Check compliance with data-protection laws and regulations; especially if you operate in jurisdictions with strict privacy laws.
- Treat AI-driven analyses like any business data workflow. Apply same diligence: validate outputs, guard against leaks, and follow data-handling best practices.
With Luzmo IQ, you retain control over who sees what. Their platform includes an “access-control layer” that ensures only authorized datasets are queried, and that sensitive data is never exposed broadly.
Every IQ Agent request is routed through our ACL, offering strong user row-level filtering, and our Query Engine, for trusted aggregation & formula's.
In other words: the LLM cannot be compelled to release data it doesn't have access to, and is not relied upon for data accuracy. ~ Haroen
If you feed clean, compliant data into Luzmo and use its built-in security features (access control, aggregated query results), you can make the most of the power of AI-driven analytics while keeping privacy and data protection intact.
The best AI data analysis tools in 2026: an embedded analytics perspective
The AI data analysis tool landscape has expanded quickly, and the right choice depends heavily on your use case. The distinction that matters most for product teams is whether you need an internal analytics tool for your own team, or an embedded analytics layer for your end users. These are different problems and they have different solutions.
For internal analytics teams
Databricks, Google BigQuery ML, and Amazon SageMaker are built for teams running large-scale data processing and machine learning pipelines. They're powerful but require significant engineering resources to set up and maintain. Tools like Thoughtspot and ThoughtSpot Sage bring natural language querying to internal BI use cases, with strong semantic layer support.
For embedding AI analytics in a product
This is where the category is smaller and more specialized. Luzmo AI is built for software teams that need to put AI-powered data analysis directly in front of their end users — not as a separate BI tool, but as a native feature inside the product. It supports natural language querying, automatic chart generation, and proactive insights, with a developer SDK for custom implementations.
Power BI Embedded and Tableau Embedded are enterprise options that offer AI features, but both carry significant implementation overhead and licensing costs that make them difficult to justify for early or growth-stage software products.
What to look for
When evaluating any AI data analysis tool for an embedded use case, the questions that matter most are: Can it connect to your existing data source without a complete ETL overhaul? Can your end users interact with it without training? And can it be styled and controlled to feel like a native part of your product rather than an iframe bolted onto the side?
Getting started with AI-powered analytics
If you're building a software product, there’s no better time to bring embedded analytics into the mix. With Luzmo, you can quickly integrate interactive dashboards, real-time reports, and AI-driven insights directly inside your app, with no heavy BI infrastructure required.
Start giving your users instant access to data-driven insight, and make analytics a seamless part of their workflow.
Sign up for a free trial or book a demo to see Luzmo in action.
FAQ
All your questions answered.
What exactly is AI data analysis, and how does it differ from traditional methods?
AI data analysis uses machine learning and intelligent algorithms to sift through large volumes of data to detect patterns, trends, and insights that would take humans far longer to find manually. Traditional data analysis relies on human analysts applying statistical methods and visual inspection. In contrast, AI automates many steps, such as cleaning data, detecting anomalies, classifying information, and even suggesting hypotheses. This speeds up the analytics lifecycle and reduces manual effort.
Can results from AI data analysis be trusted? How do you validate them?
AI systems are only as accurate as the data and training they receive. To validate AI analysis: Use holdout or validation datasets that the model has never seen during training, similar to practices in machine learning validation. Compare AI outputs to known benchmarks or expert analysis to see if results align. Continuously monitor performance since data patterns can shift over time. By applying techniques like cross-validation and tracking performance on unseen data, you ensure that AI isn’t just “remembering” patterns but genuinely learning meaningful relationships.
What business problems does AI data analysis solve best?
AI excels in areas where data volume and complexity overwhelm manual analysis. Common use cases include: Predictive forecasting (e.g., sales or churn prediction). Anomaly detection for fraud or operational issues. Real-time trend identification across massive data streams. Automated reporting and pattern summarization that would be time-consuming manually. These capabilities allow organizations to make faster, data-driven decisions with less human overhead.
Do businesses need a data science team to use AI analysis?
Not necessarily. Many modern platforms embed AI capabilities directly into analytics interfaces, letting non-technical users ask natural-language questions and get insights without coding. That said, having analytics expertise helps with data governance, model interpretation, and making sure that AI outputs are applied responsibly, especially in regulated environments.
Written by

Ship the future of your data
Let us show you what Luzmo can do for your product.

Leave your e-mail and one of our analytics experts will reach out to you