A(P)I-first: Accelerating Analytics with an AI-Powered Chart Generator

Today, Luzmo introduces the next step in customer-facing analytics: the AI-powered chart generator, available right within the Luzmo dashboard editor… or fully customizable within your own workflow via our API.
This advanced tool empowers users to generate insightful charts from simple text prompts, simplifying and accelerating chart generation. When used via API, this feature helps to create a cohesive AI UI/UX in your platform to avoid “AI sprawl”. It can also enhance decision-making by hyper-personalizing the insights you bring to your customers.
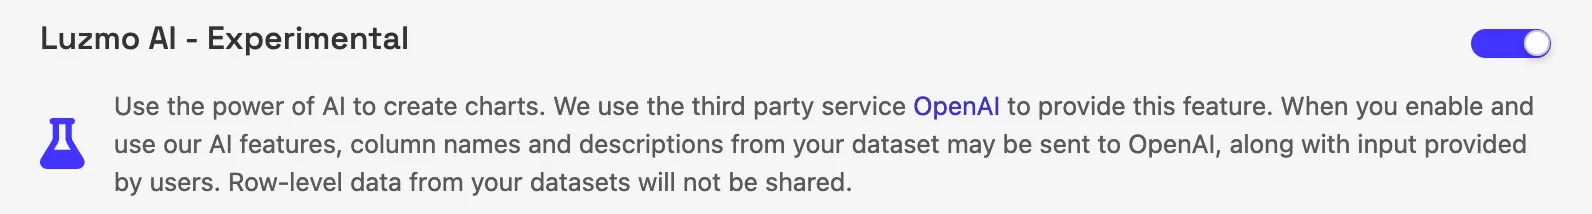
(to start using Luzmo AI, an organization owner must enable the associated experimental setting in the Organization profile. Note that only metadata like column names and descriptions are shared with our vendor OpenAI — row-level data itself is never shared)
Add charts in the dashboard editor
In the revamped chart catalog, you’ll find two new tabs.
Suggestions
A drawer of automatically generated charts based on the current dashboard and its datasets. Click a suggestion to add it to the current dashboard or drag it into position.
This is a good way to quickly explore your sets and the analytical possibilities they offer. Suggestions can also inspire you with visualization types you might not have considered yet, like bubble charts, circle pack diagrams or tree maps.
Click “Regenerate” to generate a new set of suggestions or choose a different dataset from the dropdown.
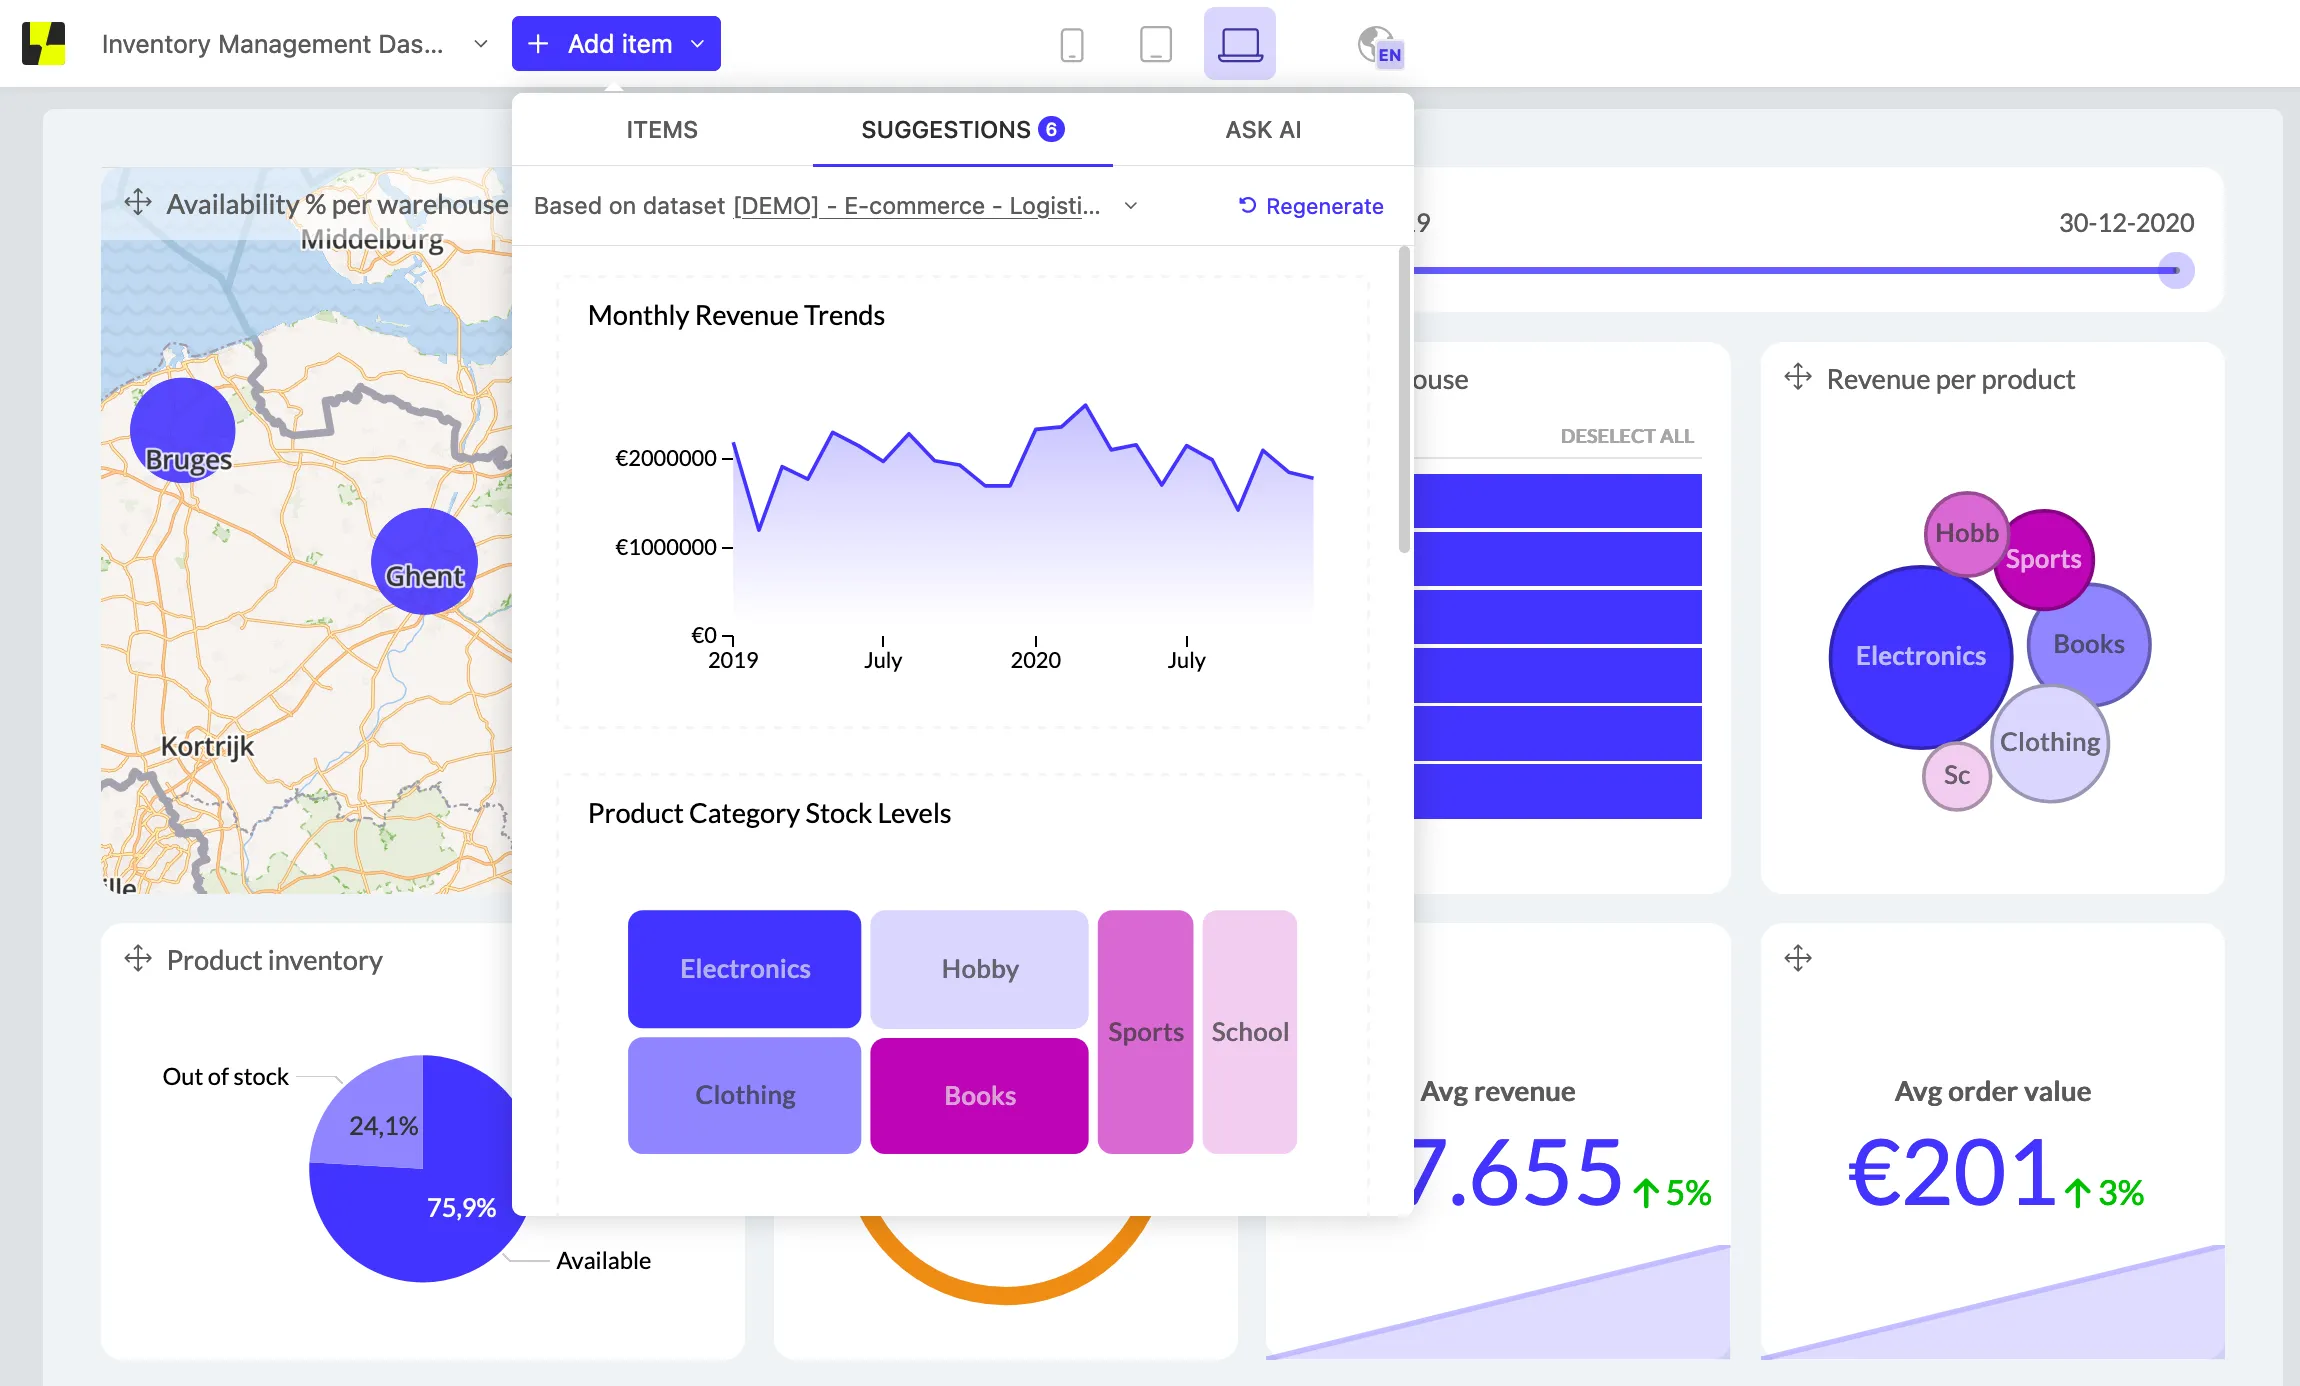
Luzmo AI suggestions: click to add charts to your dashboard
Ask AI
Construct a new chart “made-to-order” by asking a question. Either provide very specific instructions (”show revenue per month, on a line chart, with legend on the bottom”) or broad analysis questions and leave it up to Luzmo AI to choose the best dimensions & metrics and chart type to relay you the information (”which products are most popular?”).
If the result is not entirely fitting yet, continue the conversation to finetune the chart further.
“Ask AI” can adapt chart options like stacking mode, and even create filter widgets like date filters or slicers.
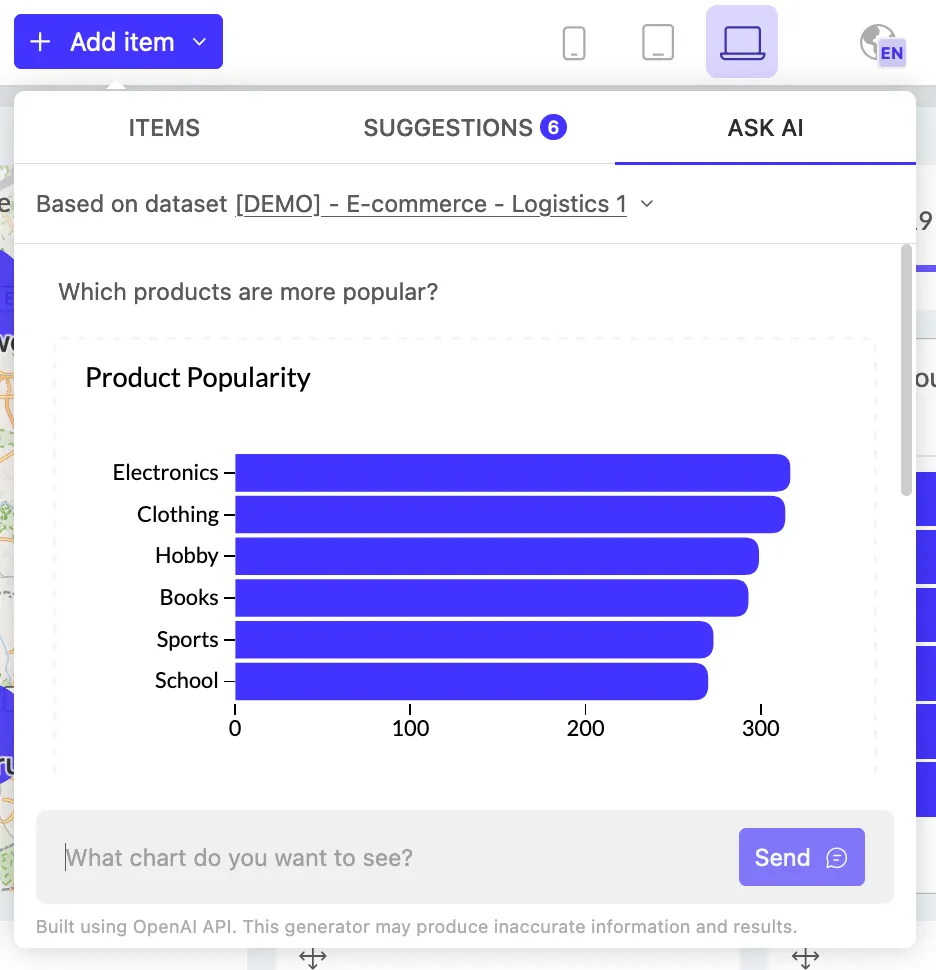
Luzmo AI “Ask AI”: ask for specific charts or more general analyses
A(P)I-first
Luzmo is the API-first analytics platform. Our entire platform is built on top of an open and powerful API, enabling you to automate any task to fit seamlessly in your application’s workflows and use cases. Our AI features are no different. Let’s explore some possibilities:
Platform-wide AI prompt
To offer a cohesive UI/UX to your end-users, “AI sprawl” — every integration on your platform rolling their own AI features & prompt inputs, which all behave slightly differently — is the enemy.
With our A(P)I-first approach, take back AI features into your own hands. For example, add an application-wide AI prompt that can perform actions within your platform… but that can also call into Luzmo using our API integration in case the question is related to reporting & analytics.
An application-wide prompt that can tap into Luzmo AI by using our API integration
Retrieving chart suggestions for a set is as easy as calling:
While integrating with our prompting AI can be done via:
The resulting charts can be inserted in an existing dashboard’s contents or added to a new dashboard:
Personalized & contextual charts
You can also use our API to provide the necessary context about your (end-)users to let Luzmo AI create personalized insights that perfectly fit the context of the user’s current task… even conveying your own brand voice.
For example:
Some further inspiration:
- For multi-lingual SaaS platforms, use Luzmo AI with prompts in languages other than English (e.g. French, Spanish, Dutch, …).
- For a Fintech SaaS, send out warning e-mails when a customer’s asset portfolio experiences a significant valuation decrease (eg. using Luzmo Alerts) but include a personalized chart or dashboard to show the specific root cause of the event.
- For SaaS platforms with layered target audiences, provide context on role descriptions to tailor charts to the right level of detail. For example, show helicopter-level metrics to general management but detailed product metrics to brand managers and market-based trends to country managers.
Conclusion
The AI-powered chart generator, with its dual integration capability within the Luzmo platform and via an API, offers SaaS companies an unparalleled tool for transforming data into actionable insights.
This advanced solution not only streamlines the data visualization process but also significantly enhances decision-making workflows across various departments, from marketing and finance to operations and strategy, through both direct use and custom API integrations.The possibilities are endless. Share with us what you’re building!
Written by

Ship the future of your data
Let us show you what Luzmo can do for your product.

Leave your e-mail and one of our analytics experts will reach out to you