How to Use AI Analytics to Speed Up your Workflow
Today, you can automate almost any task you can imagine with artificial intelligence. We’ve all used ChatGPT to write an email, summarize a long document, get help generating code, and more.
When it comes to business intelligence, it’s no different. According to a recent survey by Gartner, as many as 61% of companies are forced to rethink their data and analytics operating model because of AI.
But not every organization is ready for that change. Although AI is promising, it brings along many questions:
- What are the best use cases for AI in data analytics?
- What are the possible risks?
- What business outcomes will it drive?
In this guide, you’ll learn everything you need to know before getting started with AI analytics.
What is AI analytics?
Imagine you are struggling with low product sales, and you want to understand what’s going wrong. With traditional business intelligence tools, you’ll usually take the following steps to analyze your data:
- collecting the data from various data sources
- data preparation and cleaning
- transforming the data
- data modeling
- data visualization
- interpretation of the data from the visualization
In other words, it’s a long, complicated process, and you’ll need a data scientist to support you on the way. AI analytics, however, can simplify any of these steps, and makes data analysis accessible to anyone without technical knowledge.
AI analytics refers to the use of large language models to analyze business data. Let’s take the example of data visualization. Many AI-powered analytics tools allow you to type in a question, like “Which products were sold the least this quarter?”, and get a data visualization in return. To get insightful visualizations, you no longer need to understand the underlying data structures or columns.
For data interpretation, you can also use natural language processing (nlp) to summarize any findings into actionable insights. Luzmo’s generative BI GPT is a great example of how you can query your data and get back summarized insights.
Different AI methods to use for data analysis
For business intelligence specifically, there’s an important distinction to make in AI methods:
- Machine learning algorithms are best used for predictive analytics to make accurate predictions. By doing predictive modeling on your historical data, you can make accurate predictions on future outcomes.
- Generative AI tools allow you to ask for data insights using nothing else but plain English. Instead of bothering your data analysts, simply ask a question like: “What is our top-selling product in the last quarter?” - and AI will tell you.
In this article, we’ll focus on the latter. Although both are used for different purposes, both will help you get better insights from unstructured data, much faster than traditional analytics tools.
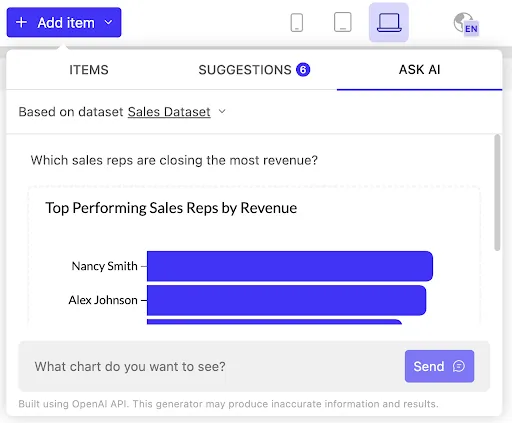
Example of a prompt interface to create data visualizations
Key benefits of using artificial intelligence for data analytics
If you’re already using an analytics platform, you may be wondering: do I really need to introduce AI in my workflows? Truth be told, no matter how simple or advanced your BI setup is, there are many benefits to consider.
Faster decision-making
Getting from raw data to insights can take a bit of time. Especially if you’re dealing with large datasets, a small team, and you need insights fast.
AI allows you to get easier access to relevant data for all users in a company. For example, it can help you spot trends, monitor data in real time, find new business opportunities from existing datasets and more.
You no longer need data analysts for everything. Anyone with basic knowledge of business analytics can formulate a question to find out what a certain data point means. Feedback loops become way shorter, and companies can make informed decisions more quickly.
Automated data visualization and faster data analytics
Without a background in data, it can be overwhelming to know which data to visualize, and how to visualize them. With the power of AI, you no longer have to wonder if a scatter plot or a donut chart is the better way to visualize your data. Based on massive amounts of training data, AI will show you the way.
More and more BI tools are automating repetitive tasks in the data visualization process. Think of ThoughtSpot Sage or Luzmo’s AI Chart Generator. Some generative AI tools, like Instachart, even create a working dashboard from a simple drawing or prompt as its only input.
Scalability and flexibility
If you already have a data stack in place, integrating AI into your existing ecosystem can seem daunting. Thanks to open APIs, it doesn’t have to be. As long as you’re using a data warehouse or data visualization tool with an intuitive API, you can hook up any AI model to your stack.
All you have to do is a user-friendly prompt interface on top, and anyone can start typing questions to analyze their data! You’ll need an engineer to set it up, but from then onwards, anyone without data science skills can find insights in vast amounts of data.
And that brings us to the advantage of scalability. While traditional methods struggle with massive datasets, artificial intelligence - and especially deep learning - can efficiently process vast amounts of data, allowing businesses to analyze all their information and gain insights they might have missed before.
Competitive advantage
For software companies and app developers, AI analytics brings a massive competitive advantage. Software users expect data insights to be readily available inside the apps they use on a daily basis. But user A might be looking for entirely different insights than user B. And that’s problematic if your software product is used by thousands of people.
If you implement AI-powered analytics, you are no longer limited to generic data visualizations. Instead, your customers can interact with their personal data, simply by asking questions.
Accuracy: the main risk of AI analytics
While AI analytics can show you key metrics in seconds and make anyone a data scientist, there are a few important downsides to keep in mind.
First of all, system bias and accuracy are biggest challenge in AI. AI models are trained on content and materials that were created by humans. Unavoidably, AI will take over some of these biases in its responses.
If you use AI for data analysis, always look at the information with a critical eye. AI has amazing statistical power, but in the end, you as a human are best suited to evaluate if the output makes sense in the context of your business.
In short, even the best AI analytics tools require a level of oversight and a healthy dose of skepticism. However, techniques like deep learning and neural networks are largely improving accuracy. Most likely, AI models will only keep improving in accuracy over time.
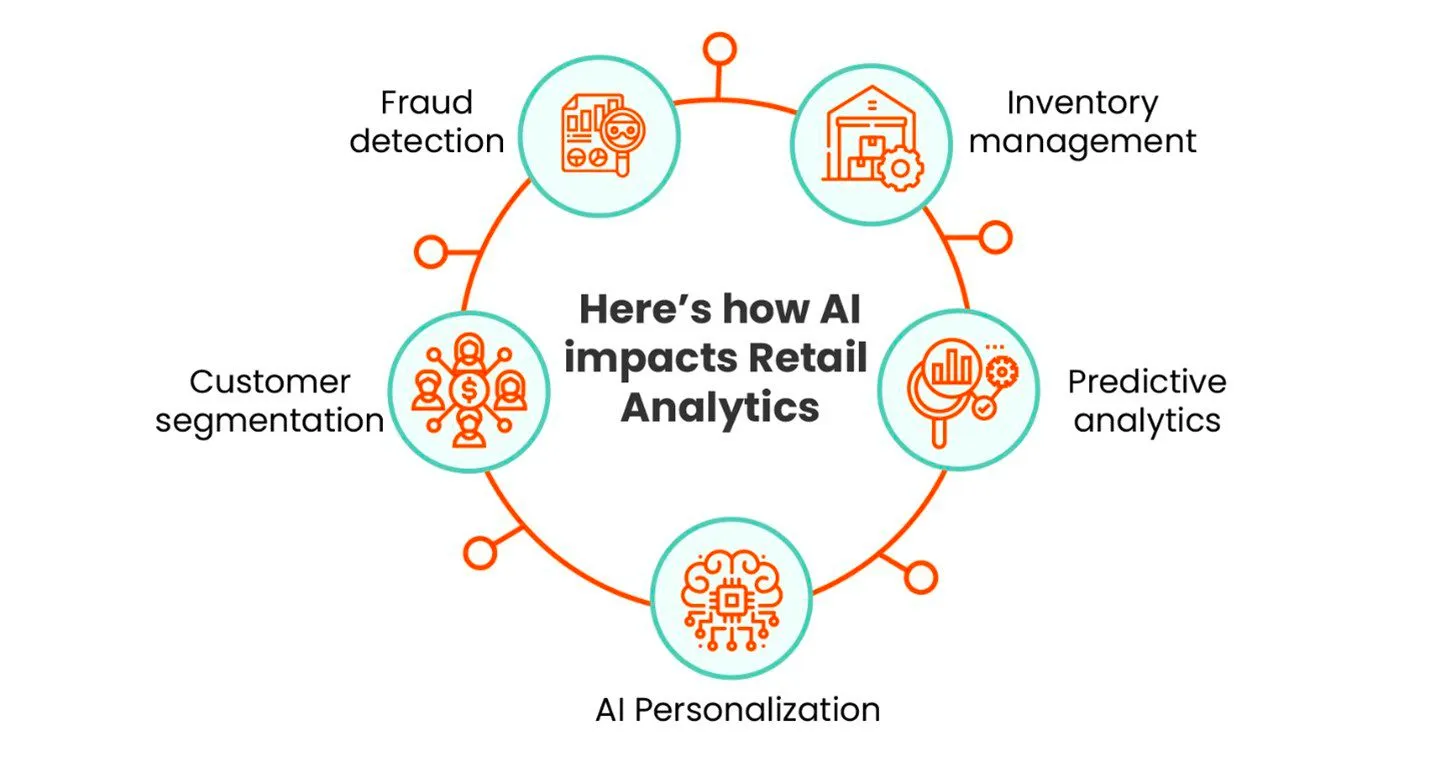
AI analytics use cases
There are many different ways to use an AI analytics solution to make better decisions for your business. Whether you’re in real estate, supply chain or any other industry, here are some examples of how natural language processing and AI can help with BI. You can use them to draw inspiration for your own use case.
For real estate: Predict market trends in property valuation
Feed your AI analytics tool real estate data from your designated area. In turn, it will show you predictions of market trends and give valuable insights on where the best places to invest are.
With AI data analytics, investors and property developers get more thorough insight than any Excel file with basic data could ever give them. As a result, they can make the right choice when it comes to investing in their portfolio.
For supply chain: better inventory management
Machine learning models can take a look at what you currently have in stock, how it’s selling, and make predictive assumptions about the future. For example, if a certain item sells well during holiday time, this will show up in your data.
Over time, you’ll be able to see that certain items sell well at certain times, so you can put extra on order and improve your logistics.
This allows you to optimize the stock in your warehouse, but also improve your product delivery and customer satisfaction, as you’ll know what items are popular and at which times.
For e-commerce: store personalization
Provide a superior customer experience to your online shoppers by using AI to analyze their behavior on your website. Take a look at customer data such as:
- what pages they visited
- what products they purchased
- what items they searched for and left the page
Once the information is in one place, AI algorithms can create a more personalized experience catered to a specific website visitor.
For example, it can suggest a product that a customer is likely to be interested in, based on what they previously did on their website.
When done right, this kind of store optimization can lead to increased purchases and better customer loyalty.
The best part is, as a small retailer, you don't need to build your own website or invest heavily in AI-driven systems. E-commerce platforms like Shopify, Etsy, and their alternatives already offer AI-driven tools to help sellers analyze customer behavior and optimize performance, making these advanced features accessible to businesses of all sizes.
For marketing: customer and audience segmentation for purchases
Most websites today collect significant amounts of marketing data. And with new data coming in all the time, it can be hard to come to any kind of logical conclusion.
AI allows you to streamline your marketing operations by identifying groups of customers and visitors on your website. It can highlight groups with certain characteristics and behaviors that make up a significant chunk of your website visitor base. It can serve as an engagement calculator for various marketing channels and highlight groups with certain characteristics and behaviors that make up a significant chunk of your website visitor base.
This allows you to crate buyer personas based on actual data, rather than assumptions. You can uncover patterns and trends that might not be directly obvious through conventional methods such as purchase patterns, demographics data, and others.
For healthcare: drug discovery and development
While healthcare is a complex and highly regulated field, AI analytics can help here too. It can accelerate the process of discovering new drugs by analyzing complex biochemical data. The algorithm can then use forecasting to predict how compounds can react with certain biological targets.
This helps identify promising drug candidates more effectively and quickly, and reduces the time and costs of bringing a new drug into market. Moreover, any potential side effects can be discovered sooner.
For sustainability: energy management and waste reduction
Imagine taking a look at the energy usage in a certain area and being able to show all that data in an Excel spreadsheet. And then, imagine using AI to do the heavy lifting of discovering useful patterns, andbringing that data to life in visual charts.
AI algorithms can analyze these usage patterns to improve energy efficiency. For example, they can predict peak demand times and adjust energy distribution. That way, there is no shortage when the grid is under a high load.
Also, it can detect anomalies in energy use and spot malfunctions quickly before they spiral out of control.
How Luzmo can help with AI analytics
Data visualization is one of the most important steps in the analytics process. When the right data is visualized in the right way, key stakeholders can make data-driven decisions much more rapidly.
At Luzmo, we’ve developed a suite of tools to help anyone analyze their data with AI.
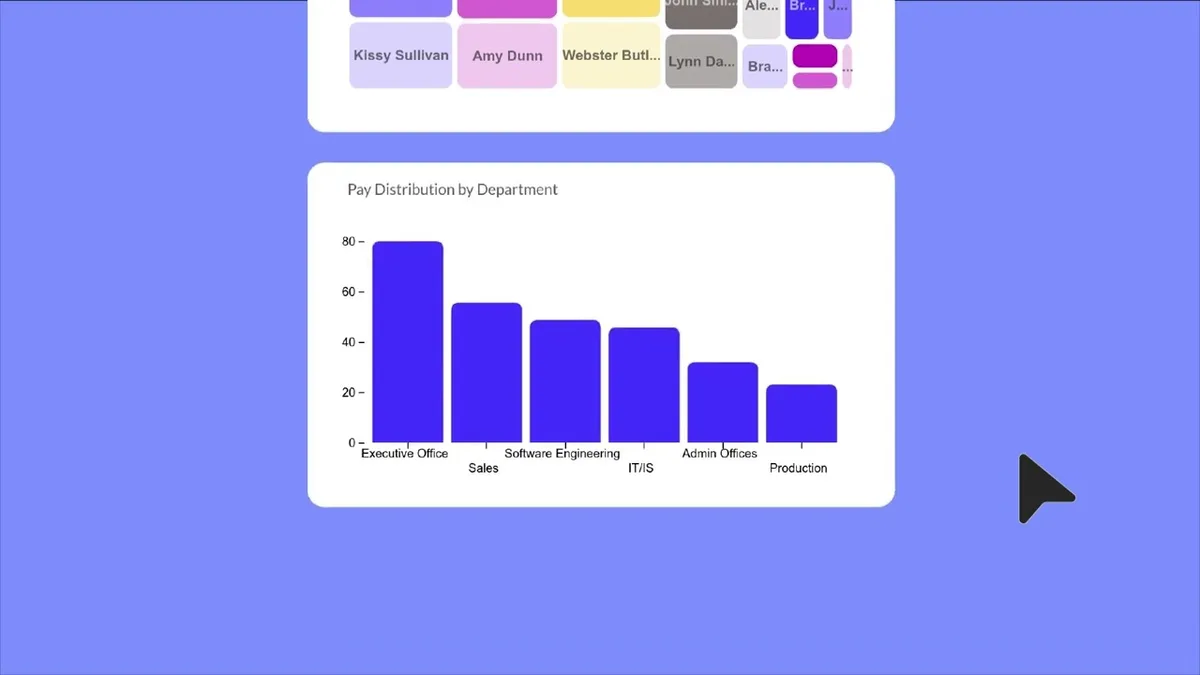
AI Chart Generator
To create insightful data visualizations, you no longer need to understand the data structure behind it. Luzmo’s AI Chart Generator lets you explore data by asking questions. Simply type a natural language prompt and instantly transform your data into insightful charts.
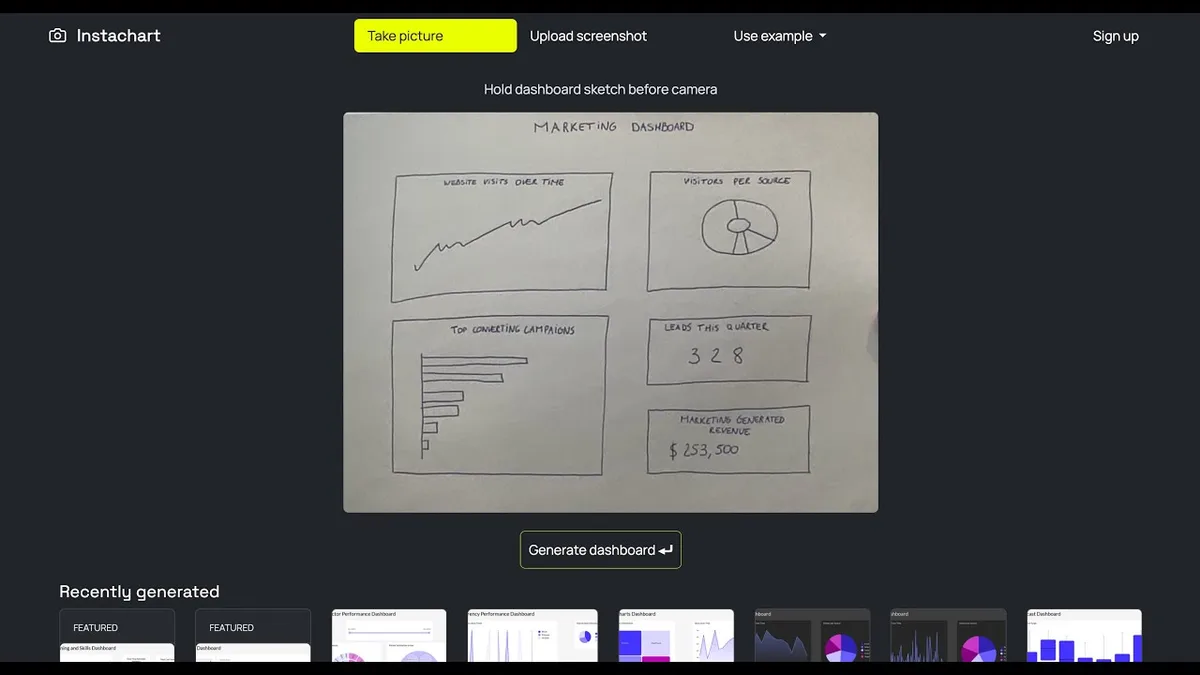
Instachart
Building and iterating on a dashboard can take up a lot of time. With Instachart, you can create interactive dashboards with nothing more than a screenshot or a hand-drawn sketch. Take a picture and get a live dashboard in return.
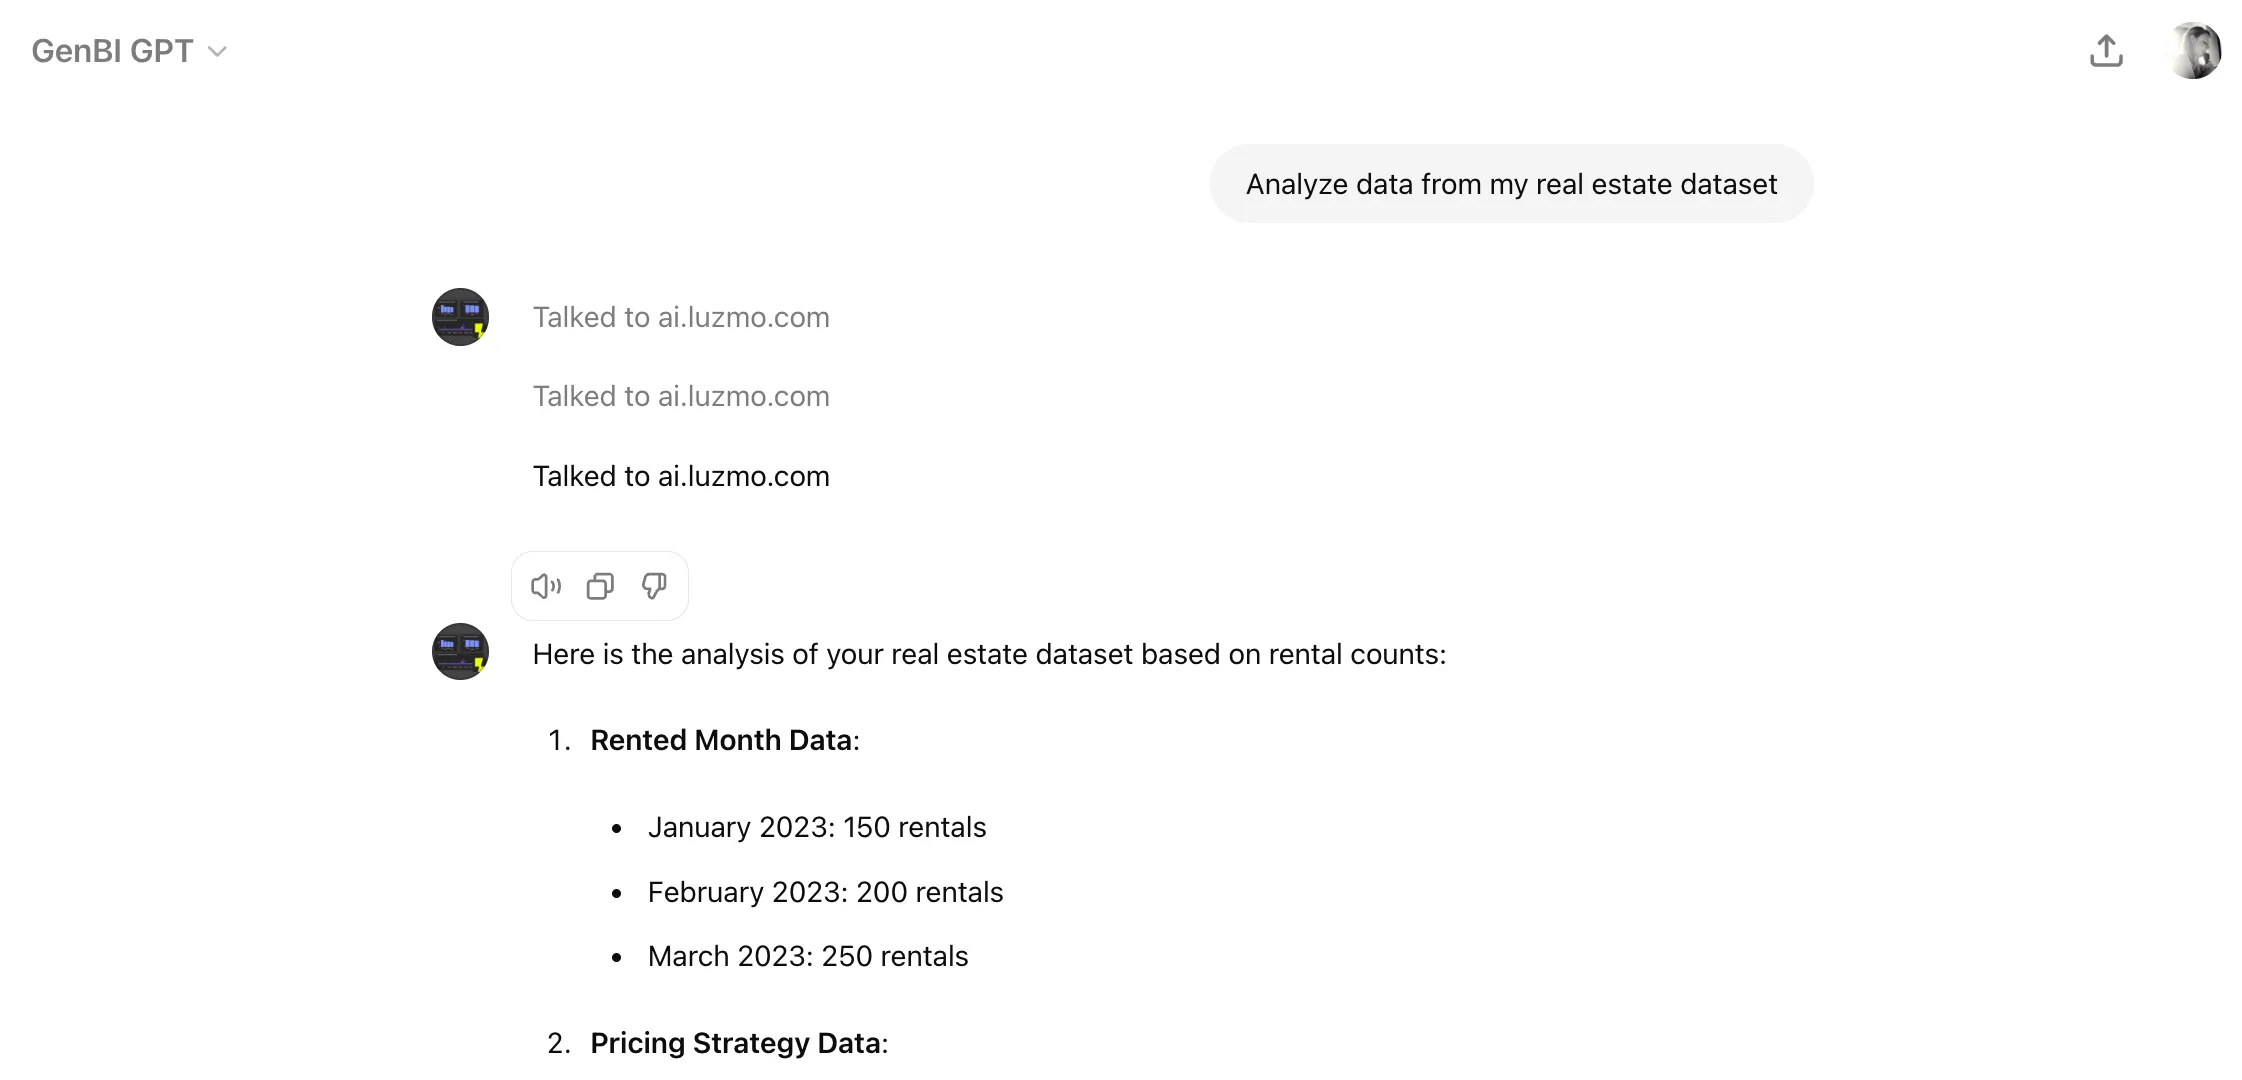
Generative BI (via ChatGPT)
If you prefer to analyze your data conversationally, Luzmo is also available through a custom GPT in ChatGPT. Directly from within ChatGPT, you can connect your Luzmo account and ask questions about your data. You’ll get summarized data insights back in plain English.
Wrapping up
AI analytics tools like the above are a groundbreaking change. They lower the barrier to entry in data analytics, so anyone with access to the right tools and data can investigate and visualize KPIs to reach valuable insights.
Wondering if AI analytics works for your business processes? We are ready to dispel your doubts. Our product experts will help you get started: book a free consultation today!
Written by

Ship the future of your data
Let us show you what Luzmo can do for your product.

Leave your e-mail and one of our analytics experts will reach out to you