How To Do Churn Analysis Using AI
With the effects of the economic downturn still lingering, many SaaS businesses are losing customers because of shrinking budgets and cost optimization. Churn is at an all-time high, which is why retention and upselling will be the top priority for SaaS companies in 2024.
But before you go all-in on retention: do you know why your customers are churning in the first place? Many SaaS companies believe they do, but it’s too often based on gut feeling and overshadowed by single interactions.
To remove any bias, we ran an objective, data-backed churn analysis at Luzmo, based on real interactions with our churned clients. In this article, we’ll show you how you can turn unstructured data from client emails, call recordings, support tickets,... into your own churn analysis dashboard using OpenAI and Luzmo!
What is customer churn analysis?
Customer churn analysis is the process of understanding why paid subscribers stop using your SaaS product. By analyzing customer behavior, user data and customer interactions, customer success leaders can identify the most common reasons for churn. For example:
- usability issues
- missing functionality
- problems during the onboarding process
- support problems
- lack of ROI
- pricing or budgetary constraints
With the insights gathered from a churn analysis, SaaS businesses can develop strategies to improve user satisfaction, reduce the risk of churning, and enhance the overall customer experience. In the end, this will lead to faster business growth, a happy and loyal customer base, and more efficient acquisition of new customers.
How to run a customer churn analysis using AI
Typical churn metrics like churn rate, net and gross revenue retention (NRR, GRR) and lifetime value (LTV) are great for a high-level churn analysis. But how much do they tell you about the real reasons why customers churn? What customers say in calls, emails and meetings is a better indicator, but it’s not easy to turn all that unstructured data (imagine thousands of lines of text) into something quantifiable.
Below, we’ll show you how to use generative AI to turn all that unstructured, textual data into structured data you can use for churn analysis. Afterwards, we’ll turn it into a visual dashboard with actionable insights on why customers drop off to prevent future churn.
Any developer who knows how to use APIs can follow the steps below. If you get stuck on the way, don’t hesitate to get in touch!
What you’ll need
If you want to do a similar churn analysis on your own, you’ll need:
- An account on OpenAI (create one here)
- An account on Luzmo (grab a free trial here)
- API access to your CRM (or a data export will work too)
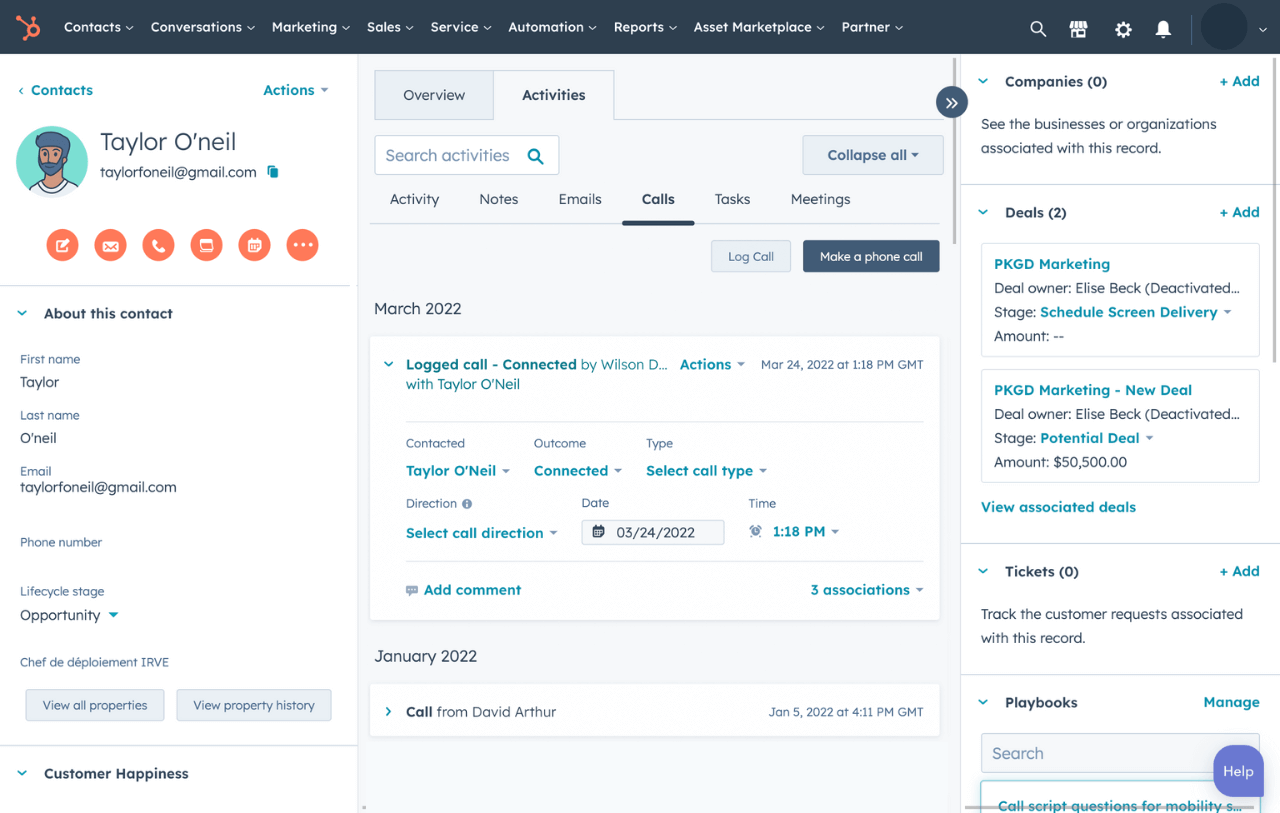
Step 1: Gather churn data from HubSpot
At Luzmo, we use HubSpot as our CRM, so it’s our single source of truth when it comes to customer interactions. Calls, emails, notes and meetings are all logged in HubSpot, so it’s a goldmine of information.
In step 1, we’ll start with retrieving our raw, unstructured data from HubSpot. We’ll use the HubSpot API to retrieve:
- A list of customers that churned after a specific date (you can choose how far back you want to go)
- The last 50 customer interactions for each churned customer (you can choose how many interactions you want to analyze)
To get all customer interactions, we will retrieve 4 HubSpot CRM objects:
- Emails
- Notes
- Meetings
- Calls
If you’re using a different CRM than HubSpot, you can use a similar approach, as long as you can pull a data export, or make API calls to retrieve the data from your CRM. We recommend going the API route, since it’s less manual work and less prone to errors. Here’s an example of the code we used to extract the data from HubSpot.
Step 2: Analyze the last 50 customer interactions using OpenAI
In this step, we'll retrieve the last 50 interactions of each customer, and extract the main churn reasons from each interaction using OpenAI.
We’ll supply the OpenAI API with:
- the customer interaction data retrieved from HubSpot
- a prompt to analyze each interaction
In the prompt, we give OpenAI more context about our business and ask it to act as a virtual assistant that analyzes customer feedback. To smoothly extract the main churn reasons from each customer interaction, the prompt includes questions like:
- Does the customer mention possible reasons for churn?
- Summarize the possible churn reasons mentioned by the customer in max 250 words.
- Does the customer mention alternative solutions they will use in the future?
- Does the customer mention ongoing or past problems with our product, like bugs, missing features, etc.?
- Does the customer mention issues with our services?
In our script, we’ll add function calling to tell OpenAI how they should return the data in a structured format. Here’s what that looks like:
For every single email, meeting, call or note, OpenAI will retrieve the answers for each of these questions, in the format we specified above.
Tips for analyzing large amounts of unstructured data with OpenAI
For the most accurate response, we recommend adding extra context and examples to each question. It will help the language model better identify the information you are hoping to get. Also have a look at OpenAI tools (previously called function_calls), which were a tremendous help in turning unstructured data into structured data.
For this step, it’s OK to use GPT-3.5 to save some money. Since lots of the customer interactions included probably won’t mention any churn reasons, we will later run another prompt with GPT-4, only using the interactions where we identified information regarding the churn. This will give you accurate, rich results in the most cost-effective way.
Step 3: Upload churn analysis data to Luzmo
Now, you have a first dataset that can give you some interesting insights into why customers canceled their subscriptions. Let’s upload it to Luzmo for analysis!
Although it’s still pretty raw information, you can already split between service issues and product issues. Put this information in a data table to share with your support reps and product team, so they can browse through the churn summaries.
Pro tip: if you’re pulling the info straight from your CRM, you can even include links to the deal in HubSpot, so your team can take action directly!
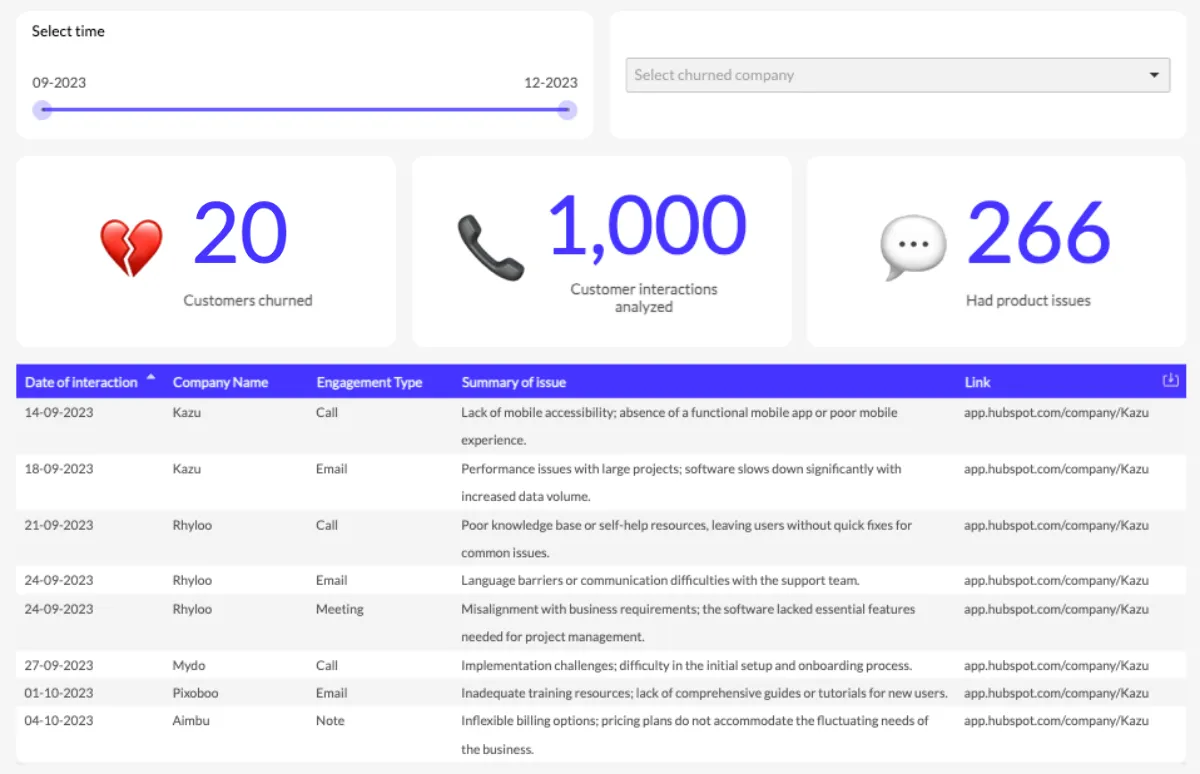
Example of the reasons for churn mentioned in each call, email, or meeting
Step 4: Categorize churn reasons
While this is a great starting point, it doesn’t give us an interactive overview of the main churn reasons yet. In the next 3 steps, we’ll further refine the analysis to get exactly that!
Equipped with our list of churn summaries, we will now ask OpenAI to classify each churn into a broader category. For example, imagine 2 churned customers:
- Customer 1 mentions their problem was not solved after interacting with support
- Customer 2 mentions it takes too much time to get a response from the support team
Although these are two completely different reasons for churn, they both qualify as customer support problems. By making this distinction between the category and specific reason, we can get a clearer picture of churn.
We decided to let OpenAI create our churn categories based on the info in step 2, to avoid the bias of setting your own categories. By working backward from actual customer data, you’ll have a richer, customer-centric view of churn. Below is the code, including the prompt, we used for this step.
Step 5: Identify churn reasons per customer
Let’s recap our previous steps:
- We now have our list of churn categories
- We analyzed the last 50 interactions we had with each churned account
- For each interaction, we have a summary of the churn reasons (if available)
Although we now have a better idea of the problems mentioned in emails and calls, we don’t have the main churn reason per customer yet.
For this last step, we will use GPT-4 since it’s a stronger model overall, and it can handle longer prompts than GPT-3.5. To get the main churn reason per customer, we set up a complex prompt with the following steps:
- As input, we give GPT-4 only the interactions that contained churn reasons in our first analysis
- From the bulk interactions per customer, we ask GPT-4 to return the main churn reason for that account
- We use functions to tell GPT-4 in which format it needs to return the information
Below you can see what these functions could look like:
Now, we send a prompt to OpenAI that uses these function calls, as well as the customer interactions, as input:
After executing this prompt, we’ll get a structured dataset as a result, which we’ll use for our churn analysis dashboard.
Step 6: Creating your churn analysis dashboard in Luzmo
So far the difficult part! You now have a structured churn dataset, which you can upload to any analytics tool to visualize the data. We’ll use Luzmo, our embedded analytics platform, for the visualization part.
For the best results, we recommend storing the responses from OpenAI in your own database or data warehouse, which you can seamlessly connect to Luzmo using one of our data connectors.
Now the fun begins! You can start exploring your churn data in visual charts. This will make it a lot easier to decide on actions for churn prediction, retention strategies, and increasing customer engagement.
Below, you can find an example of what a resulting churn dashboard could look like. For this example, we used ChatGPT to create a mock dataset with churn interactions of a project management software company.
And that’s it! If you made it this far, you’re ready to start your own churn analysis. Use the dashboard to monitor churn reasons on an ongoing basis and spot patterns before they become issues!
Other relevant churn metrics for SaaS
Although the analysis above goes pretty deep into churn reasons, there are many other KPIs that can help you track and analyze churn over time. Below are a few core churn metrics you shouldn’t overlook.
Customer churn rate
Customer churn rate is the percentage of customers who cancel or do not renew their subscription during a given period, compared to your total amount of customers. This is one of the North Star metrics for any customer success team in SaaS.
How to calculate: (Number of customers at the start of the period - Number of customers at the end of the period) / Number of customers at the start of the period
Why use it: to measure a company's ability to retain customers.
Net revenue retention (NRR)
Net revenue retention (NRR) measures how much recurring revenue you’ve retained from existing customers over a specific period of time, including upsells, downgrades and churn.
How to calculate: (Revenue from existing customers at end of period + Upsells - Churn) / Revenue from existing customers at start of period) x 100
Why use it: to measure total revenue impact from existing customers, accounting not just for losses, but also for wins.
Gross revenue retention (GRR)
Similarly to NRR, Gross revenue retention (GRR) measures the percentage of recurring revenue you’ve retained from existing customers over a period of time. However, it does not take upsells into account, only churn.
How to calculate: (Revenue from existing customers at end of period - Churn) / Revenue from existing customers at start of period) x 100
Why use it: to measure how efficiently your company maintains its existing revenue base, without looking at the effects of upsell.
Customer acquisition cost (CAC)
The customer acquisition cost is the average budget you need to acquire a new customer for your SaaS business.
How to calculate: Total cost of sales and marketing / Number of new customers acquired
Why use it: to evaluate the ROI of marketing activities and make better budget decisions.
Customer lifetime value (LTV)
Customer lifetime value is the total revenue a business expects from a customer throughout their entire customer lifecycle, from the moment of signing a contract up until they cancel their subscription.
How to calculate: Average revenue per user (ARPU) / Customer churn rate
Why use it: to determine how much you can invest in customer retention and acquisition
Customer attrition rate
Customer attrition rate measures the rate at which customers end their relationship with a company in a given period. Customer attrition rate and customer churn rate essentially measure the same thing: the ability of a company to retain its customers.
However, there are some nuances in their meaning. While customer churn rate typically looks at cancellations – ideal for SaaS subscription businesses –, the attrition rate is a little broader. For example, besides cancellations, it also looks at more natural reasons why a customer might leave, like company closures, non-renewal, a company takeover, etc.
Net Promoter Score (NPS)
Net Promoter Score is a score between -100 and 100 based on how likely customers are to recommend a company to others. It is determined by calculating the percentage difference between the number of so-called promoters and detractors. Typically, companies send out NPS surveys to get each individual customer’s rating, which is the basis for calculating an NPS score.
How to calculate: Percentage of promoters (customers rating 9-10) - Percentage of detractors (customers rating 0-6).
Why use it: to understand overall customer satisfaction and customer loyalty.
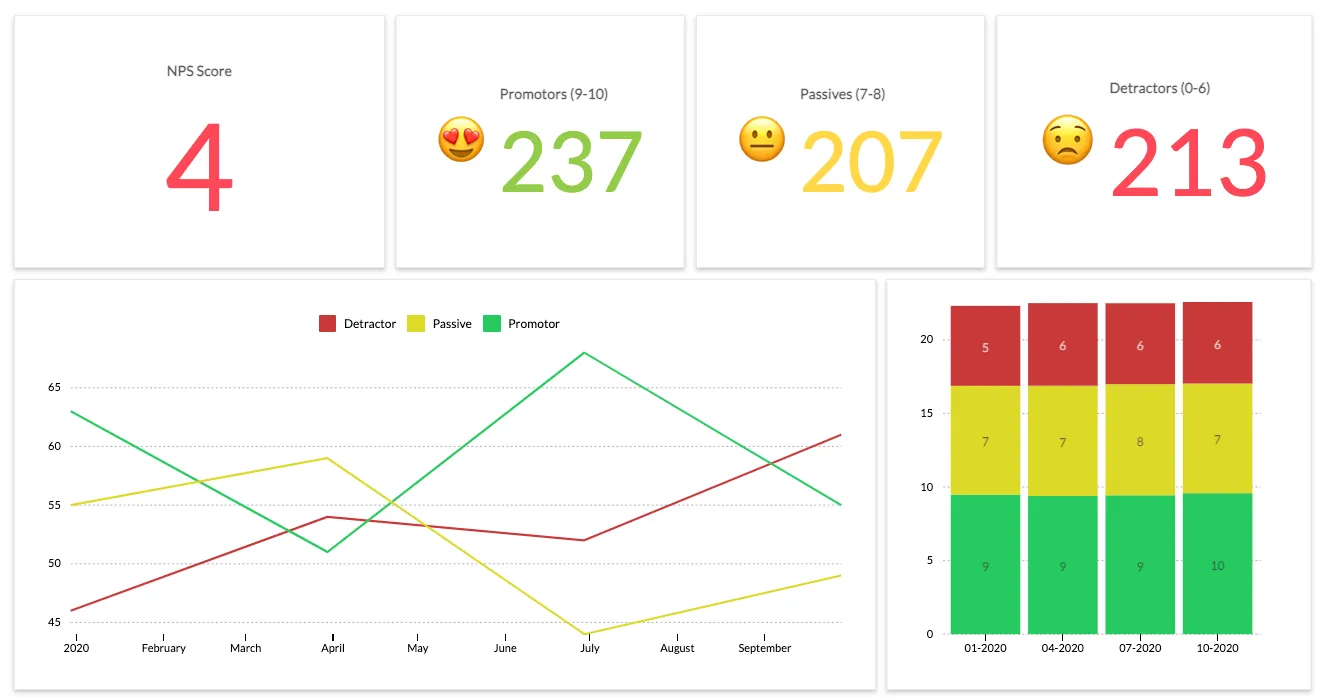
Example of an NPS dashboard in Luzmo
Additional tips for analyzing churn
If you want to dive even deeper into your data, here are some other ways you could analyze churn to uncover new strategies for retention and mitigating the risk of churn.
Cohort analysis
You can group customers into cohorts based on when they signed up for your SaaS product. Then, you can start analyzing different metrics:
- % of customers still subscribed after one month
- % of customers still subscribed after 3 months
- % of customers still subscribed after 6 months
- % of customers still subscribed after a year
Thanks to these cohorts, you can identify trends over a specific period of time, for example:
- If you have high churn early on in the customer journey, you may need to improve your onboarding processes
- If churn grows over time, it might be a sign to work on continuous engagement, by introducing new features or activation mechanisms, like email alerts
- If churn increases at a single point in time, you may need to investigate bugs, issues or market trends that may cause a sudden spike in churn
Customer segmentation
Besides creating time cohorts, you can also segment your customer base by other criteria, for example:
- demographics
- product usage (e.g. power users vs low-touch customers)
- subscription type (e.g. high-value vs low-value customers)
You could uncover patterns across your data, such as:
- people using feature A are likelier to churn, meaning you may want to improve that functionality
- people using feature B are less likely to churn, meaning you can use this as an opportunity to help customers with high churn risk get more value out of your product
- churn is higher on monthly plans than on annual plans, which could trigger a marketing campaign with incentives to upgrade to an annual plan
Churn forecasting
To proactively reduce churn, you could use metrics like a health score per customer to track how likely they will cancel their subscription. Set an expected churn rate for each score based on historical data to create an accurate forecast of how much MRR is currently at risk.
Analyzing churn often reveals a common theme: timing is everything. Whether it's reaching out after a key milestone or addressing issues before they escalate, the ability to schedule and manage interactions effectively can make all the difference. For teams struggling with rigid or inefficient scheduling tools, exploring Chili Piper alternatives may uncover solutions that fit their workflow better, helping to retain more customers.
Start reducing churn today
Understanding why your customers are leaving starts with your data. There is so much knowledge to uncover from the daily interactions you have with customers, you just need to know how to do it.
With the tips and methodologies above, you can start analyzing your churn data and reduce friction with customers today!
At Luzmo, we can help you make better decisions based on your data. And not just you, but your customers too! With our embedded analytics platform, you can add customer-facing dashboards, reports and advanced analytical features to your SaaS product in days, not months.
Sign up for a free trial today, and build your first dashboard in only a couple of hours!
Written by

Ship the future of your data
Let us show you what Luzmo can do for your product.

Leave your e-mail and one of our analytics experts will reach out to you