Energy management dashboard
Benchmark the energy consumption of your facilities and reach your sustainable development goals.
Sustainability & GreenTech
Add interactive analytics dashboards to your greentech platform in days, not months. Give your users accurate sustainability metrics and empower data-driven, environmentally-friendly decisions.
4.6/5 on G2 and Capterra
Trusted by product teams worldwide
Product overview
Give users insights and answers in a fully native product experience.
Add interactive visualizations that show just how your product’s sustainable practices make a mark on our planet. Backed by facts and numbers.
Launch dashboards with sustainability insights such as greenhouse gas emissions, carbon emissions, renewable energy use and many others.
Create data analysis dashboards that managers understand. Increase product usage and better decision-making with beautiful, interactive visualizations.
Customers
GreenTech teams shipping analytics with Luzmo.

Our platform is used by sustainability leads. For them, it’s super important to have an attractive dashboard they can show to their executive team. In some sense, what we are building with Luzmo is the surfacing value of our platform.Read case study

Matthieu Vegreville
Head of Engineering at Greenly
Matthieu Vegreville
Head of Engineering at Greenly
Preview a live sustainability analytics dashboard embedded with Luzmo.
Turn your data into actionable insights with these analytics dashboard examples.
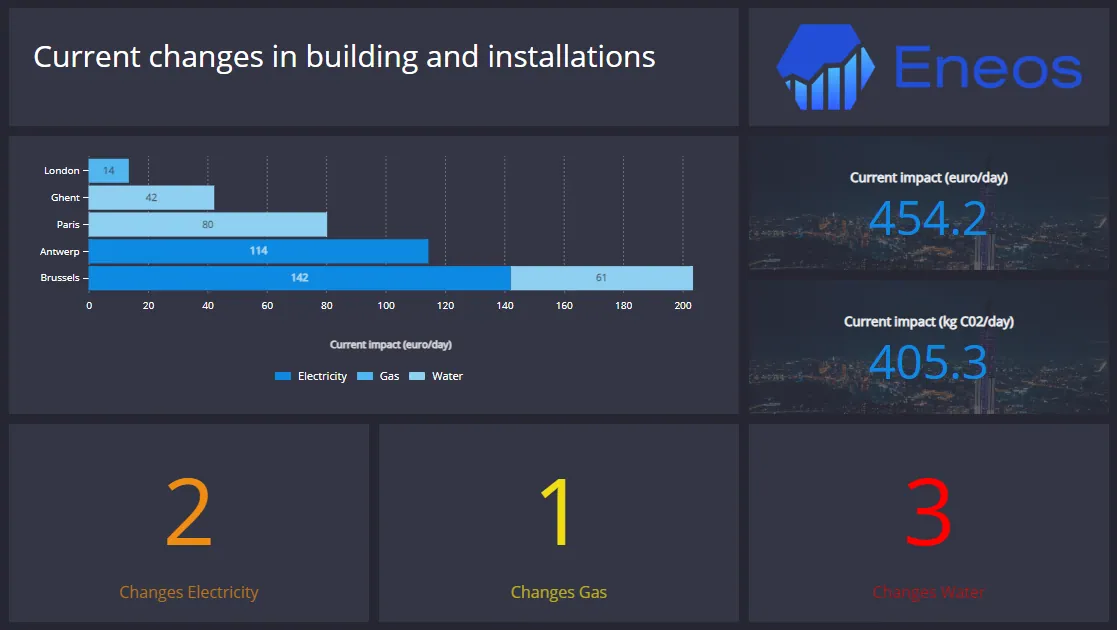
Benchmark the energy consumption of your facilities and reach your sustainable development goals.
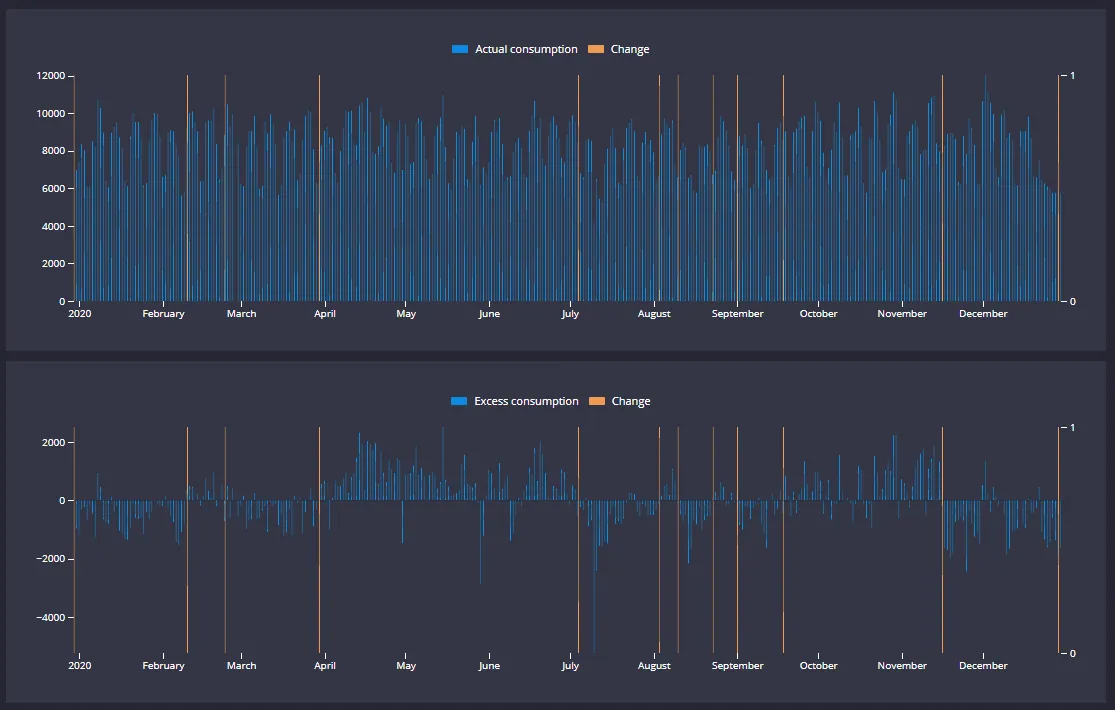
Analyze datasets and use machine learning and forecasting to reach your sustainability goals.
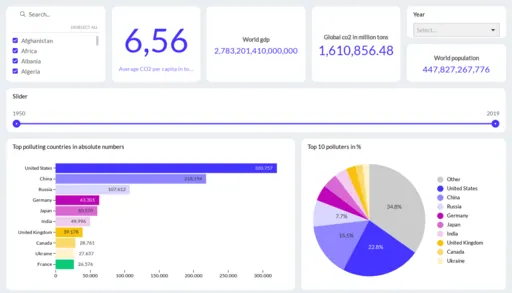
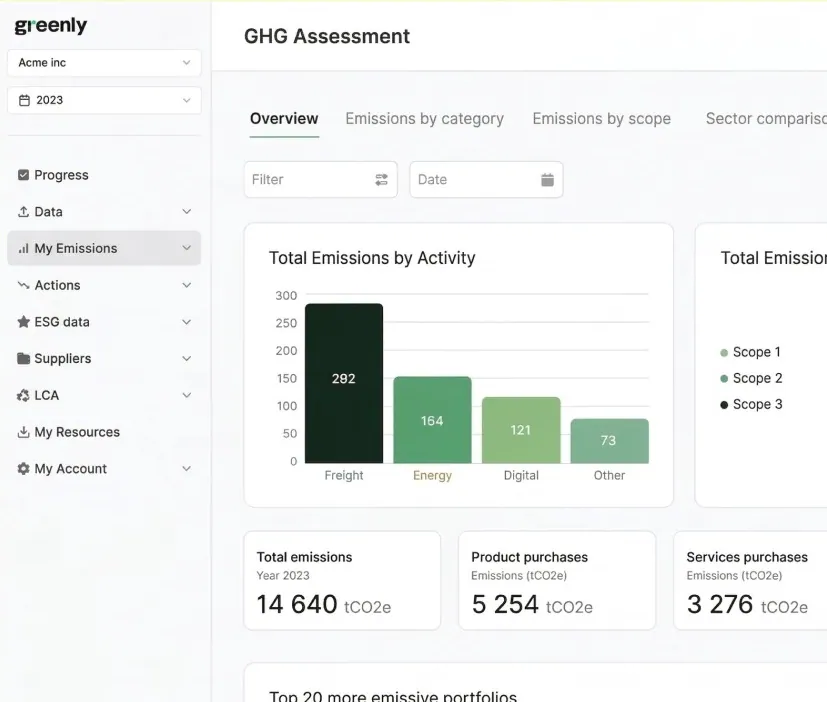
Measure carbon emissions, pollution and other ESG data to reduce your carbon footprint.
Implementing Luzmo
Whether your team builds with clicks, code, or agents, Luzmo ships with all three.
No-code builder
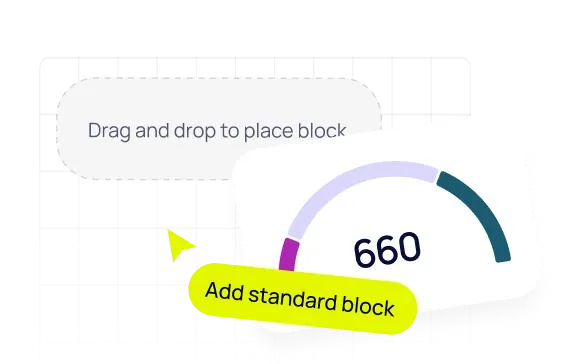
Drag, drop, ship. No engineering ticket required.
Full-code control

Style every pixel, swap any behavior, own the experience end to end.
AI agents
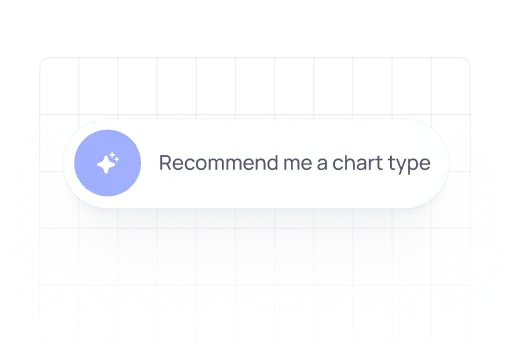
Skip the dashboard build. Embed with agents instead.
Use cases for GreenTech
Bring sustainability insights to life with embedded analytics.
Greenly
How a carbon management platform delivers personalized carbon assessment reports to their customers.
Enersee

How to improve corporate sustainability by showing energy and water management metrics in real time.
CurieuzeNeuzen
How ESG reporting can be used by everyday people—not just ESG data experts.
All your questions answered.
Sustainability analytics software turns environmental and operational data—energy use, emissions, water, waste, supply chain signals—into dashboards your customers can explore. Instead of static PDFs, teams see trends, benchmarks, and opportunities in real time inside your product.
Sustainability leaders need to prove impact to executives, regulators, and customers. Embedded analytics keeps them in your platform, improves retention, and unlocks premium reporting tiers without a separate BI tool.
Most teams connect their warehouse or APIs, model datasets in Luzmo Studio, and embed a first dashboard in days. You can theme the experience, enforce multi-tenancy, and iterate on metrics as your ESG program matures.
Let us show you what Luzmo can do for your product.

Leave your e-mail and one of our analytics experts will reach out to you