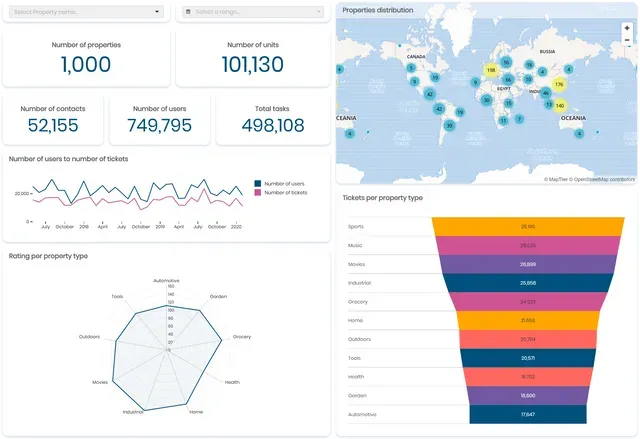
Property management dashboard
Get a full overview of your portfolio, requests and tenant ratings for each property you own.
Proptech
Give real estate teams interactive dashboards for portfolios, construction, and tenant experience—inside the software they already use.
4.6/5 on G2 and Capterra
Trusted by product teams worldwide
Product overview
Give users insights and answers in a fully native product experience.
Visualise occupancy, rent rolls, and asset performance in one embedded experience—no more static spreadsheets.
Let customers filter, drill down, and save views without waiting on your data team.
Pair Luzmo IQ with your models to answer “what changed?” in plain language—right inside your workflow.
Customers
Proptech teams shipping analytics with Luzmo.
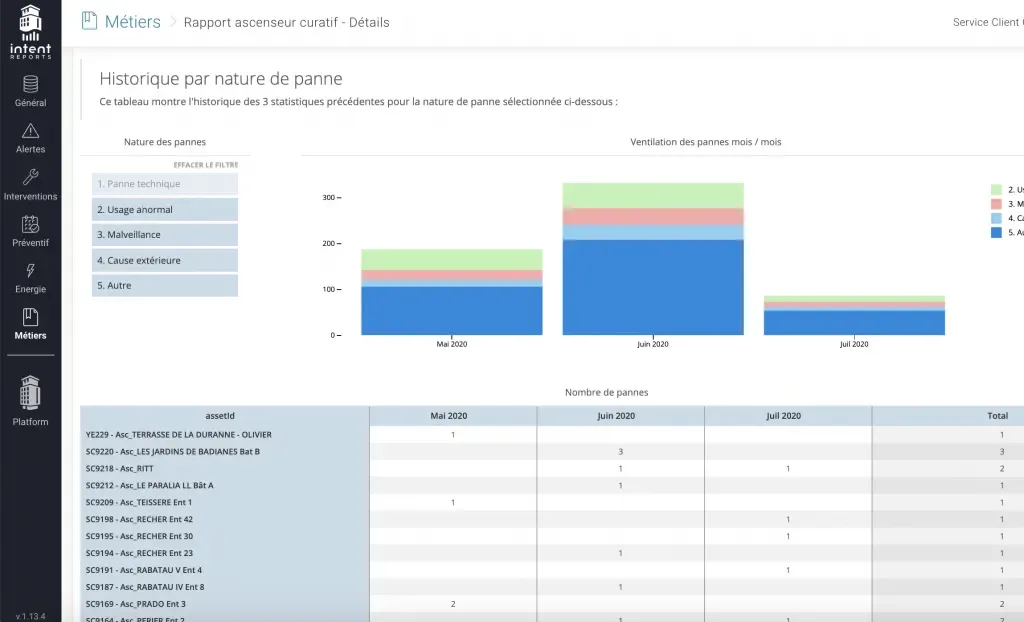
Luzmo allowed us to reduce the time to produce a dashboard from weeks to days. Even to hours.Read case study

Alexis Lesage
CTO at Intent Technologies
Alexis Lesage
CTO at Intent Technologies
Preview a live embedded dashboard for proptech teams.
Turn your data into actionable insights with these analytics dashboard examples.
Get a full overview of your portfolio, requests and tenant ratings for each property you own.
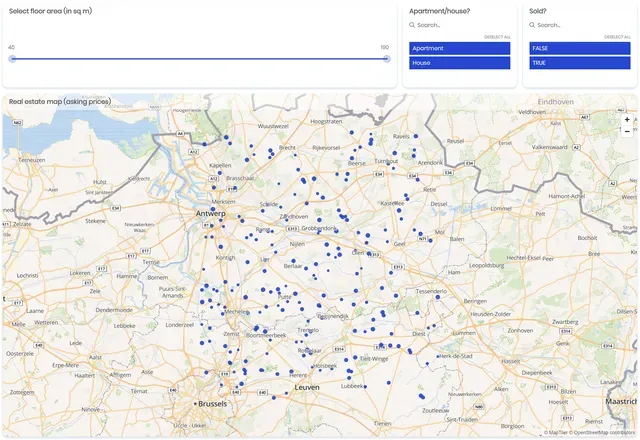
Ideal for real estate companies who want an overview of sales agent performance across marketplaces.
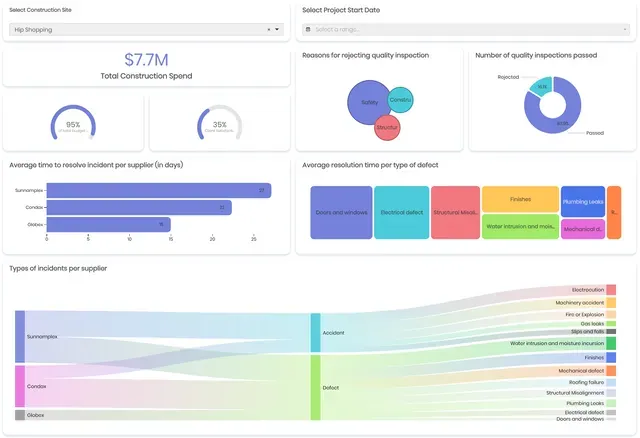
Stay on top of real estate development by tracking budgets, deadlines, quality inspections, and more.
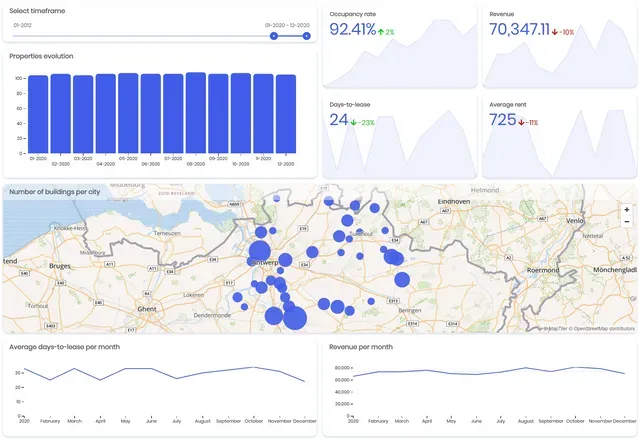
Give rental managers a handle on all their rental properties. This dashboard visualizes how many properties are currently rented, the average rent, total rent income, and which geographical areas are most profitable.
Implementing Luzmo
Whether your team builds with clicks, code, or agents, Luzmo ships with all three.
No-code builder
Drag, drop, ship. No engineering ticket required.
Full-code control
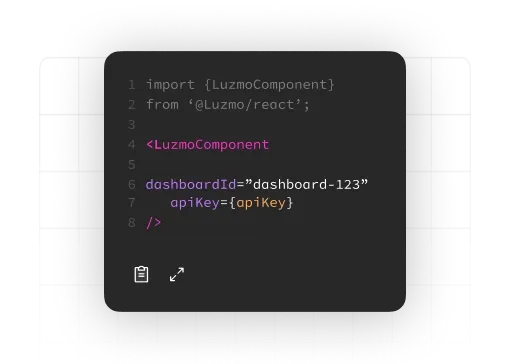
Style every pixel, swap any behavior, own the experience end to end.
AI agents
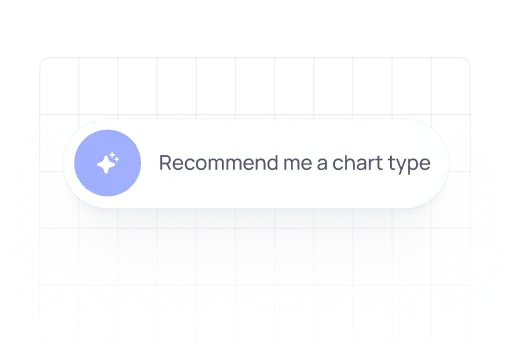
Skip the dashboard build. Embed with agents instead.
Case studies
Get inspired by proptech companies using Luzmo to offer embedded analytics features to their customers.
All your questions answered.
All types of real estate professionals can use property technology analytics: real estate investors, agencies, construction companies, proptech startups, property developers, lenders and anyone who wants to get more data about their properties.
They can help their end users (real estate agents, investors, developers and others) make better and more data-driven decisions. Data analytics platforms allow your business to add insights quickly without wasting resources in-house (hiring developers or using their time), all the while ensuring an amazing user experience.
To collect and analyze data in one place. Examples include: property valuation data, tenant experience metrics, financial performance of construction projects, occupancy of commercial buildings, sustainability of your projects, benchmarking progress and much more.
To go from big data to insights that you can understand. Instead of building complex and time-consuming spreadsheets, get all your data in the form of beautiful dashboards with visualizations such as charts, graphs, scatterplots and many others.
Let us show you what Luzmo can do for your product.

Leave your e-mail and one of our analytics experts will reach out to you