Beginner's Guide to Data Discovery: What it is and How it Works
Have you ever tried reading a dictionary? All those words on their own in one place are impressive, but it’s far from a masterpiece like The Great Gatsby. The same goes for your data - just having it in one place at a time is good but does not tell you a captivating story.
To make sense of various datasets that your business collects, you need data discovery. Today, we will show you what data discovery is, how to do it, and which tools you can use to get started. And don’t worry, you don’t need a team of data scientists to do any of what we’re going to describe.
What is data discovery?
Data discovery is the process of analyzing your data and finding meaningful patterns. Most businesses collect data from a large number of sources and in a plethora of formats. As a part of business intelligence, data discovery serves as a way for businesses to become more efficient, better understand their customers and their own business, and, in the end, make better business decisions.
There are two main types of data discovery: manual and automated (smart) data discovery.
- Manual data discovery means going through your datasets and trying to identify trends and patterns manually. Usually, the process is extremely resource-consuming.
- Automated data discovery means using automation tools to find meaning in your data and is the preferred method for many businesses.
Why is data discovery important?
Data is all around us and no matter what type of business you run, you’re going to work with business data in some shape or form. Smart data discovery is the first step in making sense of that data and using it for business advancements.
Here are some data discovery use cases:
First, you can analyze and refine your internal business processes. You can spot inefficiencies and learn where you need to spend more, work smarter and what to eliminate.
Second, you’ll have more data about your customers – who they are, how they use your product and what they spend time and money on. This can be helpful for decision-making process, but also some more specific cases. With more unstructured data, you'll uncover surprising patterns that help streamline your product and keep customers hooked.
Plus, it's a game-changer for risk management – you'll spot issues before they even have a chance to throw a wrench in your plans. In the end, more data means more power to make smarter, quicker decisions and stay ahead of the game.
Third, you can save money by analyzing where you have the best return on your investment. You can also find out which types of customers bring the most value to your business, and adjust your tactics thanks to predictive analytics.
Last but not least, your business can become more secure and compliant as data discovery helps with data protection regulation. Proper data discovery is the beginning of protecting your (and your customers’) data and complying with international regulations and data governance laws such as GDPR.
Data discovery process: step by step
Whether you do it in an automated or manual way, data discovery is an iterative process that involves several key steps. It’s worth noting that companies handling a lot of data discovery and data exploration often require a dedicated data product manager to manage their data catalog and ensure data privacy compliance, particularly with privacy regulations like GDPR – unless they use a tool to help them out with this task.
Below, you’ll find a few steps to follow in the data discovery process.
1. Identifying your needs
First, determine what you want to do with your data. Do you need to spot trends in your paid spend or identify how much server bandwidth your customers are using each month? Once you identify your needs, you’ll be able to define the relevant data and sources, and figure out which tools, such as data discovery solutions, you should employ to ease the process.
2. Combining your data sources
To get a comprehensive view, you’ll need to gather data from various sources. For example, in marketing, you may need paid ad data from platforms like Facebook, LinkedIn, Instagram, and Google Ads. To accomplish this, smart data discovery tools that support data integration from multiple sources are crucial for seamless data processing.
3. Cleaning your data
Cleaning your data involves deduplication, proper formatting, filling missing fields, and removing errors or outliers. This data preparation ensures high data quality, making sure that the data from different platforms is consistent. Clean data ensures accuracy in business intelligence dashboards, which stakeholders might then use to make data-driven decisions.

4. Ensuring data security and privacy compliance
As you handle sensitive data, it's crucial to maintain robust data protection. Implement access controls, data classification protocols, and adherence to privacy regulations such as GDPR. This step ensures that business users and data scientists alike work within a framework that prioritizes both data security and data privacy.
Partnering with outsourced IT support Buffalo providers can further strengthen your dataprotection efforts by offering expert solutions tailored to meet compliance and security needs.
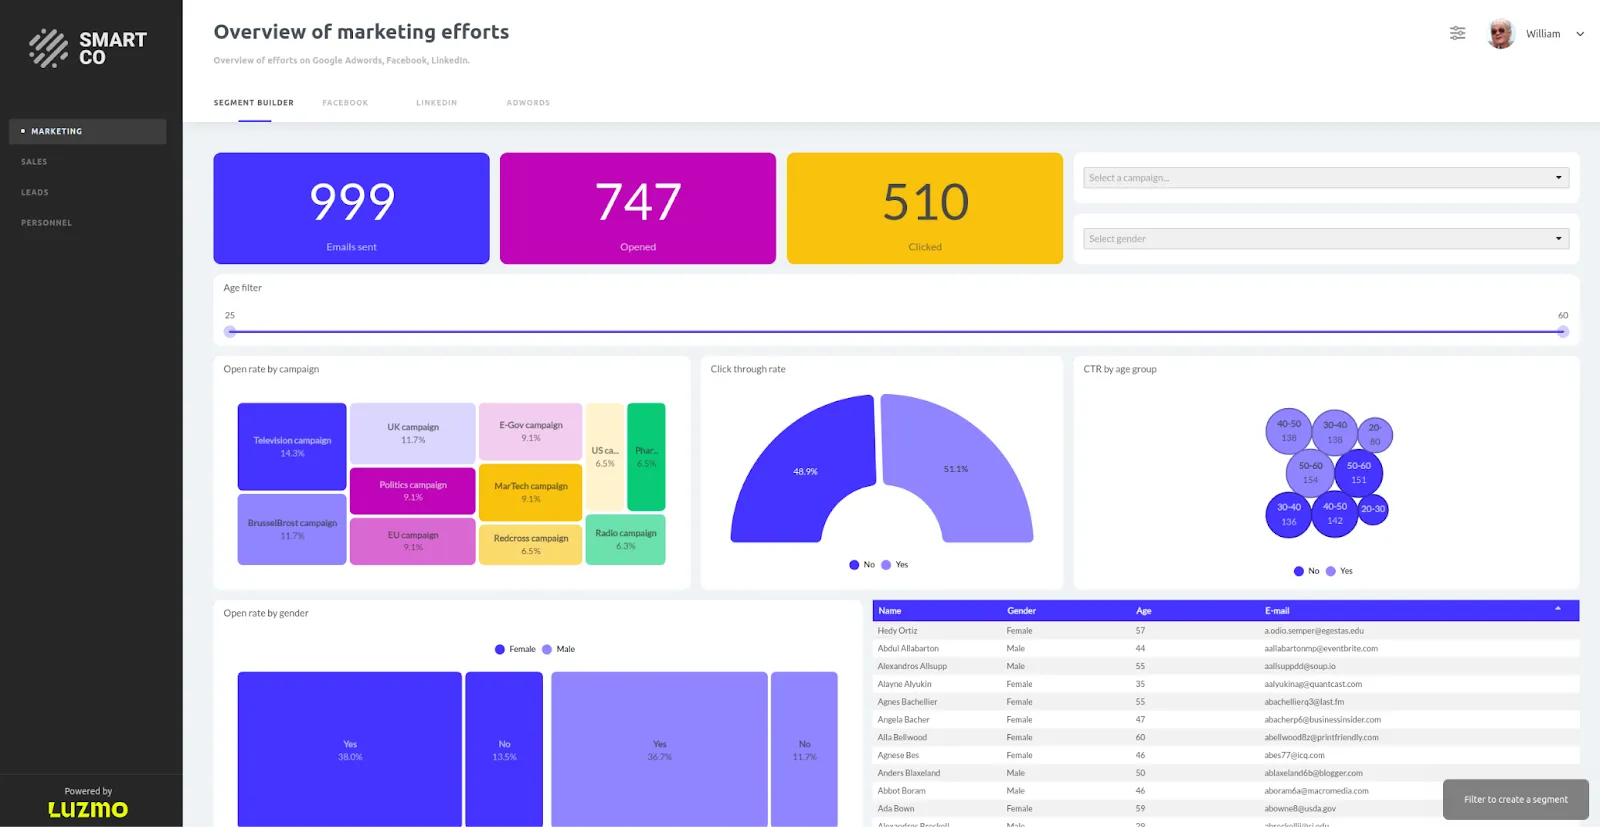
5. Visualizing your data
Having numbers in front of you is helpful, but visualizing that data is even more powerful. Tools that offer graphs, pie charts, and dashboards allow you to present data insights in ways that stakeholders can quickly understand.
This is why it is better to use a process flow diagram and other visuals to explain complex information rather than relying solely on textual explanations or spreadsheets.
Data visualization not only enhances understanding but also helps unearth market trends and other actionable insights.
Most of the tools we’ll mention in a minute support a variety of data visualization types: graphs, pie charts, bar charts, histograms, Gantt charts, scatter plots, and others.
6. Analyzing your data
Once the data has been cleaned and visualized, analysis can begin. Using smart algorithms and data discovery solutions, you can identify patterns, trends, and risk factors. For instance, you might discover that you're overspending on one platform without seeing a corresponding return on investment. These insights empower you to make smarter, data-driven decisions.
7. Collecting and managing new data
As your business evolves, you’ll encounter new data, both structured and unstructured. Incorporating data collection into your data lifecycle helps ensure that your business stays ahead of the curve. Through continually refining your data catalog, you allow stakeholders to benefit from ongoing advancements in data exploration and actionable insights.
8. Recording and retaining results
With the analyzed data, save it in a secure data warehouse and keep it accessible for future reference. This data retention allows for continuously refining your business processes, supply chain, or customer experience strategies. Metadata should be stored alongside the data for enhanced functionality in later stages.
9. Applying data-driven decisions
The final step in the data discovery process is to use the insights gained to make informed decisions. Whether you’re optimizing spending, refining business intelligence strategies, or pursuing new customer segments, the insights gathered from data discovery help you adapt to changing market conditions and improve the overall customer experience. Recording these decisions ensures they contribute to long-term business growth.
Data discovery tools you should try
The average business today collects a large amount of data. From your customers, website visitors, internal team members, and other stakeholders, through a variety of apps and platforms. To make sense of it, you can try these tools - most of them will not require any knowledge of data science to use them proficiently.
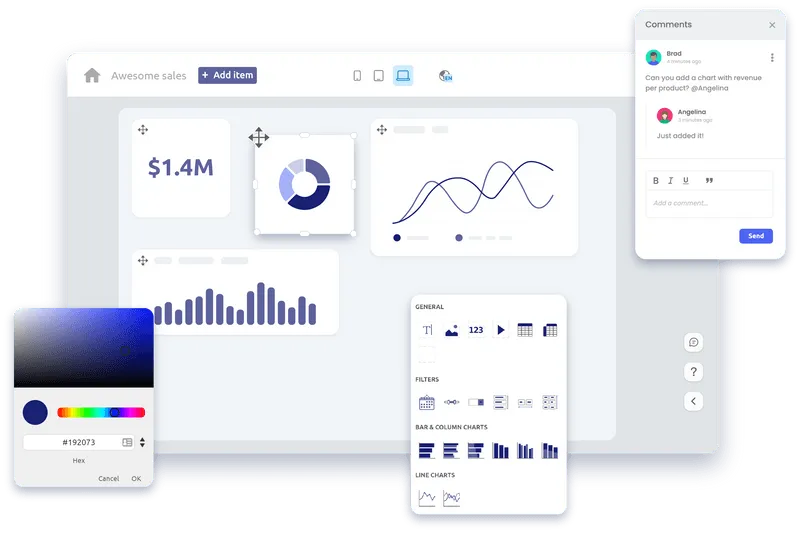
Luzmo
If you’re looking for advanced analytics and data visualization for SaaS, you just found it in one place. Luzmo is built specifically for SaaS and it blends right into your product as a functional dashboard for your customers.
It helps you collect your product data and using our advanced analytics API, it pulls that data and creates interactive, self-service dashboards for your business users. It’s easy to set up and thanks to highly customizable designs, it fits right into your product as a fully white-labeled solution.
And with data access at their fingertips, your customers can see the value of your product even more clearly.
Tableau
If you’re looking for an enterprise-grade solution for data analysis and data management, Tableau just might fit the bill. With its desktop and server tools, it allows for connecting a variety of data sources and doing real-time data discovery and visualization.
Its primary use cases are reporting and data analysis - if you want to use it for embedded analytics, you might find it cumbersome and expensive. However, its vast number of data sources and tight security make it a good choice for in-house data discovery. Another use case is as a project management tool, making it an alternative solution to Asana, for example.
Microsoft Power BI
It’s hard to mention Tableau without its nemesis and biggest competitor, Power BI. Microsoft’s tool helps with all stages of data analytics, including discovery, reporting, and visualization. It includes a wide range of tools for data insights, such as Power BI Desktop, Power BI Pro, Power BI Mobile, Power BI Embedded, and others.
Its strength lies in the variety of different visualizations, real-time analytics as well as Azure machine learning integration. However, its embedded function is pretty complicated to use compared to some other entries on the list.
Qlik Sense
If you like Tableau and Power BI but want something more cloud-based and powered by artificial intelligence, this is a great alternative. Use it for your big data analysis and smart visualizations that are on par with its pricier competitors.
Wrapping up
No matter what kind of business you run, data discovery is a smart move to get the most relevant data for your business in one place. With better control of your data, you can control your business outcomes, increase revenue and make your customers happier with your product or service.
And if you run a SaaS product, doing data discovery, analysis and visualization has never been easier. With Luzmo, you can create interactive embedded SaaS dashboards in hours, not weeks or months.
Grab your free trial to get started today!
Written by

Luzmo
Ship the future of your data
Let us show you what Luzmo can do for your product.

Leave your e-mail and one of our analytics experts will reach out to you