AWS Quicksight vs Tableau BI For SaaS Data Visualization [2026]
![AWS Quicksight vs Tableau BI For SaaS Data Visualization [2026]](/assets/migrated/42ea963a5d0152e7.webp)
Choosing the right business intelligence platform is fundamental for software companies. In 2023 many teams compared AWS QuickSight vs Tableau to power their dashboards.
Fast‑forward to 2026 and the landscape has changed: Amazon reimagined QuickSight as Amazon Quick Suite, an agentic AI workspace, while Tableau added generative AI skills through Tableau Next.
This article revisits the debate, describing both tools’ strengths and weaknesses for embedded analytics and business intelligence platforms, then introduces Luzmo as a modern alternative.
Throughout this discussion we refer to Amazon QuickSight and Tableau together because most evaluations pit these two business intelligence tools against each other.
We’ll examine how Amazon QuickSight and Tableau meet the needs of SaaS teams and discuss emerging agentic AI trends.
Why embedded business intelligence matters for SaaS
Embedded analytics gives your customers self‑service BI features like building charts or viewing interactive dashboards directly within your app. Whether you use Amazon QuickSight or Tableau, these data visualization tools let users explore their data without switching between tabs. When SaaS companies enable customers to perform data analysis and act on insights in one place, they reduce churn and boost engagement. Great dashboards also help attract new clients by showing off your data‑driven culture.
For embedded analytics to succeed, the underlying BI tool must handle your data sources, scale to thousands of users and integrate securely with your stack. AWS services such as Redshift, Athena, Amazon S3 and Amazon SageMaker make it easy to store and analyse data within the AWS ecosystem. Meanwhile, open tools like Tableau integrate with on‑prem databases, spreadsheets and third‑party apps.
Choosing the right platform depends on your use cases, development resources and pricing tolerance. Both Quick Suite and Tableau support data analytics tasks, from reporting on usage metrics to forecasting churn, helping customers uncover actionable insights.
Tableau: pros and cons
Tableau, now part of Salesforce, remains a leader among business intelligence tools like Power BI and Qlik. It offers an end-to-end pipeline: data preparation in Tableau Prep, modelling in Tableau Desktop and interactive charts in Tableau Cloud. The 2025 Tableau Next release added agentic features: MCP Server allows custom AI agents to run queries on governed semantic models, external embedding with SDK speeds up integration and customisation, and the Concierge assistant lets users ask natural language questions from within dashboards. New viz and dashboard enhancements let users perform ad‑hoc calculations and reposition widgets easily. These Tableau features make the platform more conversational and responsive.
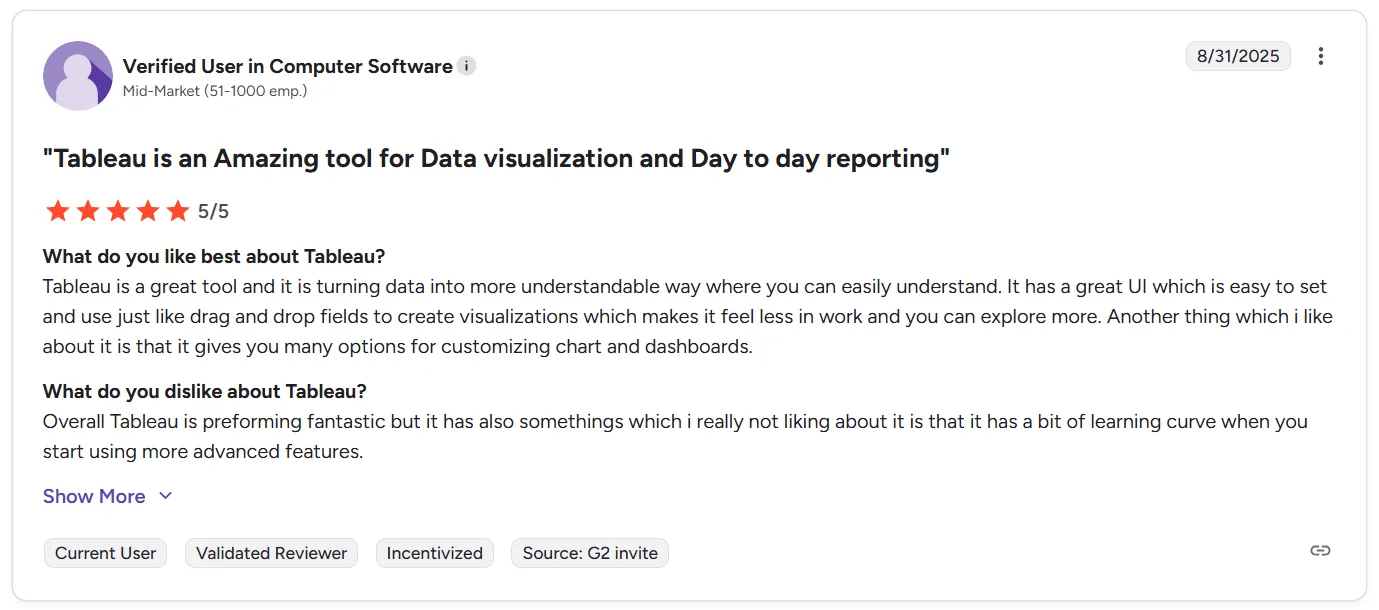
Tableau’s strength lies in its range of data sources and the richness of its data visualization. It connects to Excel, SQL databases, Salesforce, Snowflake and many other systems. Analysts can build a graph, map, gauge, tree map or custom visual with drag‑and‑drop. Tableau also handles advanced analytics: forecasting, clustering, trend lines and even machine learning integrations through Python and R scripts. However, this depth means there is a steep learning curve. Many new users find the interface less easy to understand than spreadsheets and require training to master calculations or SQL queries.
Embedding Tableau dashboards often involves juggling Tableau Server or Tableau Cloud tokens, understanding the AWS integration with Salesforce and managing caching - an obstacle for smaller teams. While Tableau boasts a huge community, the on-premise deployment path and licensing complexity make it harder to deploy quickly compared to cloud‑native rivals.
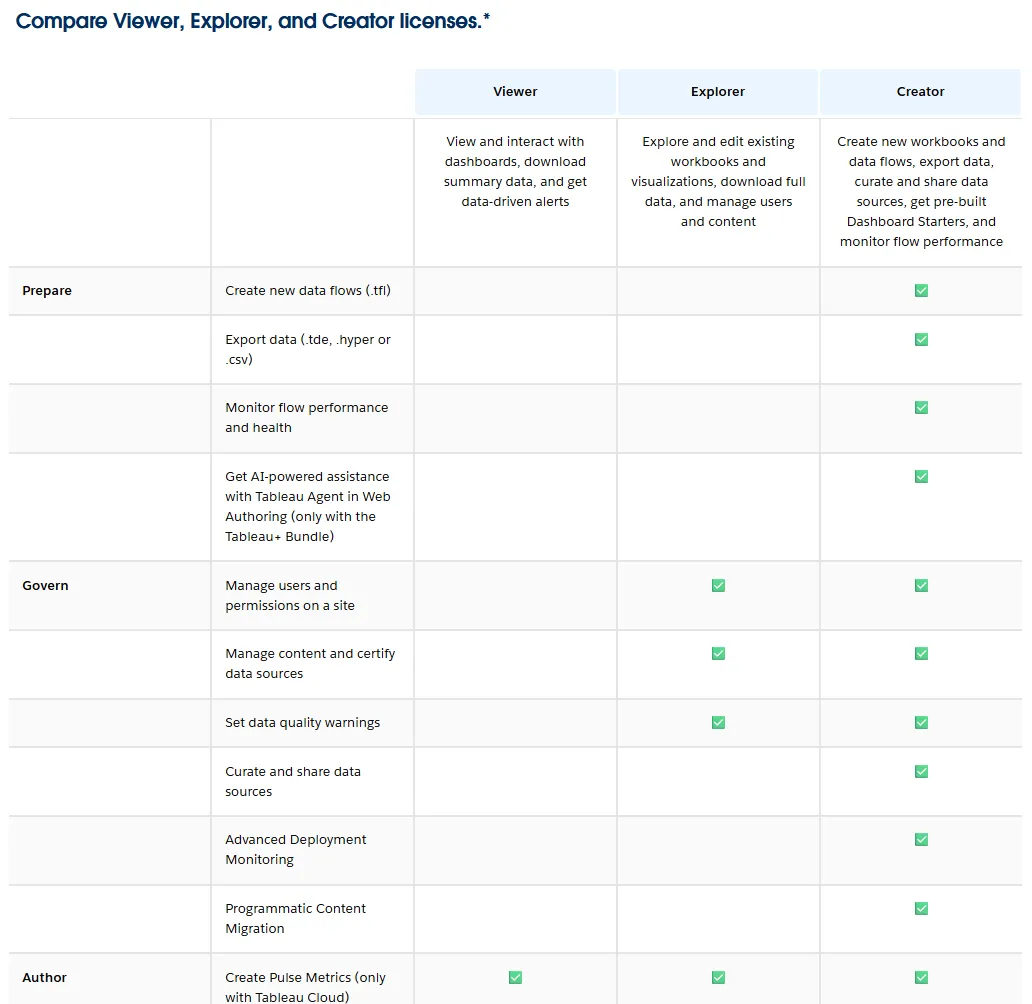
From a pricing perspective, Tableau uses a per user model. The Creator licence for Tableau Standard costs around $75 per user per month and includes Tableau Desktop, Prep, and Server access. Explorer licences cost about $42 per month for self‑service analysis, while Viewer licences are $15 for simple report consumption. The Enterprise tier bumps the creator price to $115 per month and adds advanced management. These figures apply to internal analytics - embedded analytics pricing remains opaque and often requires contacting sales. Tableau’s rigid pricing, combined with its complexity, may discourage smaller SaaS teams, even though analysts on Gartner Peer Insights praise its visual power as a popular BI tool.
Amazon Quick Suite and QuickSight: pros and cons
In October 2025, AWS unveiled Amazon Quick Suite, transforming the existing QuickSight service into an agentic AI workspace. This suite comprises five core components:
Quick Research conducts deep research across enterprise data and the public web, summarising findings with citations.
Quick Sight remains the BI pillar, delivering natural language dashboards and what‑if analysis.
Quick Flows automates routine workflows with plain‑English prompts.
Quick Automate orchestrates complex multi‑system processes and Quick Index provides a secure, searchable repository of documents and application data. Together these agents transform a BI tool into a BI solution that blends research, business insights and automation.
For existing AWS QuickSight customers, the transition is seamless: all dashboards and data connections migrate automatically. Quick Suite’s strengths include speed and scalability. Its data analysis capabilities are powered by Amazon’s in‑memory engine, which handles large and advanced data sets effortlessly. Quick Suite also integrates with more than 50 built‑in connectors (Adobe Analytics, SharePoint, Snowflake, Google Drive, OneDrive, Outlook, ServiceNow, Databricks, Amazon Redshift and Amazon S3) and uses OpenAPI and Model Context Protocol (MCP) to connect to over 1,000 third‑party apps. Because it runs entirely in the AWS cloud, it offers native connections to Athena, Redshift, S3 and even Amazon SageMaker for ML models. So teams heavily invested in AWS can manage everything within the AWS ecosystem and avoid data egress fees.
Quick Suite taps into many AWS data sources, from event logs to operational metrics, making it attractive for teams using AWS across their stack. For developers, Quick Suite includes natural language actions: you can ask the system to join datasets, filter by region or summarise a chart and it writes the query for you. According to Amazon, Quick Sight’s agentic experience analyses all forms of data (including documents and unstructured content) and returns narrative answers instantly.
Amazon QuickSight offers a unique blend of research, business intelligence and automation: the combination of Quick Research, Quick Flows and Quick Automate means you can go from question to workflow without switching products. In many use cases, for example, analysing marketing performance or summarising help‑desk tickets, this fusion of AI agents with BI dashboards helps reduce manual work.
QuickSuite also supports collaboration through Spaces, which let teams organise dashboards and files that can be shared with other users. Because it is fully cloud-based, there’s no infrastructure to manage. You simply choose your region and connect your data. AWS emphasises that Quick Suite’s architecture has enterprise‑grade security and each customer’s queries are private and not used to train models.
Quicksight excels at certain tasks: it delivers dashboards quickly, scales easily to thousands of AWS users, and QuickSight integrates seamlessly with other AWS services. Reviewers note its UI is more streamlined than some BI services, making it easy to understand for non‑technical staff.
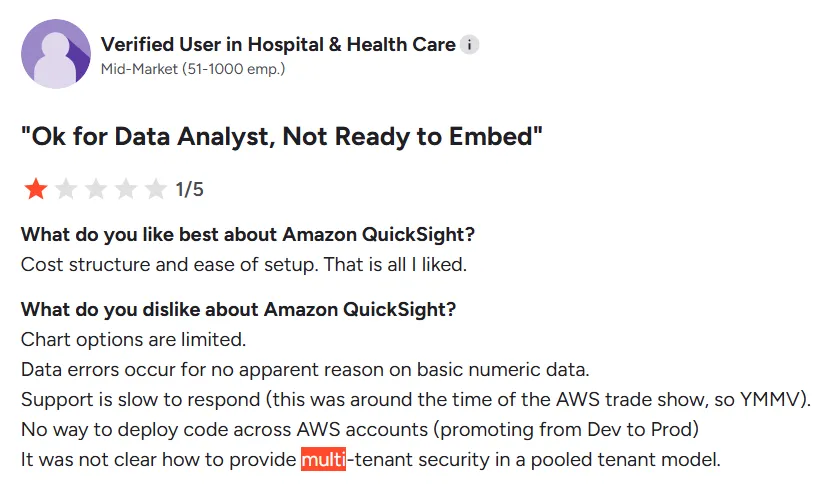
However, Quick Sight still falls short for teams that need sophisticated charts. Although Amazon recently expanded chart types, it lacks some complex visuals (such as Gantt or bullet charts) and the formatting options are limited.
Customising a data visualisation to match your brand is still difficult. Users have reported challenges with multi-tenant security and row‑level permissions, requiring workarounds for embedded deployments.
While you can embed dashboards, the experience may involve more code than expected, and some users note that Quicksight’s credit system for sessions and reader licences can be confusing. In short, Quick Suite is ideal if your organisation is heavily invested in AWS and you prioritise speed, scalability and automation over custom visuals.
For product teams using AWS, this means that Quicksight is ideal when you need to spin up simple dashboards quickly without worrying about infrastructure or vendor lock‑in.
Pricing and licensing comparison
Quick Suite uses a consumption-plus-subscription pricing model through Amazon Quick Suite and QuickSight. You can choose between Reader, Author, Author Pro, and Reader Capacity pricing. The core per-user options start at $3 per user/month for Reader and $24 per user/month for Author. Author Pro costs $40 per user/month, unlocking generative dashboards, Amazon Q Topics, scenarios, and executive summaries, while Reader Pro is $20 per user/month, adding AI-powered summaries and data stories.
Capacity pricing lets you buy bulk Reader sessions (e.g., 50,000/year for $20,000 + $0.40 per extra session) or Amazon Q question capacity (e.g., 60,000/year for $18,000 + $0.30 per extra question). A $250/month infrastructure fee applies to accounts with at least one Pro user and Q&A enabled via Topics or dashboard Q&A, and storage or evaluation add-ons may incur extra costs. New customers receive a 30-day free trial for up to 25 users. This structure provides flexibility but makes budgeting tricky: you must estimate how many sessions, questions, workflows, and research hours you’ll consume.
Compared with Quick Suite, Tableau’s licensing is easier to grasp at first glance. Its pricing model is based on seat types: Creator, Explorer and Viewer. It includes desktop software plus cloud access. However, Tableau’s embedded analytics pricing is not published; you must contact sales for a custom quote. This makes Quick Suite appear more transparent, though you still need to calculate your workloads to avoid surprises. When evaluating Quicksight pricing, consider how often customers will view dashboards (reader sessions) and how many authors you need.
Amazon QuickSight vs Tableau: which is better for SaaS?
Deciding between Amazon QuickSight vs Tableau depends on your priorities.
Tableau offers unmatched customisation, data analysis depth and a broad community of developers. It excels at complex calculations, multi‑sheet stories and ad hoc exploration. If complexity of your data demands sophisticated charts and you have the resources to manage Tableau Server and write calculations, then Tableau might be your best choice. On the downside, its large footprint, steep learning curve and uncertain embedded pricing may slow down deployment.
Quick Suite is perfect for organisations that need to deploy analytics quickly and operate mainly inside Amazon Web Services. It handles large datasets natively, integrates with other AWS services and automates workflows through natural language. In other words, Quick Suite excels at ease of deployment and scale. It is particularly attractive if you want to embed dashboards into a product used by thousands of AWS users and you want to stay within the AWS ecosystem. Its agentic features let you go from question to action without switching tools. However, Quick Suite’s chart library is narrower, and customisation remains limited. For companies with heavy branding requirements or advanced charting needs, the tool can feel constraining.
What about hybrid scenarios? Some teams integrate Tableau for internal reporting and Quick Suite for customer‑facing dashboards. This approach takes advantage of each tool’s strengths. If your data already lives in Redshift, Athena or S3, Quick Suite saves you the hassle of moving data. If you rely on other databases or want to create custom visuals, Tableau may be better suited. For deployments outside AWS, say on Azure or Google Cloud, or if you need offline access via Tableau Reader, Tableau offers more flexibility. Both tools integrate with third-party services. However, Quick Suite’s integration via MCP means automation flows can trigger actions across tools like Jira or Slack with minimal code.
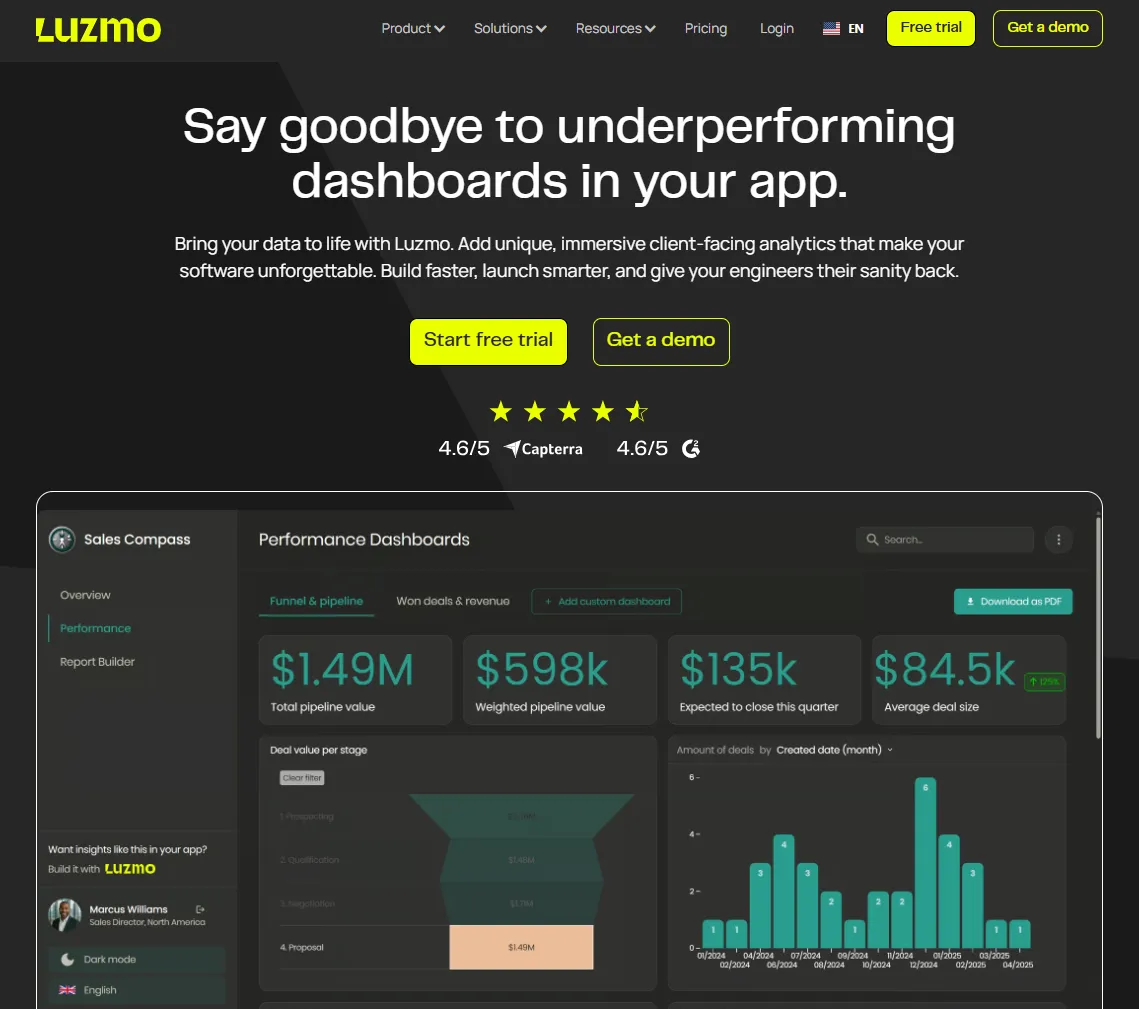
A modern alternative: Luzmo
If neither Tableau nor Quick Suite fully meets your needs, consider Luzmo. Our platform was purpose‑built for embedded analytics and balances ease of use with robust features.
Luzmo Studio provides a drag-and-drop builder with more than 40 chart types and support for real‑time updates, drill‑downs and cross‑filtering. You can embed Studio into your SaaS app and customise the look with CSS injection and white‑labelling. Studio handles multi‑currency, multi‑language and multi‑timezone displays, so you can present a range of data in the right format for any audience.
For developers who need complete control, the Luzmo Flex SDK lets you build custom dashboards programmatically. You can combine our charts with your own React or Vue components, create AI chart generators and support complex report builders. Flex automates queries and caching behind the scenes and scales effortlessly as your user base grows. This approach lets you tailor analytics to the complexity of your data without replicating Quick Suite’s limitations or Tableau’s overhead.
Luzmo IQ brings conversational analytics to your product. End‑users can ask natural language questions and receive concise answers backed by charts. Features like an embeddable chat widget, AI‑generated executive summary and AI search results appear directly in your app. Luzmo IQ integrates with Slack and other tools via a Workflows API, so answers can trigger actions such as creating tickets or sending notifications. Our platform creates vector embeddings on the fly and enforces row‑level access control, ensuring security and speed.
Finally, Luzmo Agentic APIs offer modular AI capabilities similar to Quick Suite’s agents. Endpoints can describe datasets or columns, perform semantic search, generate formulas and charts, and support chat interactions. You can chain these agents (search data, craft a calculation and render a chart) into one workflow. Recent updates improved performance and added automatic vector embeddings, with predictive capabilities on the roadmap.
Together, Studio, Flex, IQ and Agentic APIs give you a comprehensive set of features that handle both simple and advanced scenarios without the need to be tied to AWS or Salesforce licensing.
Luzmo’s pricing is designed to be predictable and scalable for SaaS teams, unlike the consumption-based model of Quick Suite or the per-user licensing of Tableau. Plans start at €495/month for Starter and €1,995/month for Premium, with Enterprise options available for larger deployments. Combined with Luzmo Studio for dashboard creation, Luzmo IQ for natural-language analytics, and Luzmo AI for instant chart and insight generation, this allows teams to embed analytics without worrying about usage spikes or growing per-seat costs.
Conclusion
Both Tableau and Quick Suite have made strides since 2023. Tableau user experiences have improved with agentic analytics and new embedding SDKs, while Quick Suite has redefined Amazon QuickSight features with AI research, flows and automation. When debating QuickSight or Tableau, consider your priorities. Custom visuals, cross‑platform flexibility and community support lean toward Tableau. Speed, ease of use, and native AWS integration point to Quick Suite. Evaluate how the tools will handle your database, dashboards and the range of data sources you need to support.
And if you’d like a solution that combines intuitive design, rich charts, AI chat and developer flexibility without vendor lock‑in, explore Luzmo. It’s built for SaaS teams that want to optimize your BI and deliver insights quickly, no matter the complexity of your data. Try it for free now.
Whatever you choose, focus on delivering value to your customers and empowering them to make data‑driven decisions.
Written by

Ship the future of your data
Let us show you what Luzmo can do for your product.

Leave your e-mail and one of our analytics experts will reach out to you