What Are Actionable Insights and Why Are They Important?

The average company now uses over 100 SaaS tools to run its operations, with large enterprises managing hundreds across different teams. With so many different apps, there is a wealth of information and data points at our fingertips. And still, many businesses are struggling to make sense of their data. The reason is simple: they have just that, but not actionable insights.
In order to become data-driven, companies today have one important task: figuring out which data is important and using that data for decision making. In other words, determining which data can bring them actionable insights.
Today, we’re showing you what actionable insights are and how you can use them to improve every area of your business.
What are actionable insights?
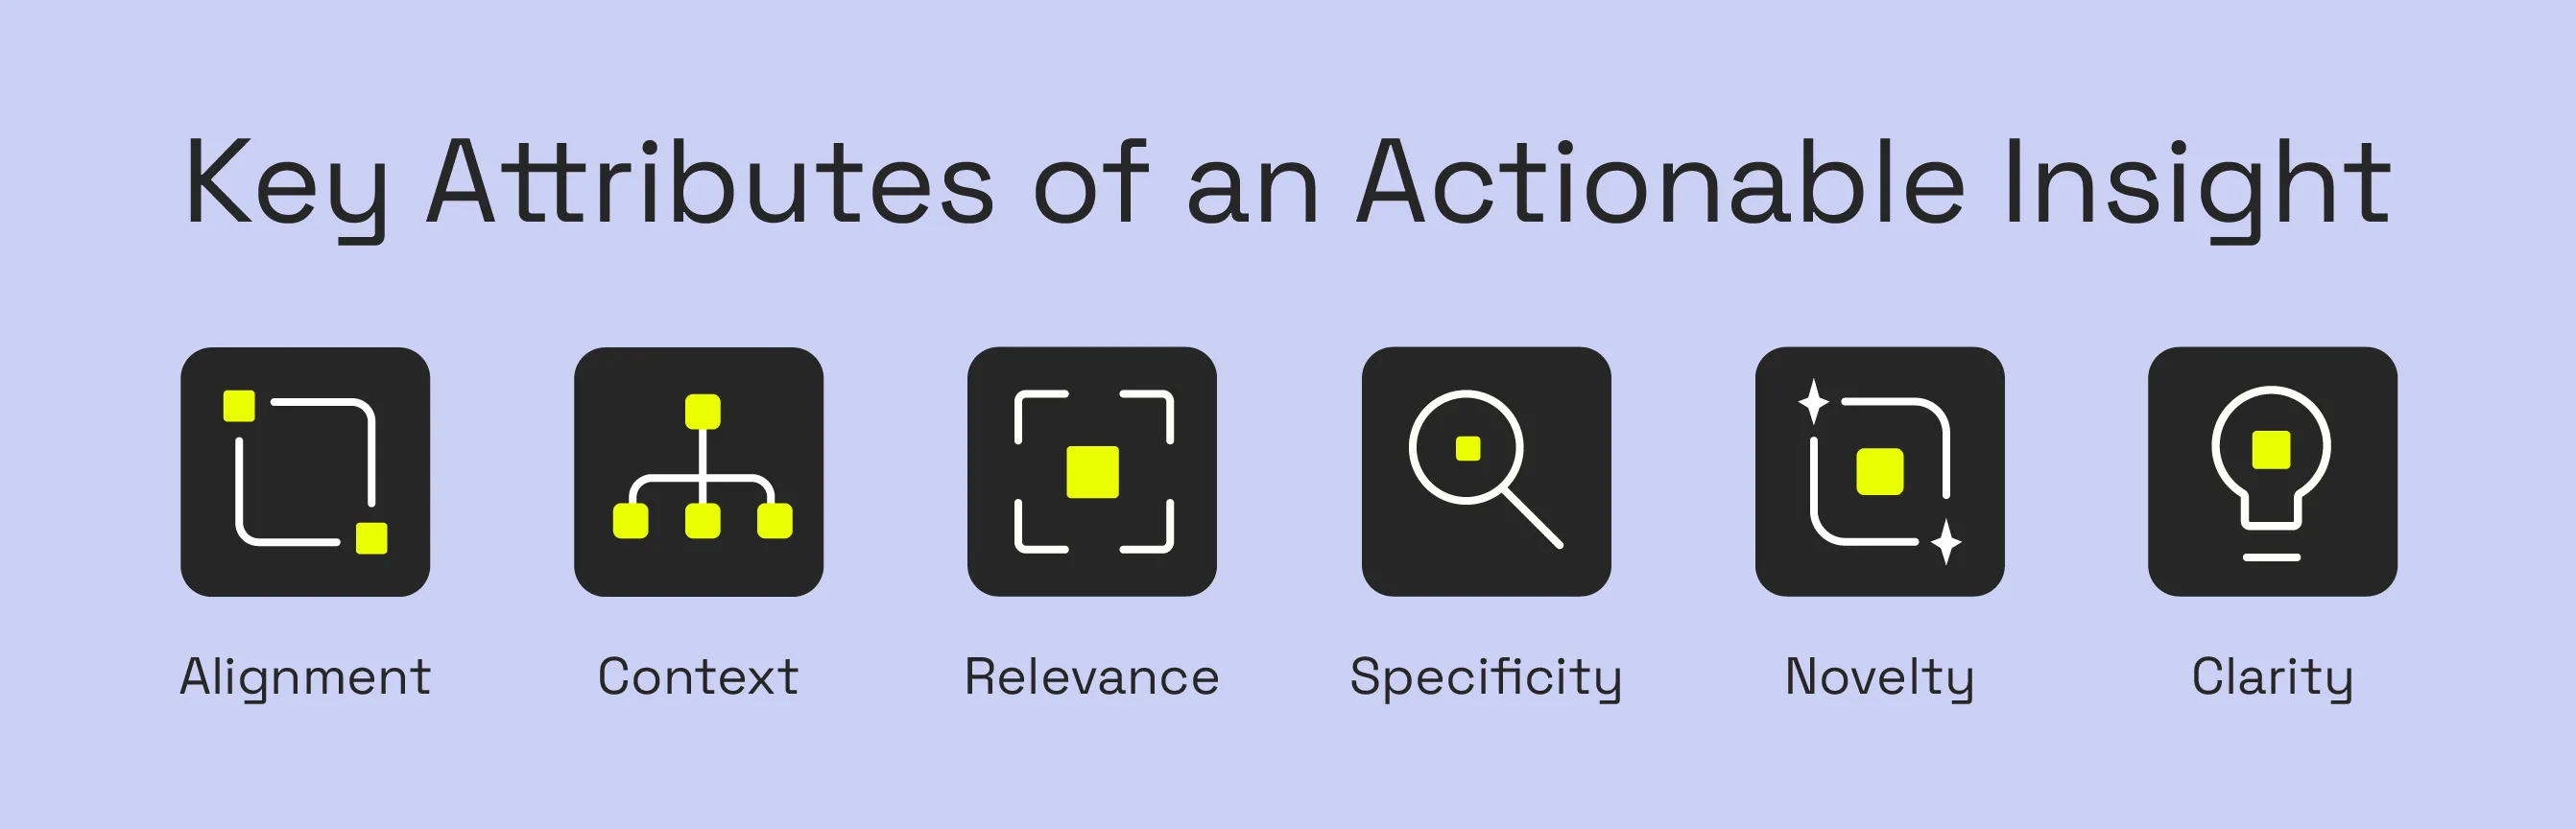
Actionable insights are findings that you get after analyzing your data. With actionable insights, you find out:
- What you need to do
- How to think of an issue
- What to stop doing
- Where (not) to invest time and money
- Which customers are valuable
- And many other insights
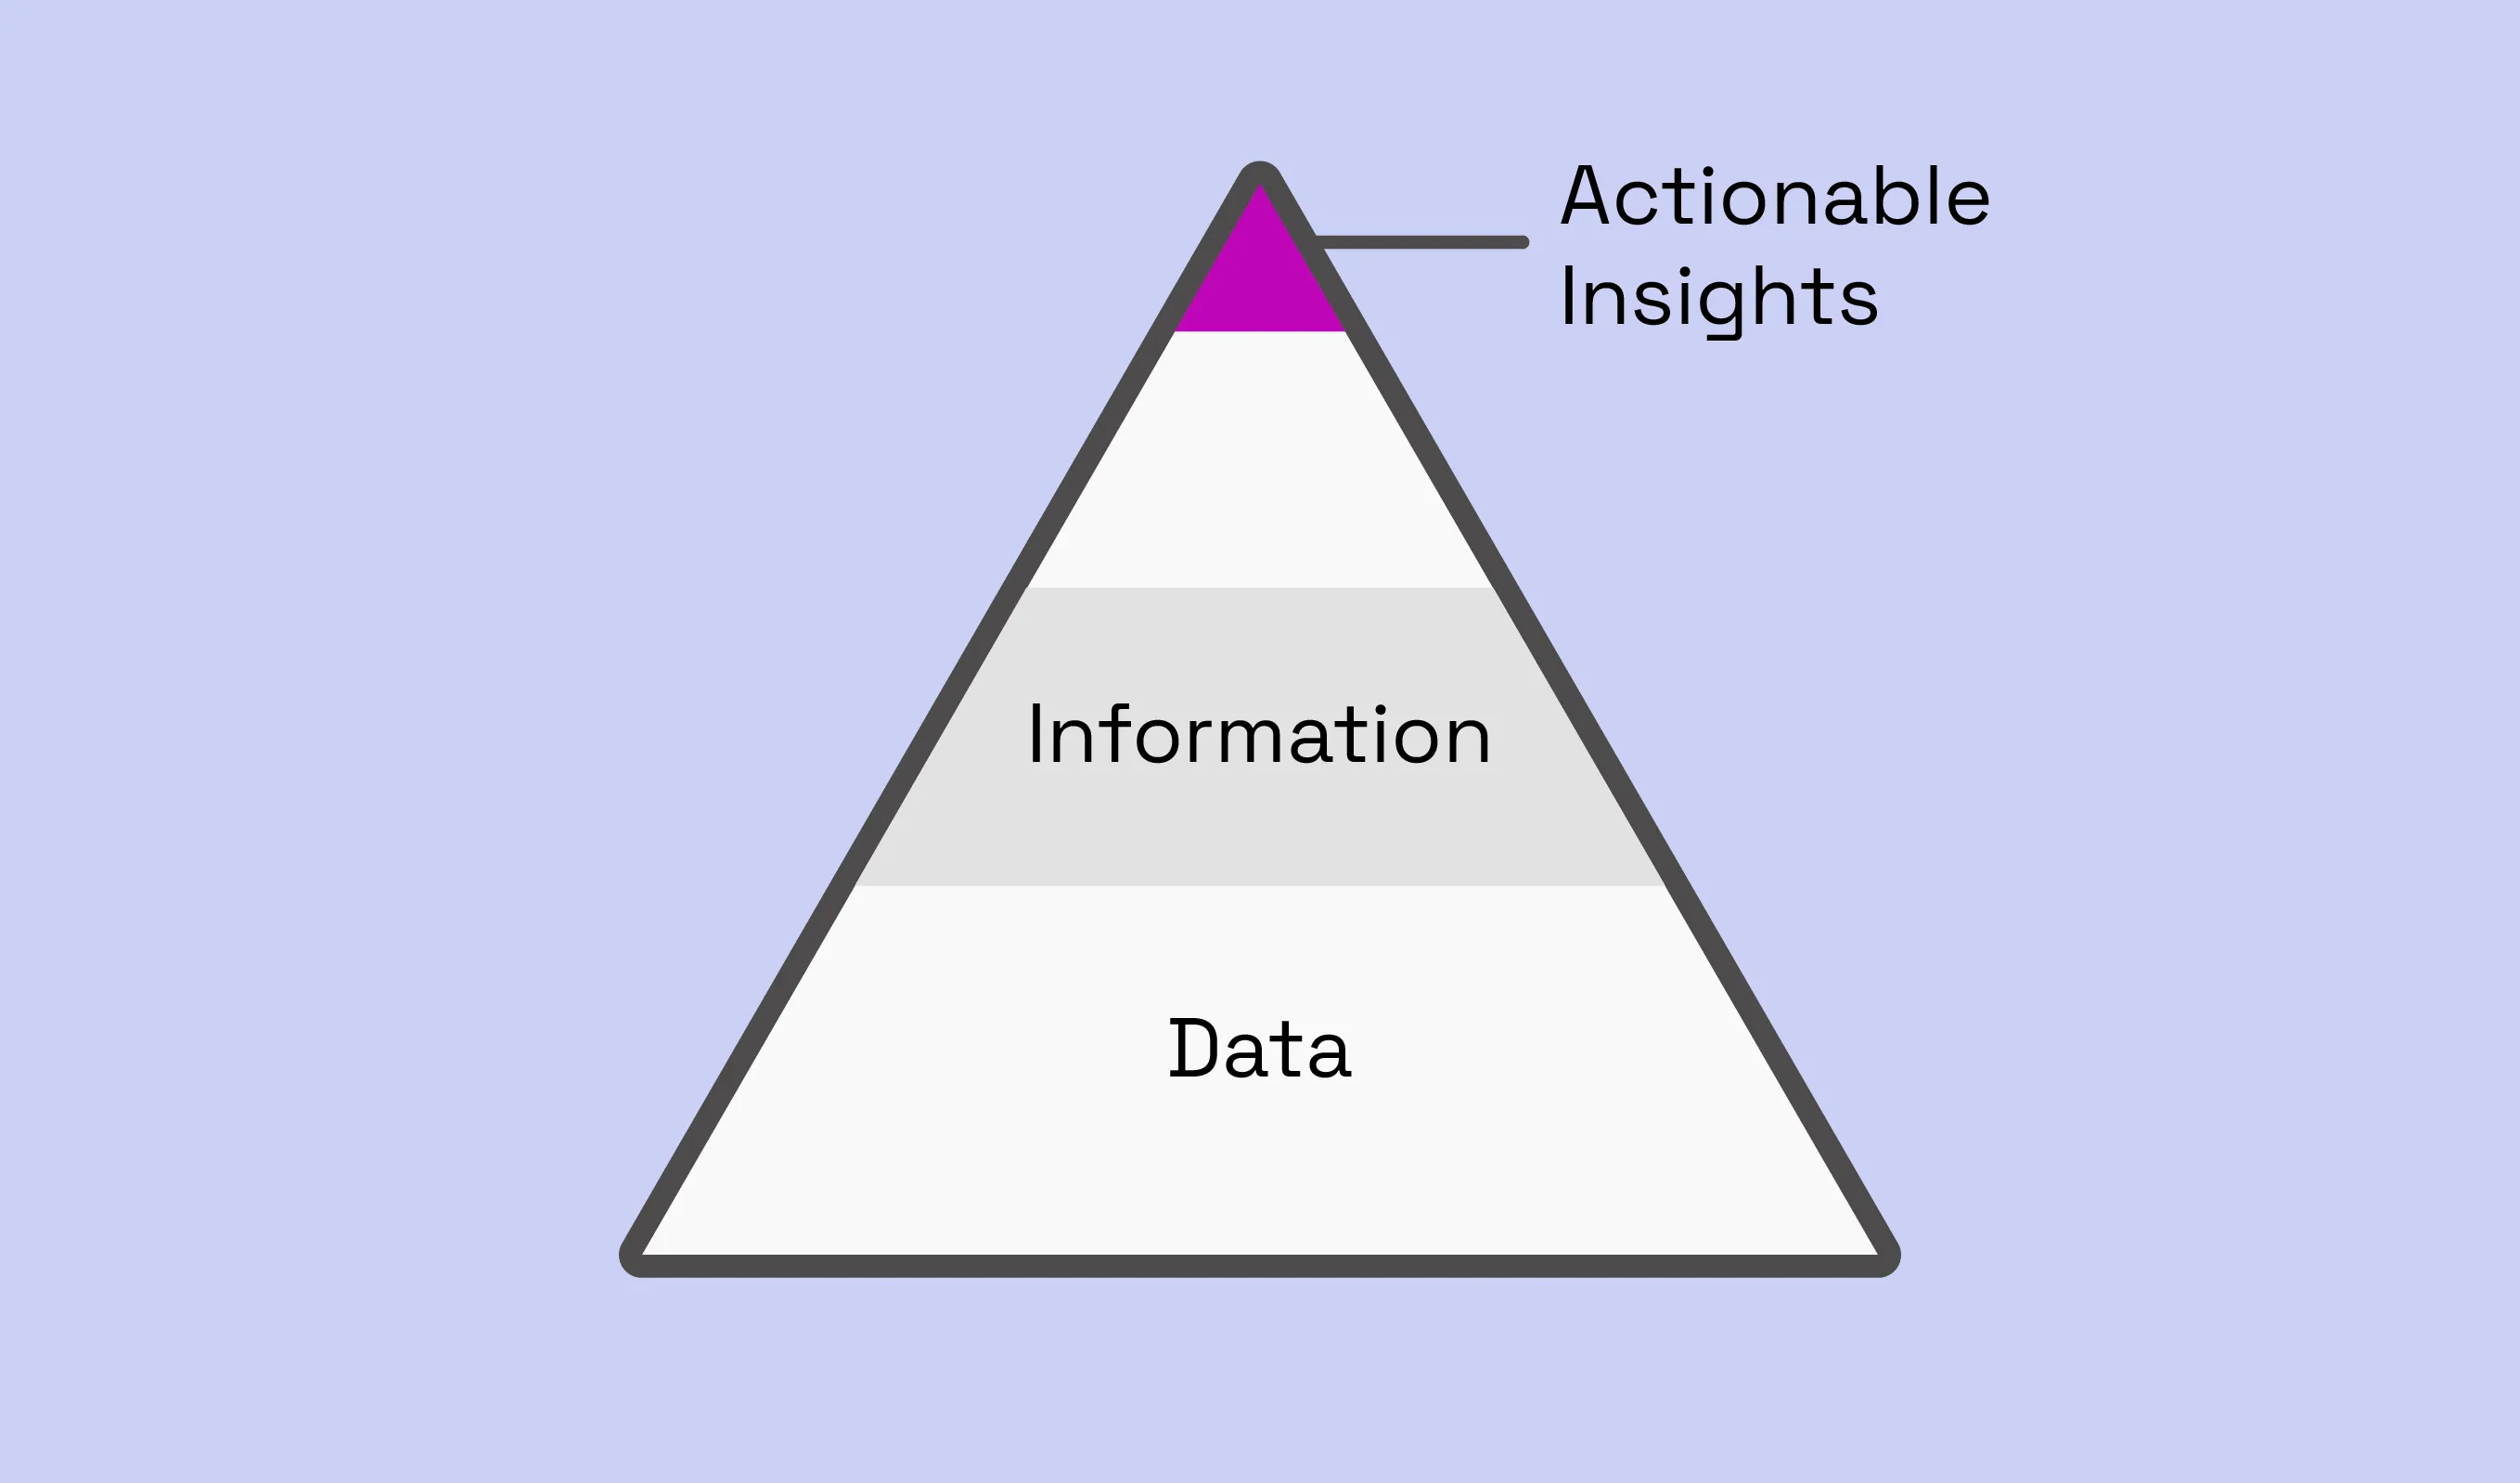
The key difference between actionable insights and raw, unfiltered data is in the word “actionable”. These insights let you make decisions and take action immediately. On the other hand, raw data and bare metrics only seem actionable, but often leave you wondering what to do next.
Why are actionable insights important?
Many businesses thinks that relying on big data and amassing more data is good. However, having data on its own is like having a list of ingredients and expecting a cake to magically appear out of nowhere. Actionable insights are the recipe you need to go from ingredients to a delicious cake.
You can make better decisions
By connecting the dots between your data points, you can make smarter decisions for your product and business. For example, you can use analytics tools and find out that your highest paying customers all use the same features in your app.
These are actionable insights as you’ll know that you need to invest more time and money into these features, as opposed to building out something entirely new.
You can beat the competition
Instead of spying on the competition and doing extensive research, become better by getting insights from your customers. For example, you can try and copy the pricing strategies from your competitor or just get data-backed insights from your own customers about how much they’re willing to pay for a product or service.
You can become more efficient
One of our customers, Zapfloor, has a SaaS for workspace management. This is an app that lets workspace owners rent out and sublease the space they are not using. Within the app, customers can learn how much of their space is being rented out, when, and at what cost.
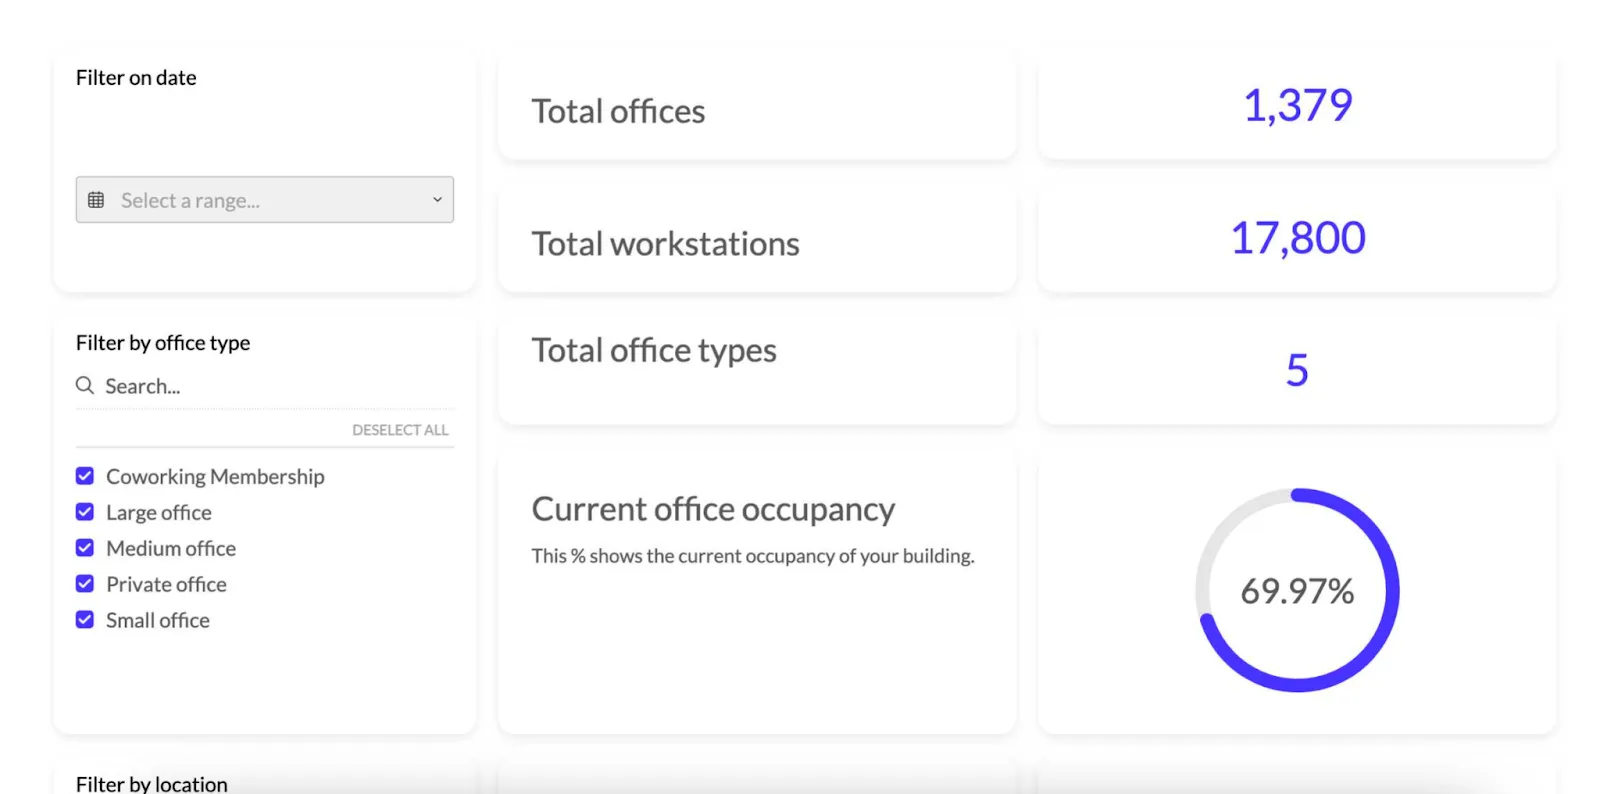
This means they can learn which spaces bring in the most profit and when they have the highest occupancy. So, if they want to buy more office space for leasing, they’ll know which spaces can yield the best return on investment. Thanks to data analysis, they can turn a bigger profit.
You can understand your customers better
With actionable data, you get to familiarize yourself with your customers. What they do with your product, which aspects of it they use the most, what they find the least valuable, etc. Utilizing usability testing tools can enhance this insight by providing detailed analytics on user interactions and feedback. Armed with this data, you can launch new features, fix existing ones, look into possible UX/UI issues and overall, improve customer satisfaction.
The difference between non-actionable and actionable insights
Okay, we’ve explained the massive benefits and the business value of actionable insights. But how about the difference between these insights and unactionable data?
Unactionable data: you find out that you have 10,000 app users, 30% of whom are daily active users.
Actionable data: you have 10,000 app users, 30% of whom are active daily and they use a set of three features heavily. The remaining 70% barely use the features mentioned by the first group.
The actionable data is meaningful because it drives action. By implementing better onboarding and user activation, you can drive more users toward your most useful features.
Actionable insights are usually derived from careful data collection and analysis and they help make a more data-driven decision that has an impact.
How to get actionable insights?
The difference between regular customer insights and actionable insights is not just in the quality of data. It’s also where that data comes from. Here are some places where you can get great insights.
Take your data and visualize it
The decision makers in your business don’t have time to analyze each data set, one by one. And even if they had the time, raw numbers speak very little. Instead, visualize your data to get the most impact. This is by far the easiest way to turn numbers into actionable insights that drive action.
For example, you can get an embedded dashboard for your product and visualize your most important metrics and KPIs, and see how they relate to your business goals. Doing this is a matter of hours with Luzmo, as opposed to building dashboards from scratch, which can take weeks and months at a time.
The visualizations are interactive, which allows stakeholders to change different elements and unearth the data they need. For example, they can change dates to reveal data pertaining to certain weeks or months or dial into a specific set of users.
You can also get notified once you hit a certain threshold. If you have a SaaS dashboard, for example, you can set up a notification once you hit a certain percentage of churn.
There are also tooltips and guides for everything in the dashboard, from graphs to charts. Unlike raw numbers that don’t tell a story, tooltips can explain the “why” behind each piece of visualization<.
With Luzmo Studio, teams can design fully customizable dashboards and visualizations that integrate seamlessly into their SaaS products. Luzmo IQ allows users to explore data through AI-powered insights and natural language queries, making it easier to uncover patterns and trends. Meanwhile, Luzmo AI enables intelligent data exploration directly inside your application, helping users ask questions and generate insights instantly. Together, these tools allow businesses to transform raw data into actionable insights without spending months building analytics infrastructure from scratch.
Run customer surveys
When asked at the right time and in front of the right audience, surveys are a goldmine of data. Here are some typical surveys you can run:
- NPS (Net Promoter Score) survey
- CSAT (customer satisfaction) survey
- CES (Customer Effort Score) survey
An NPS survey can help you get an overall feel for what your customers think about your product through the NPS score. CSAT can show you how satisfied they are with the entire product or certain aspects of it, while CES surveys measure the effort someone needs to perform a specific activity.
As they provide quantitative data, surveys are a great starting point for running data analytics and capturing customer feedback.
Read user reviews
If you want to learn about customer experience, there are few places better than user review websites. In the software arena, these are places such as G2, Capterra, GetApp and others. Keep a constant lookout at these platforms to see the kind of reviews that are coming in, for a good mix of qualitative and quantitative insights.
Do user testing
To get insights about how your product is being used, you can start with Google Analytics data, but that won’t give you much except the very basics. To go one step further, try out user testing platforms where real people (close to your target audience) get a chance to test out your product and give feedback.
Monitor what people say about you
You don’t need machine learning to figure out what people are saying about your brand or your competition. Simply grab one of the brand monitoring or brand protection tools and flag a certain term, such as your business name or product category. Every time someone mentions you online (social media, news, blogs), you’ll get a notification about it, in real time.
Most modern brand monitoring tools come with sentiment analysis too - they recognize whether the person writing is feeling positive, negative, or neutral about your brand. That way, you can get a mix of qualitative and quantitative feedback at once.
Wrapping up
Actionable insights are the missing link between raw data and actions. And if you’re tired of staring at spreadsheets and infinite rows of numbers, actionable insights are going to make a massive difference for your business.
What better way to get there than by using data visualizations? With Luzmo, you can create a dashboard and add it to your product in the same time in less than one workday. We’ll help you set it up, and the trial is completely free. You have nothing to lose and precious information to gain.
FAQ
All your questions answered.
What is the difference between data and actionable insights?
Data consists of raw numbers and metrics that describe what is happening in your business. Actionable insights go one step further by explaining what those numbers mean and what actions you should take. They connect multiple data points and provide clear direction for decision-making.
How do companies turn raw data into actionable insights?
Businesses typically analyze and visualize their data using analytics tools and dashboards. By identifying patterns, trends, and relationships between metrics, teams can uncover insights that guide product development, marketing strategies, and operational improvements. Visualization plays a key role because it makes complex data easier to interpret.
What types of data sources can generate actionable insights?
Actionable insights can come from multiple sources such as product analytics, customer surveys, user reviews, customer support interactions, and usage data. Combining quantitative metrics with qualitative feedback often provides the most useful insights. This allows companies to understand both what users do and why they do it.
Written by

Ship the future of your data
Let us show you what Luzmo can do for your product.

Leave your e-mail and one of our analytics experts will reach out to you