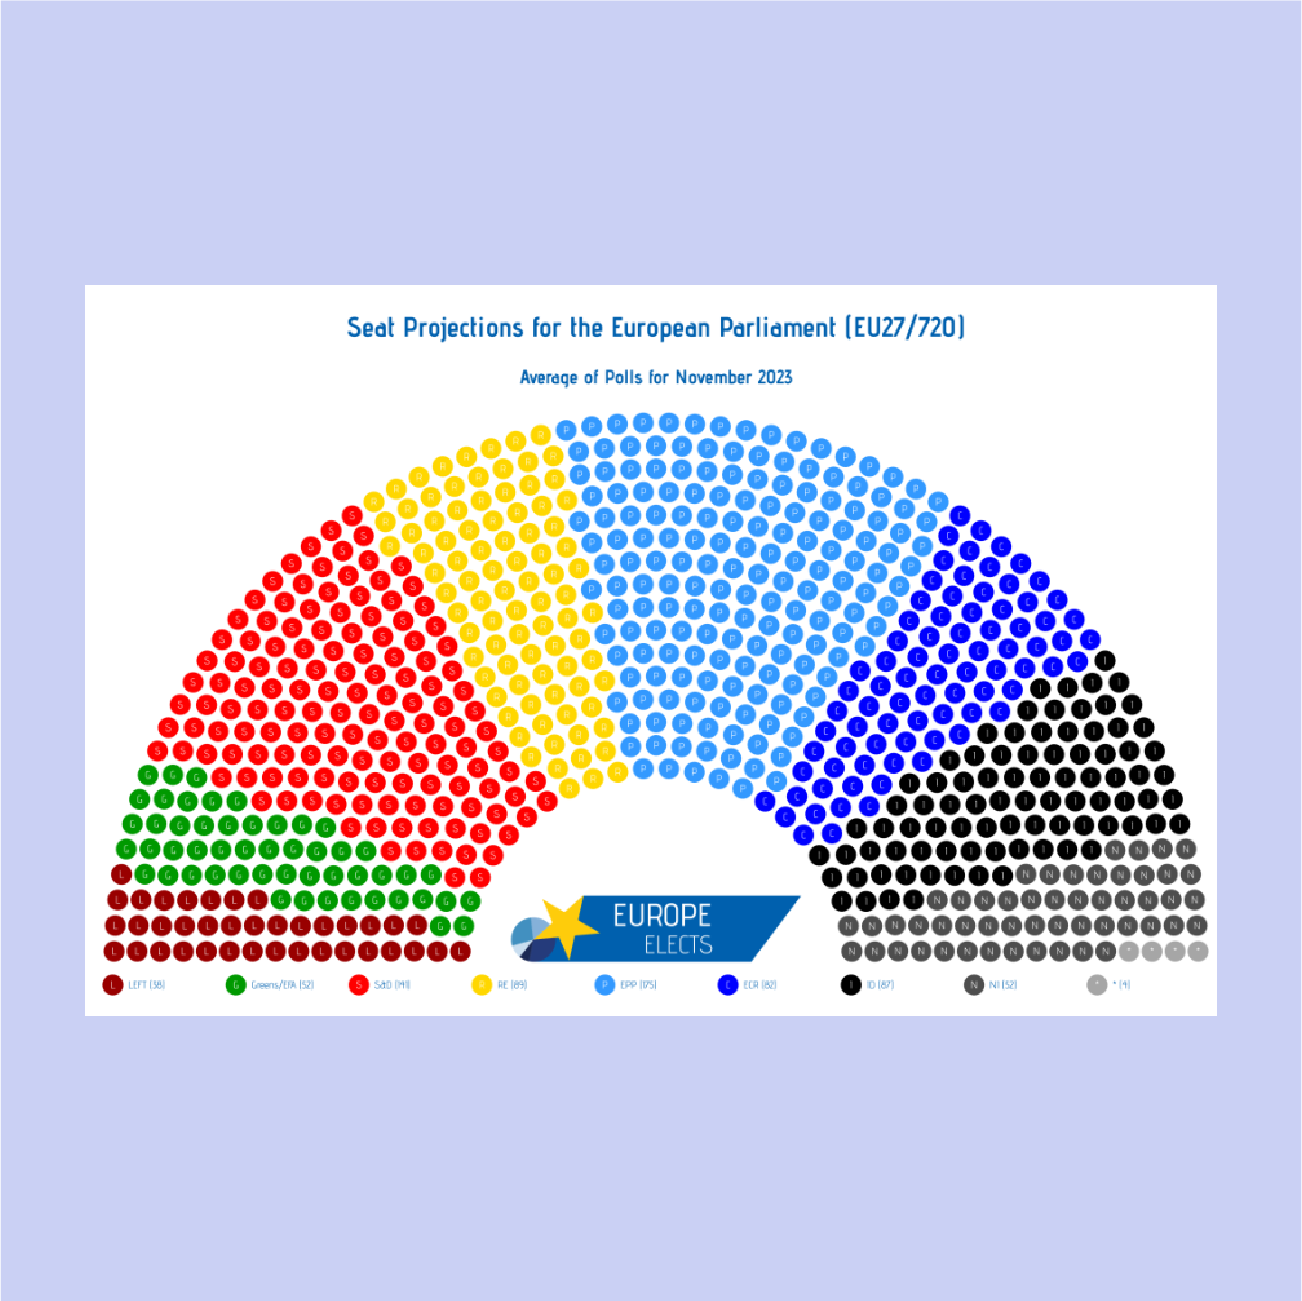
A chart you wish existed? Now it's here. With Luzmo's custom charts, you can build even the craziest visuals in days, not months. See below, step by step:

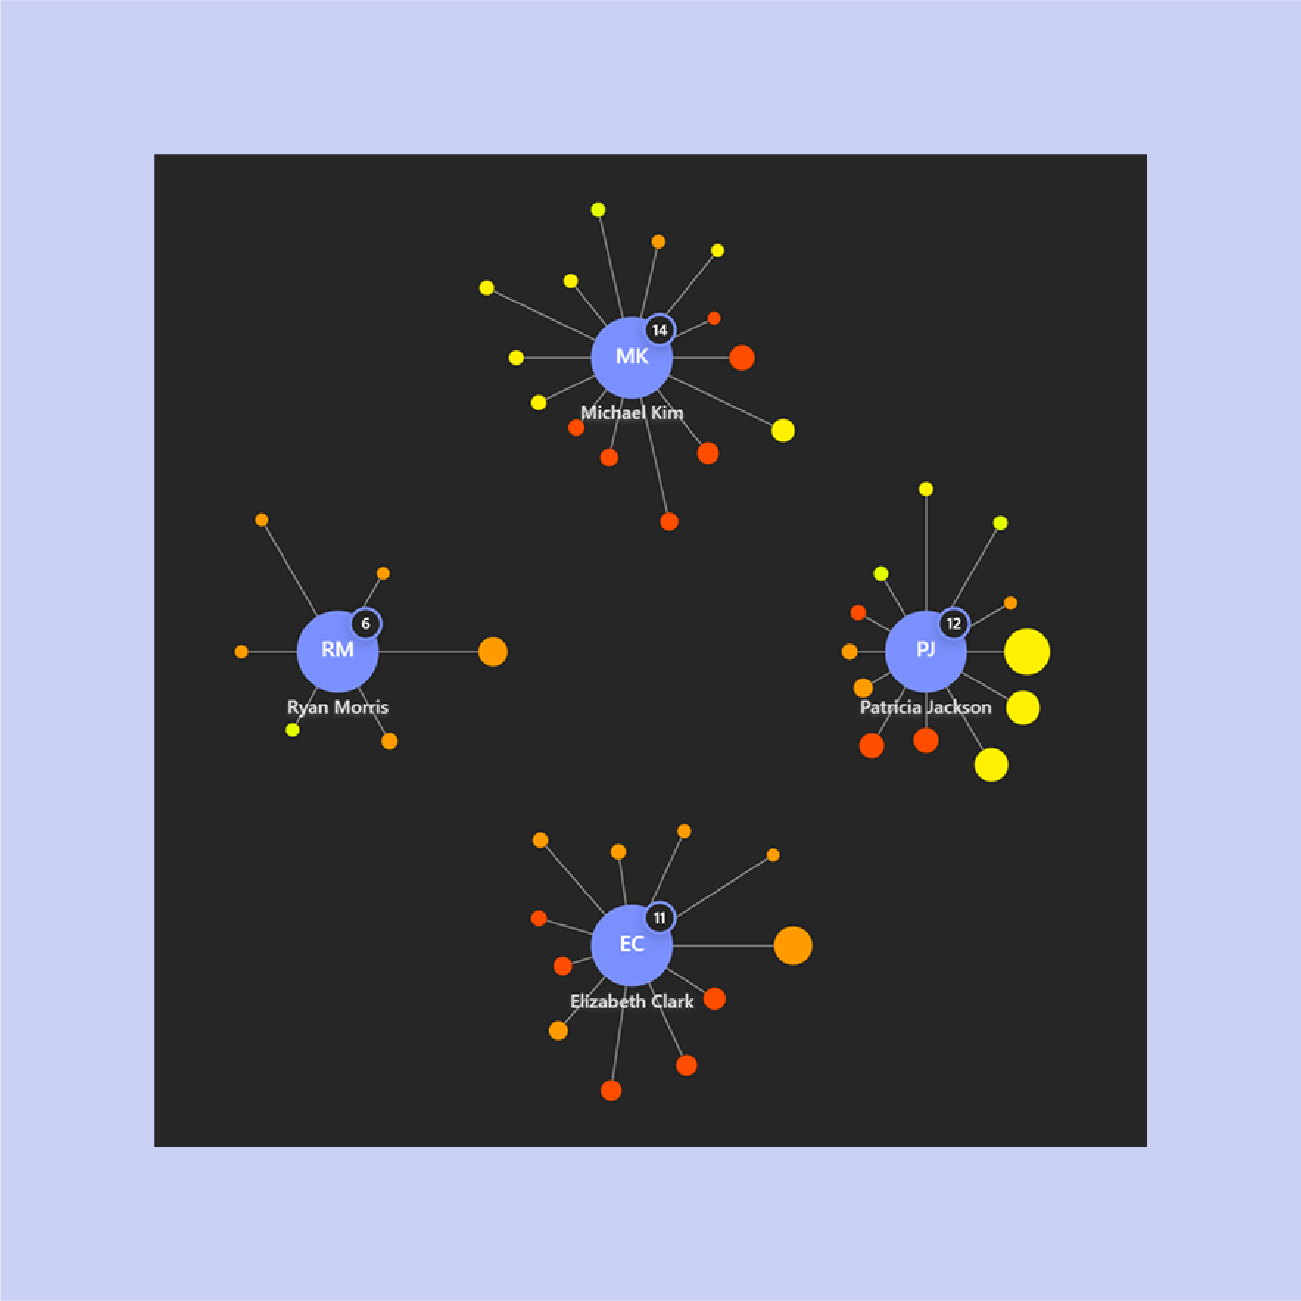
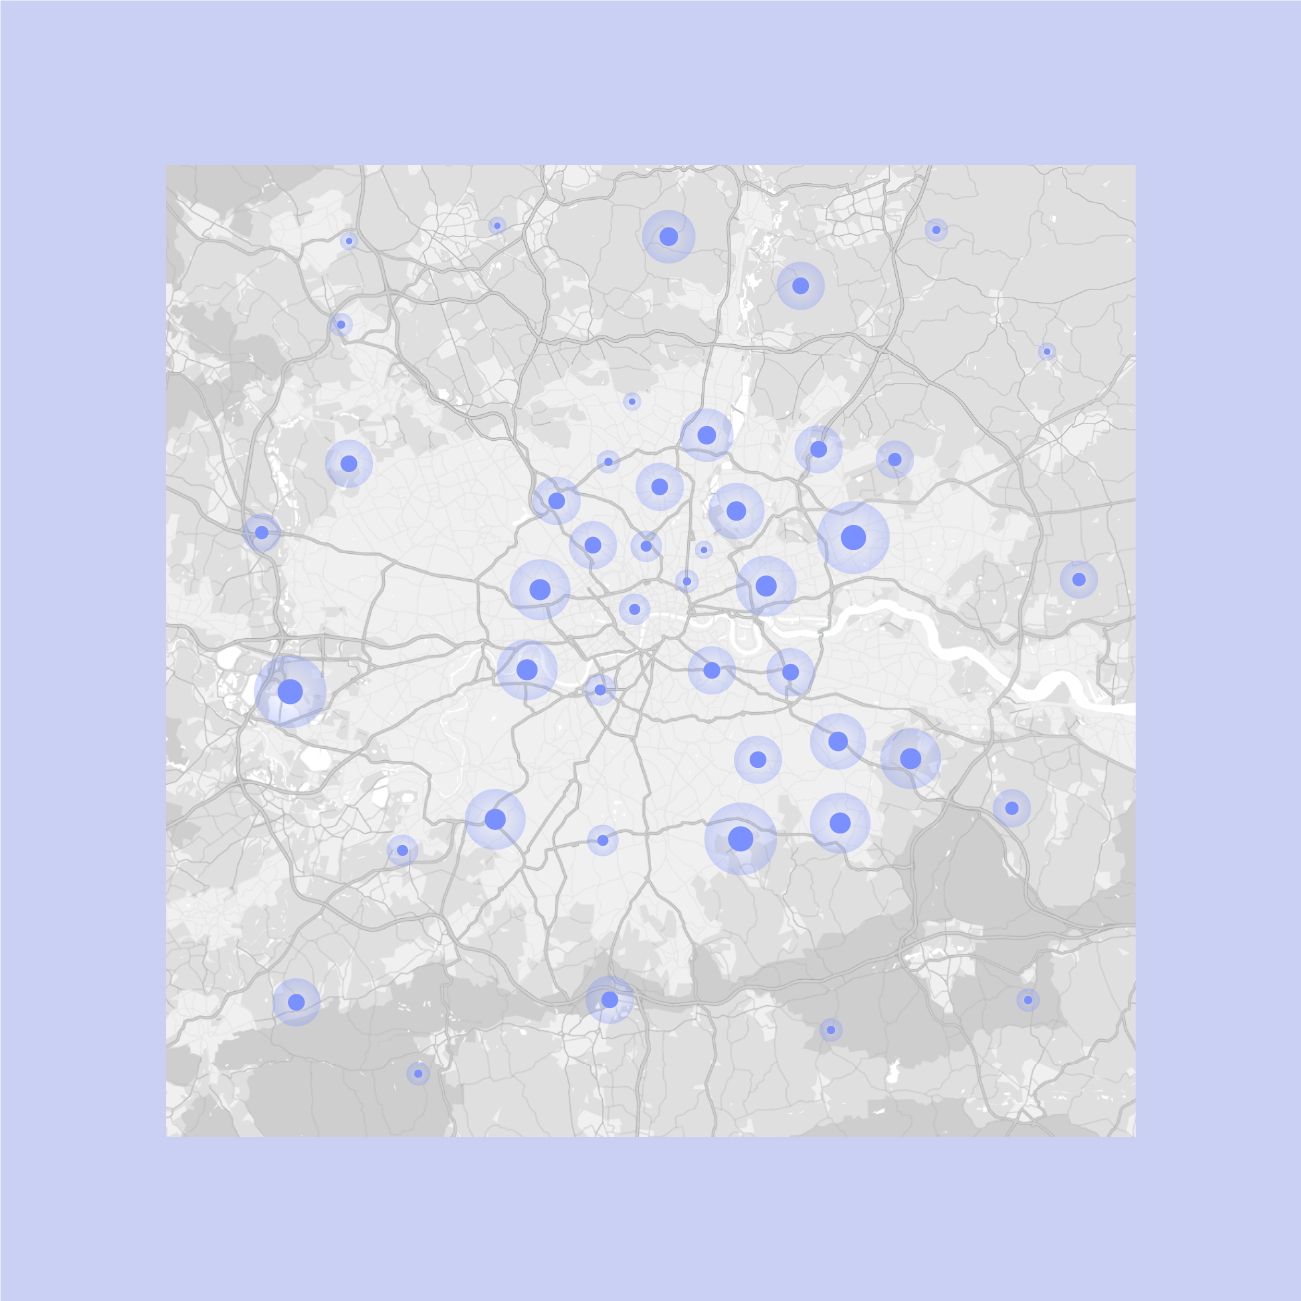

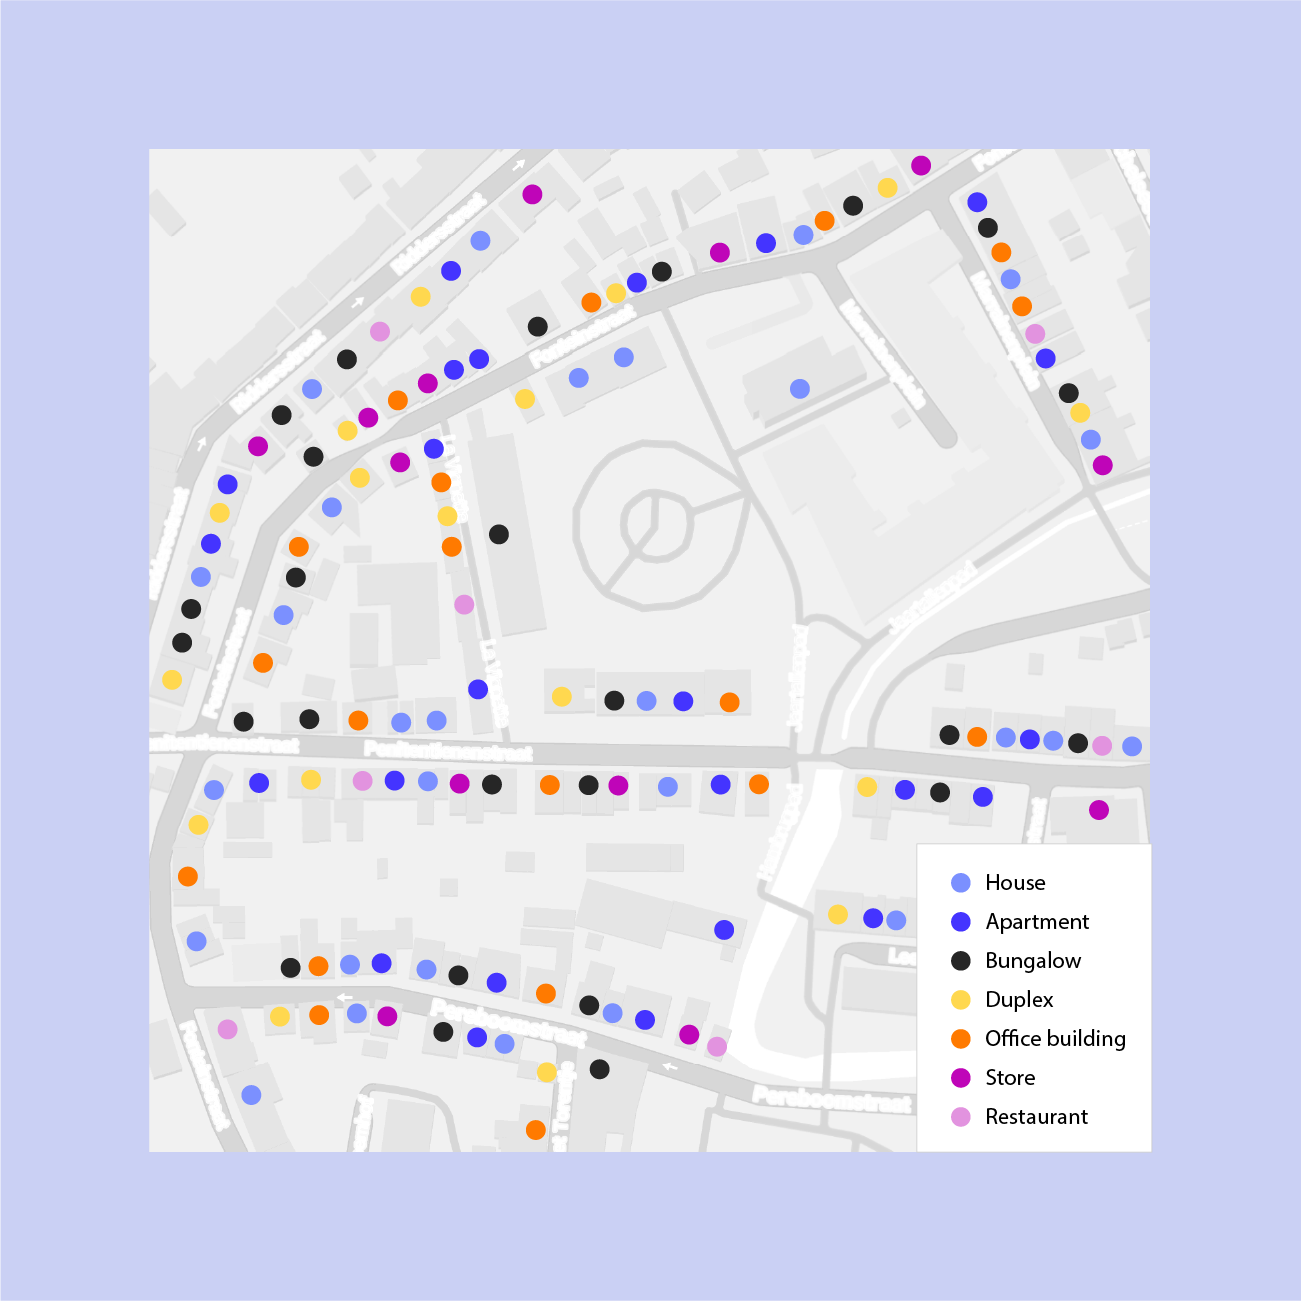
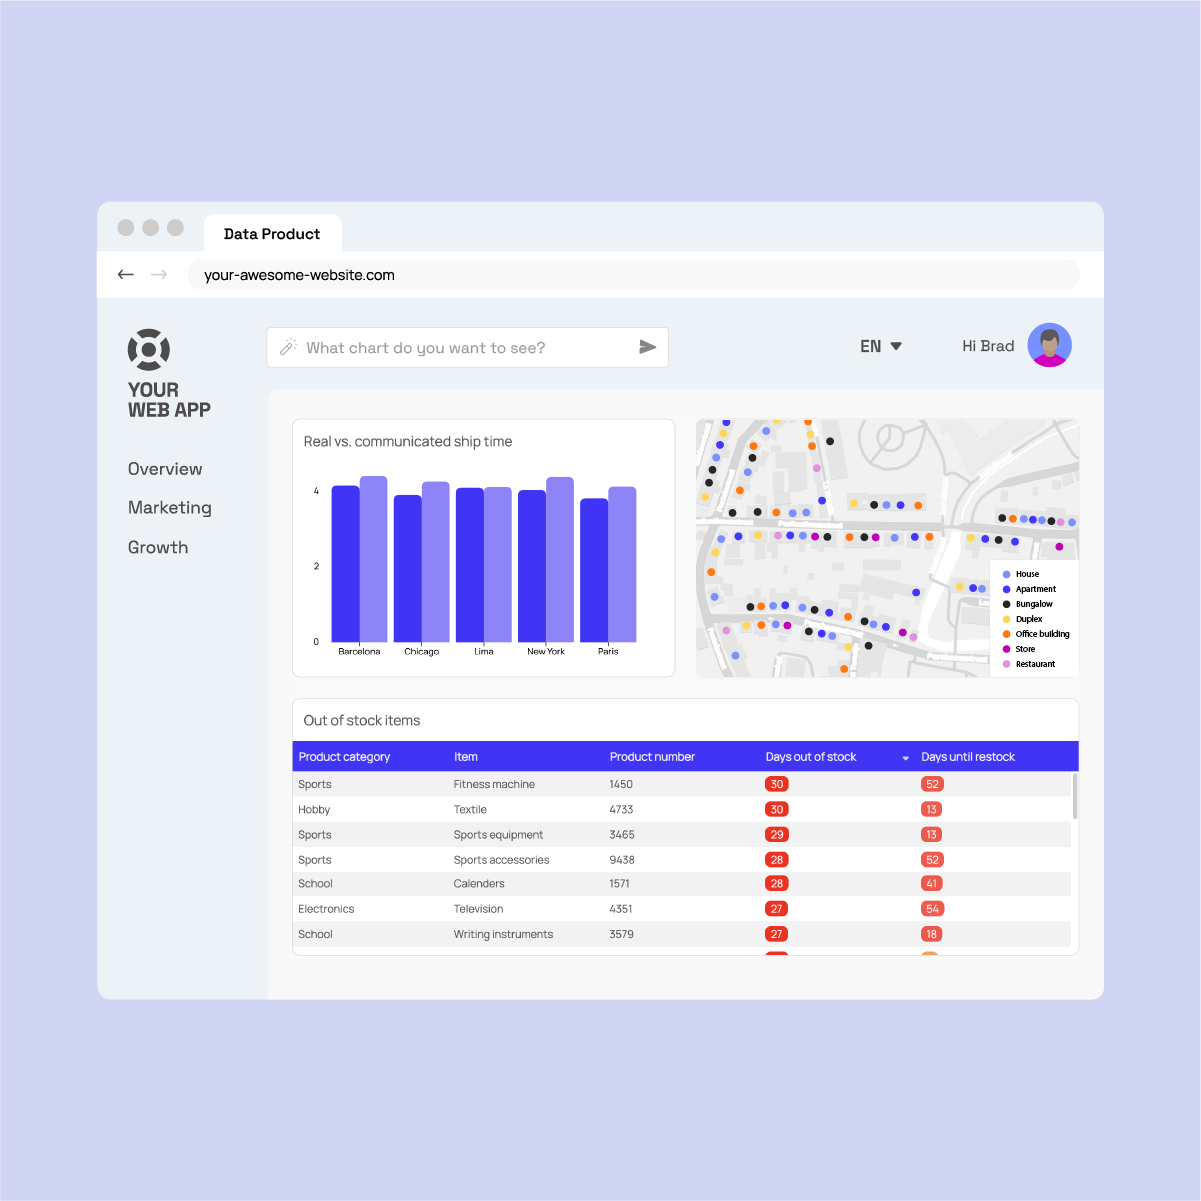
Build charts that look native to your app to reflect your brand's look and feel perfectly. From colors and fonts to animations and behavior.
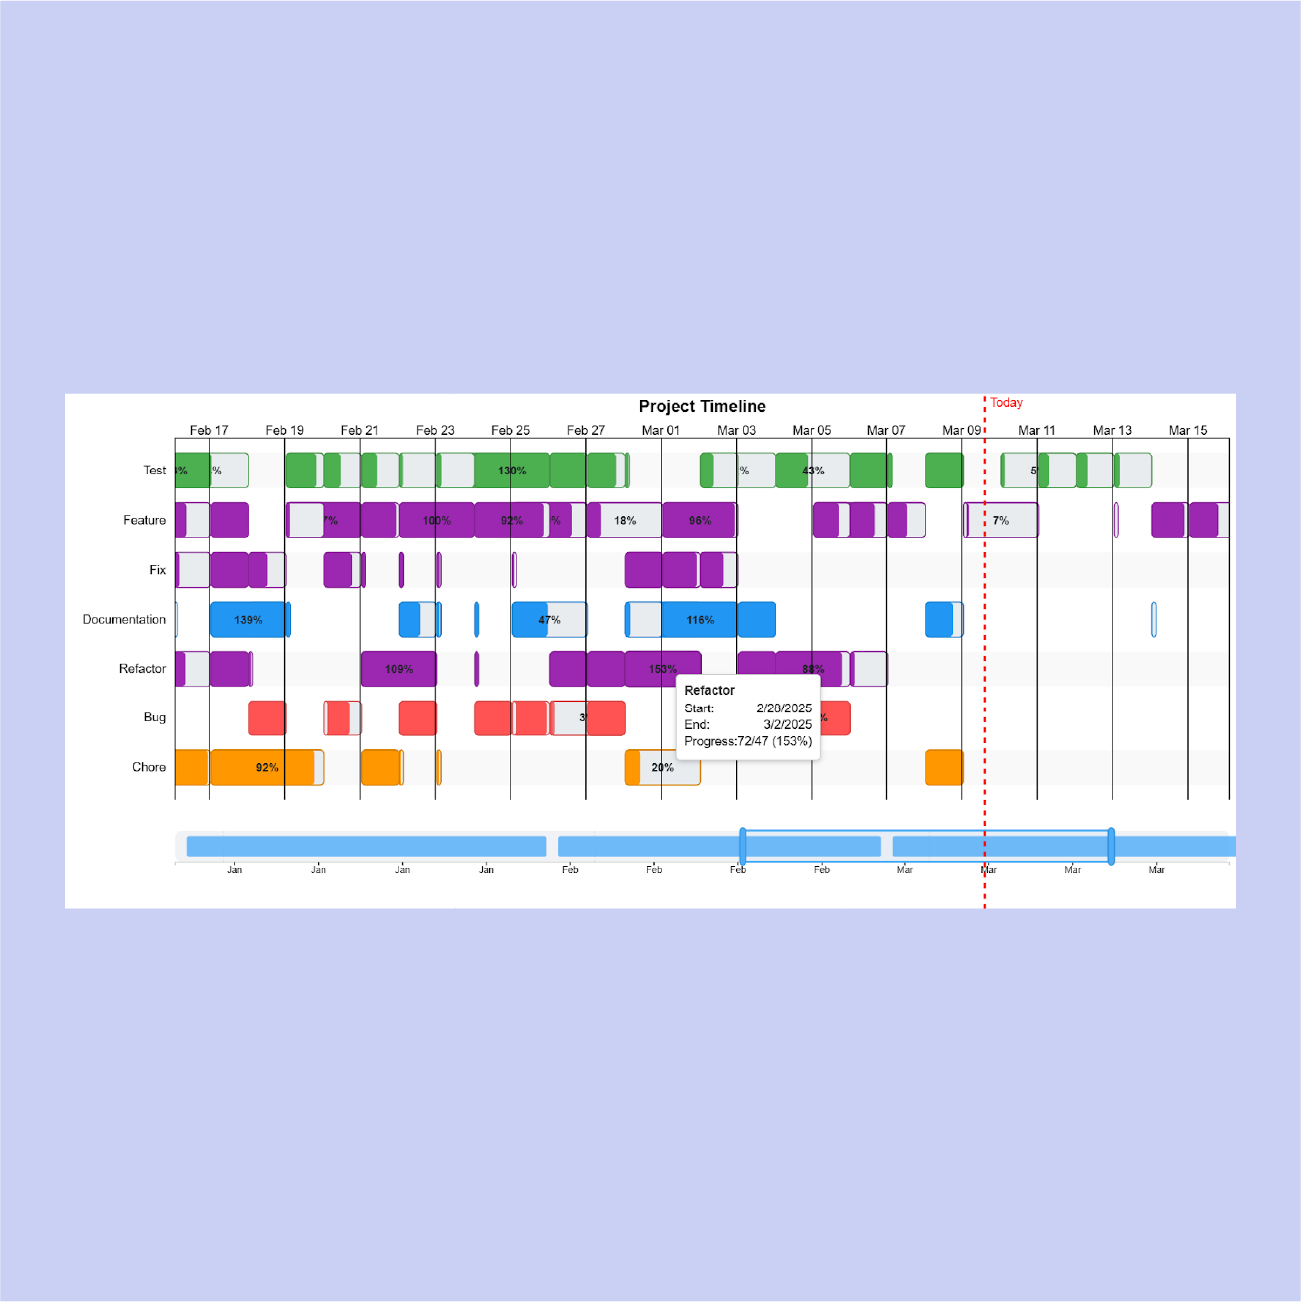
Your custom visuals work out of the box with filters, dashboard logic, fully interactive with other charts. No extra dev work, just drop it in and go.
"Luzmo’s new custom chart builder takes the hassle out of building custom charts."


“Luzmo IQ has been fantastic so far — I see incredible potential. It’s easy to use and delivers impressive results.”

.svg)
“Luzmo IQ enables an intuitive AI-driven chat for users to get actionable insights by simply asking questions.”

“With Luzmo Flex, we built custom data analytics with full control. The development process was smoother, more consistent, and less prone to errors.”

.png)
“After 18 months of evaluating products, we finally found the right balance of features, flexibility, and ease-of-use with Luzmo.”

“You can deliver a ton of value to your customers with very little effort.”


“Luzmo saved us a lot of time when creating dashboards or doing updates.”


“Luzmo is easy to embed into our own front-end and that it doesn't require its own infrastructure to work.”

“Beautiful, out-of-the-box dashboards that can convince new clients!”

In this live coding session, we show you how to build a custom chart that integrates with Luzmo's embedded analytics platform. Create unique, tailored visualizations for your SaaS product, and leverage the strong foundation of Luzmo to supercharge them.
All your questions about Custom charts answered.
What types of visualizations can I create with Custom Charts?
How does development with Custom Charts work?
Do Custom Charts work with existing Luzmo features?
Can I maintain my platform's branding with Custom Charts?
How do Custom Charts improve user experience?
Your roadmap is too important to be stalled by legacy BI. Launch native, self-serve analytics this sprint.