Box Plot Diagram for Data Visualization: Dos and Don’ts
In statistical analysis and exploratory data analysis, a box plot is the superstar of data visualization. While it may not be as popular as a pie chart or something else in Excel’s top 10 hits, it’s one of the most useful chart types for industries such as data science, machine learning, and healthcare.
Today, we take a look at box plot diagrams: what they are, what (not) to do with them, and when it’s best to use them for data visualization.
What is a box plot diagram?
A box plot diagram, also known as a box and whisker plot diagram, is a common way to visualize the distribution of a dataset based on five points:
- Minimum (the smallest data point, or the minimum value, including outliers)
- First quartile or Q1 (the 25th percentile, where 25% of data falls in this range)
- The median value, also known as the second quartile or Q2 (the middle value of the dataset or the 50th percentile)
- The third quartile or Q3 (the 75th percentile, where 75% of the data points fall below this value)
- The maximum value (the largest data point, or the highest value excluding outliers)
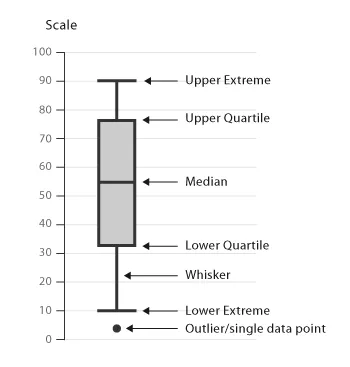
A box plot diagram has fairly standard elements:
- Box
- Median line
- Whiskers
- Outliers
Box plots are commonly used in exploratory data analysis, for situations such as comparing distributions, identifying skewness and spread, highlighting outlier, and summarizing large data sets.
Top use cases for box plot diagrams
Box plot diagrams are very handy, but they only work well in certain situations. Here is when you can get the most out of a box and whisker plot.
Comparing distributions across multiple groups
One of the primary uses for a box plot diagram is to compare the distribution of continuous data (e.g. sales revenue, test scores, response times) across different categories (e.g. regions, departments, or experiments).
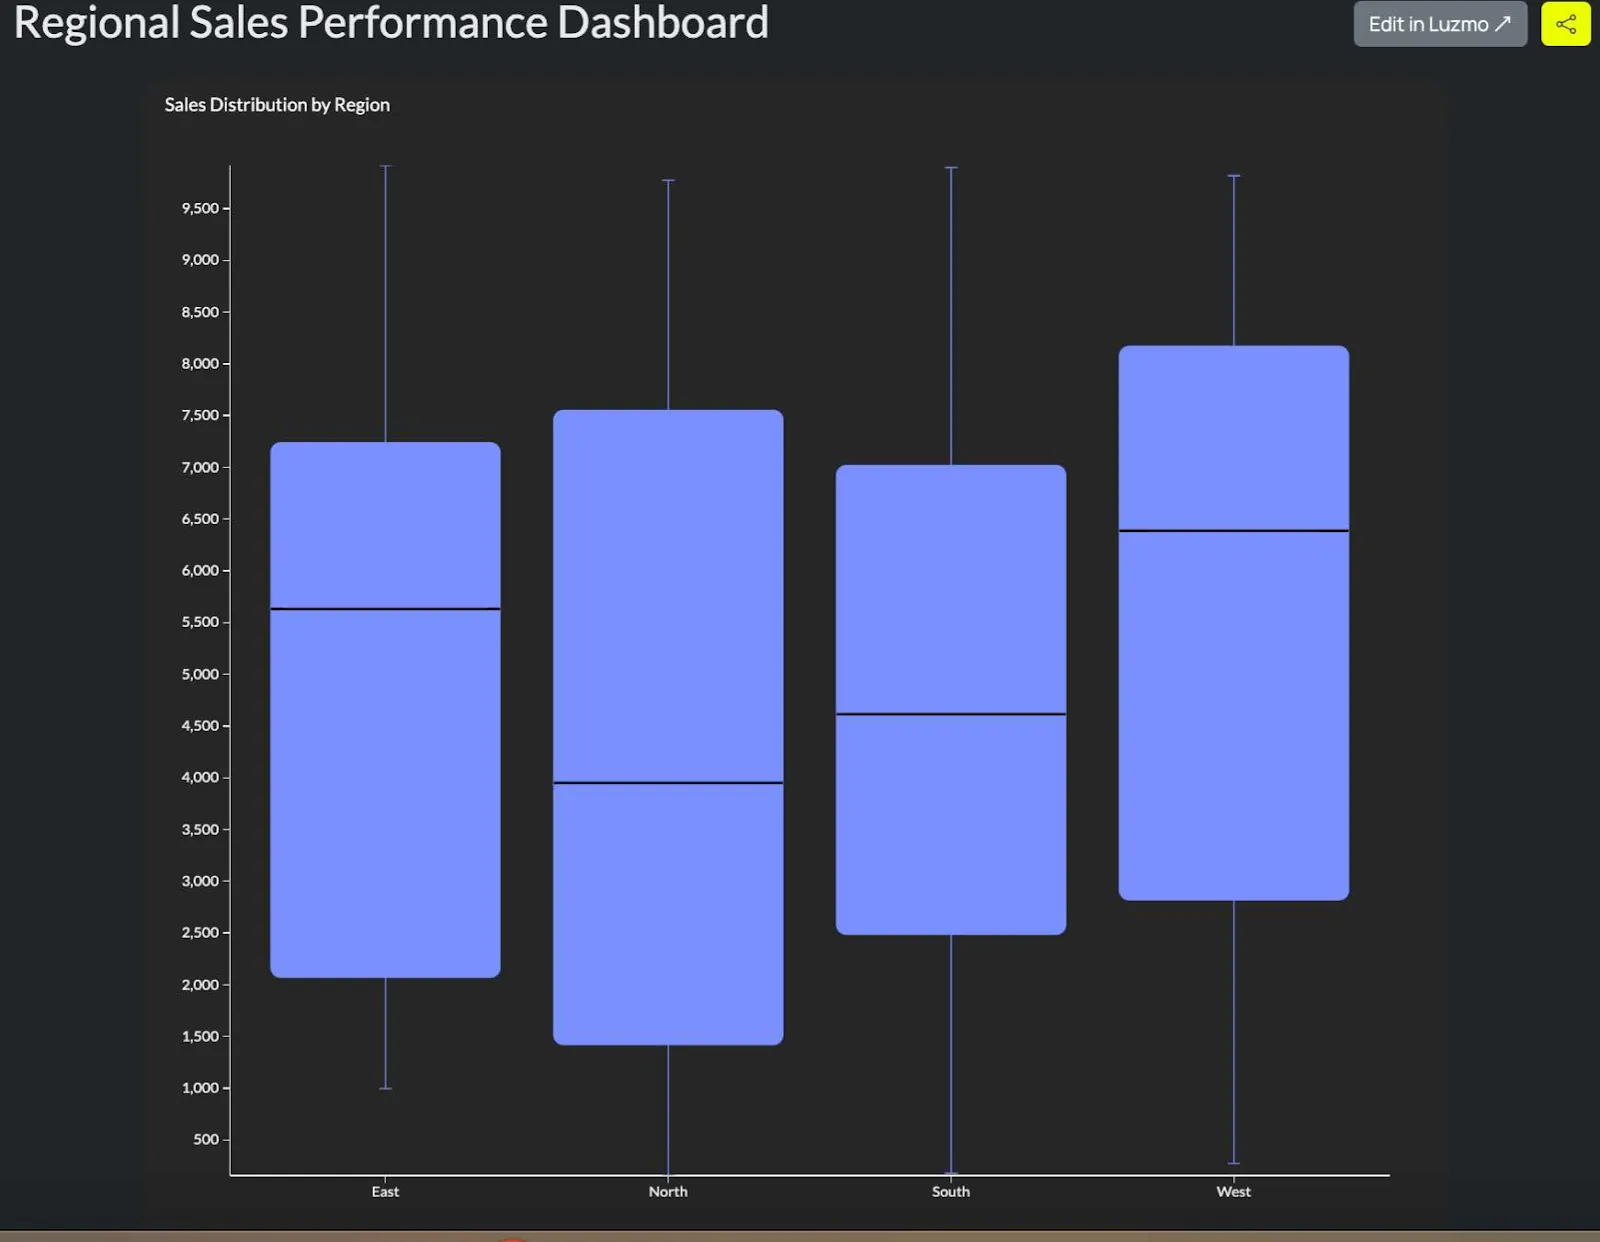
In a box plot, every group or category is represented by its own box. This lets you compare the central tendency (median), the spread (IQR), and the presence of outliers in each group. The reader can easily spot which group has higher variability or different central values.
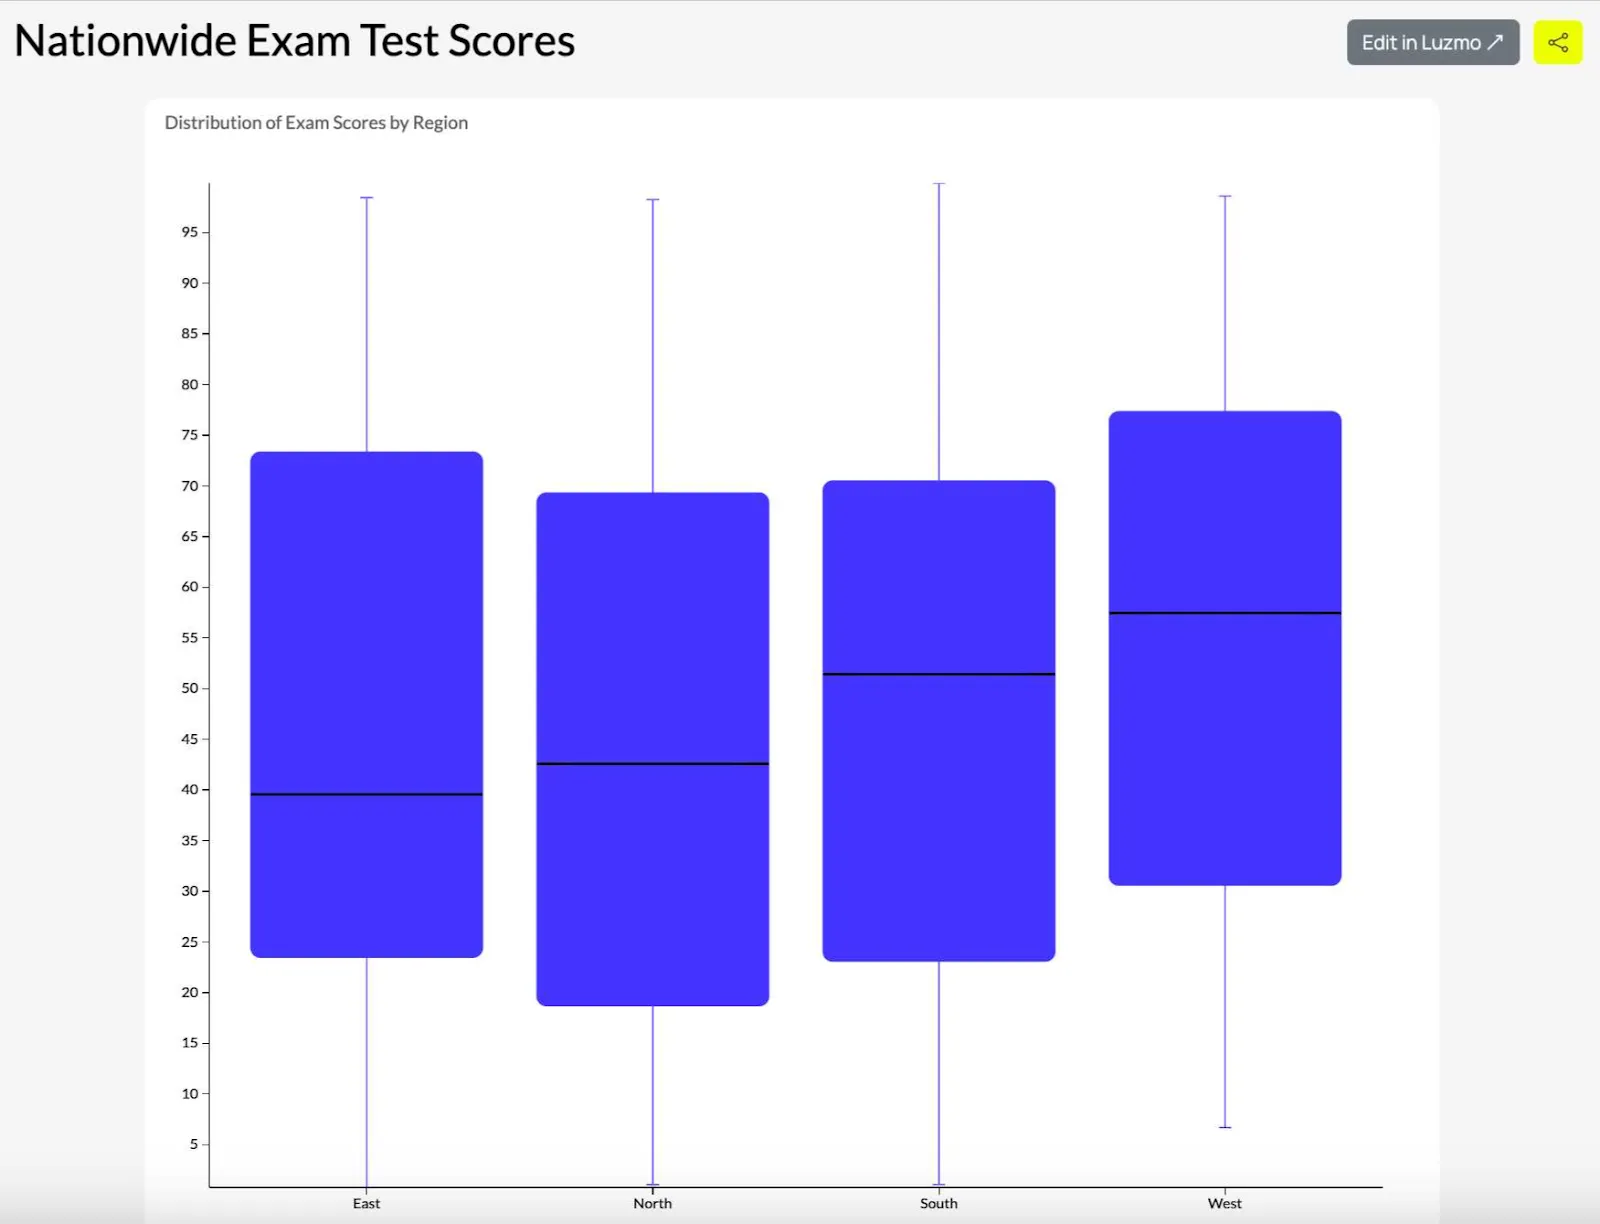
For example, you want to compare the sales performance in different regions (North, South, West, East). With a box plot, you can show the sales distribution for each of the regions. As a result, you can quickly spot the regions with the highest and lowest sales variability and outliers.
Identifying outliers in data
With large data sets, you should be able to spot outliers easily. These are data points that vary significantly from the rest of the data set, which can imply data errors, rare events, or influential observations.
In a box plot, outliers will fall outside of the whiskers, and it’s typically 1.5 the IQR from the quartiles.
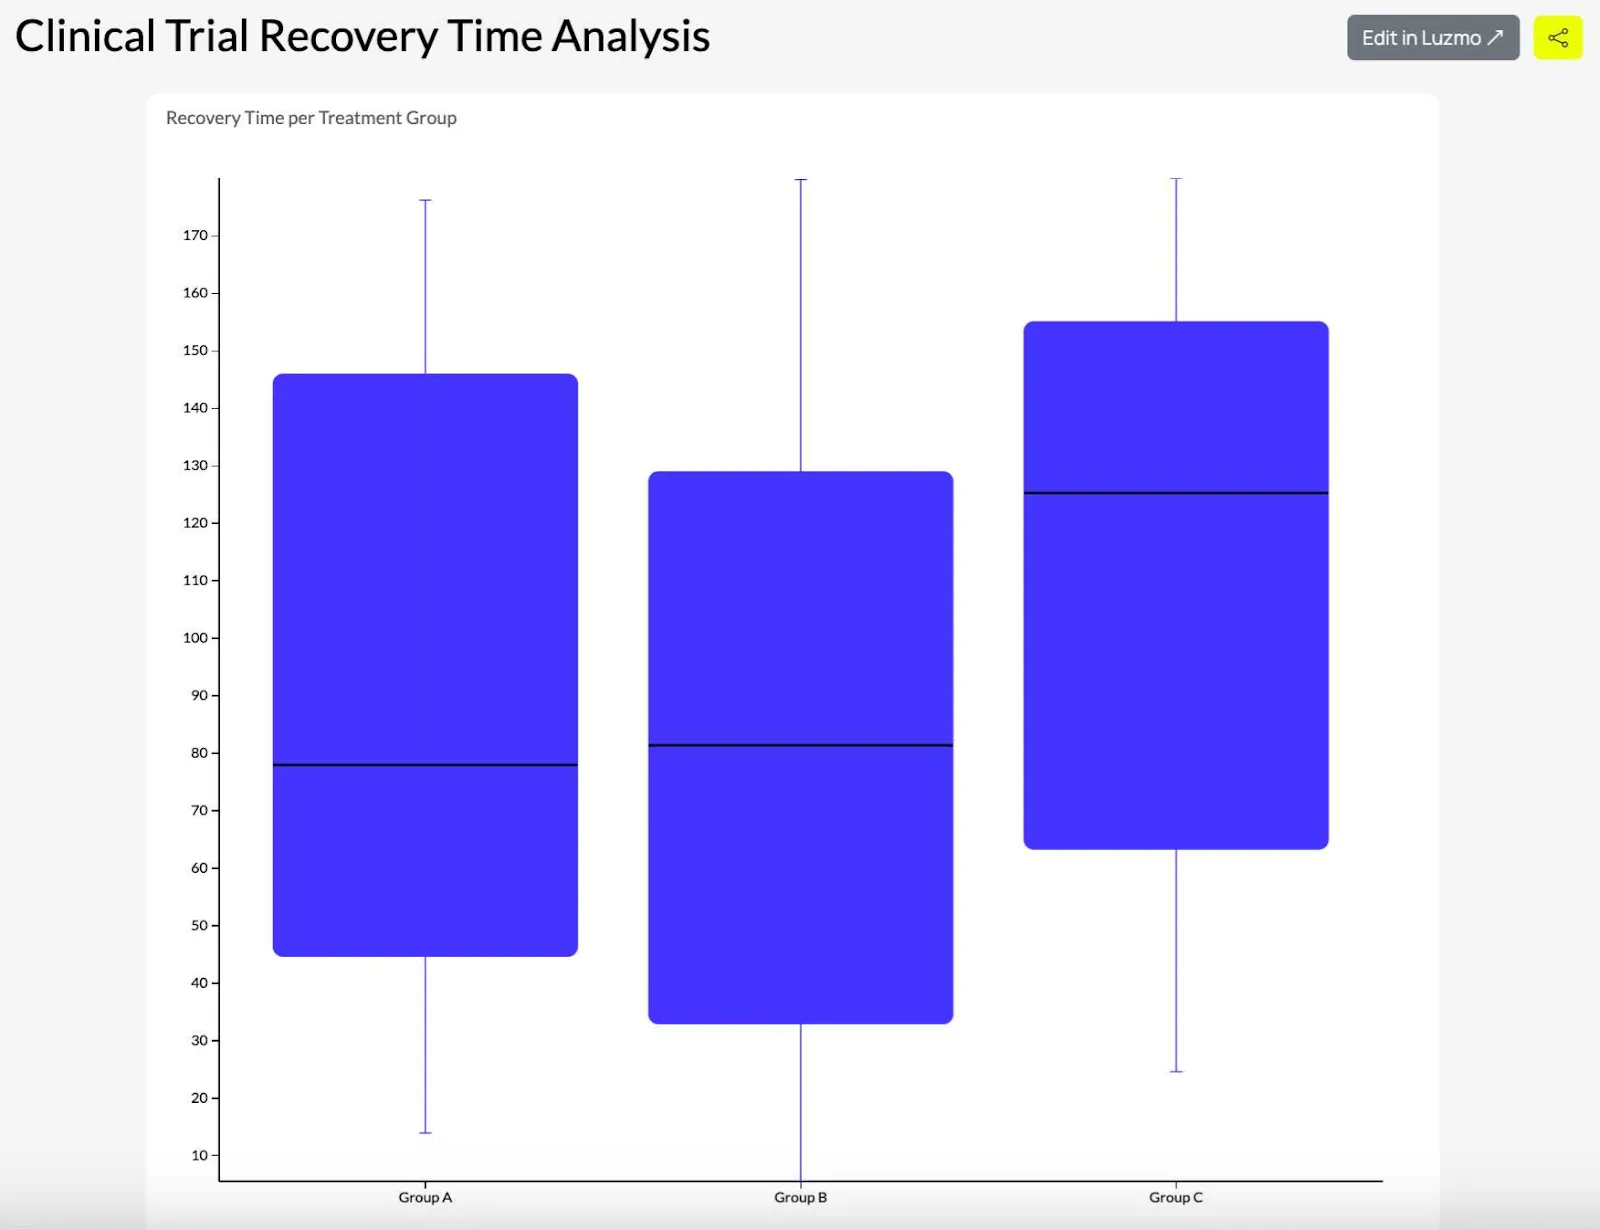
Let’s say you run a clinical trial and you want to explore the recovery time for patients. If some patients’ recovery times are longer or shorter than the average, this will show up on the box plot. The researchers can then immediately investigate the reasons behind this.
Analyzing data skewness and symmetry
A box plot helps you understand if the data distribution is symmetric or skewed, which is important when applying statistical techniques, e.g., parametric or non-parametric tests.
In a box plot, if the median line is closer to the top or the bottom of the box or if the whiskers are not even, it means that the data is skewed. When the box plot is symmetrical, it means that the data is distributed evenly.
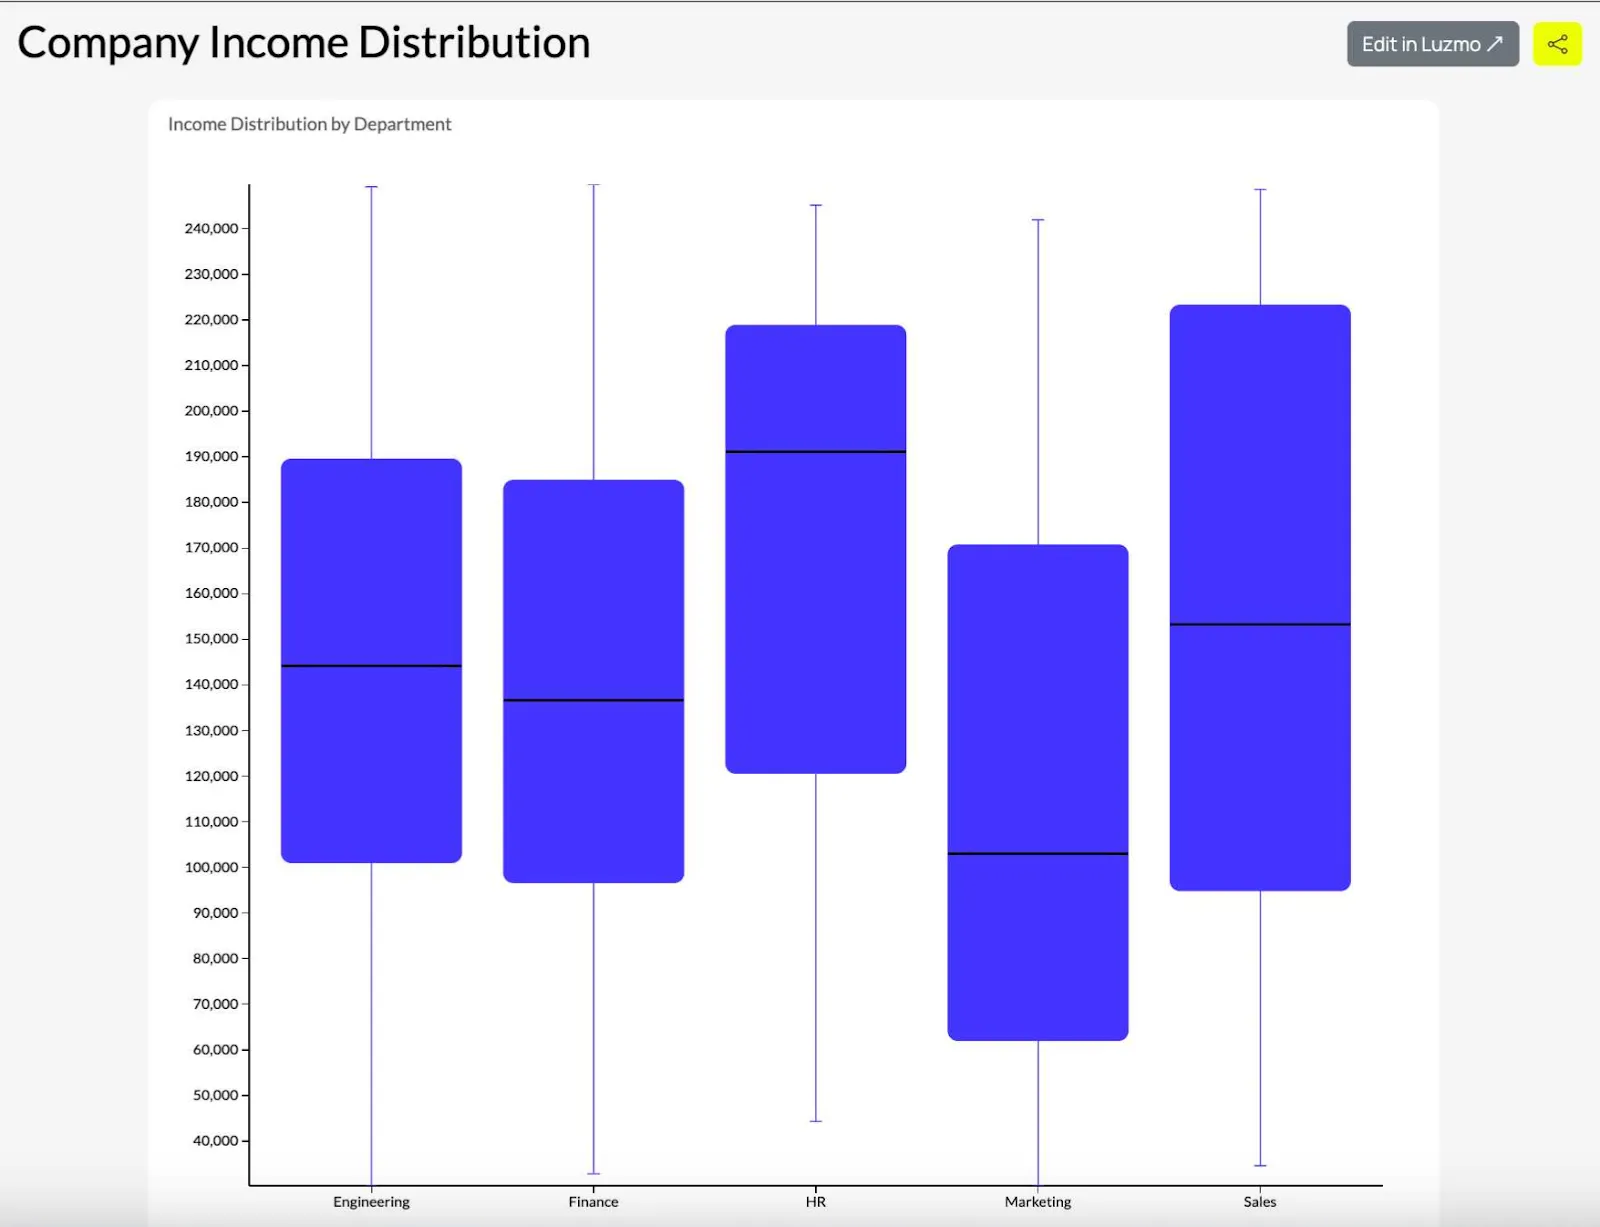
For example, you’re analyzing the income distribution in a company. If the distribution of the income is skewed (for example, some employees are making more compared to others), the whisker on the box plot will be longer on the high-income side, which shows that the data is skewed.
Summarizing large datasets
When you show individual data points that would be overwhelming because of a large data set, a box plot diagram helps you quickly summarize the most important data.
Box plots condense the key statistical properties of large data sets into a format that is reader-friendly. It highlights the range, quartiles, and outliers without overwhelming the reader with too many details.
Box plots condense the key statistical properties of large data sets into a format that is reader-friendly. It highlights the range, quartiles, and outliers without overwhelming the reader with too many details.
For example, summarizing test scores from a nationwide exam across thousands of students. Instead of showing the score for every student, the box plot diagram summarizes the distribution of scores, allowing the educator who is reading to quickly assess the median, range, and any outliers.
Analytics platforms like Luzmo Studio allow teams to include box plots in interactive dashboards, while AI-powered tools such as Luzmo IQ and Luzmo AI help users analyze distributions, detect anomalies, and generate insights automatically.
Comparing performance across time periods
If you want to track performance metrics (e.g., productivity, sales, customer satisfaction scores, and others), a box plot diagram comes in handy.
This visualization type lets you compare the median, spread, and variability over time. You can use it to identify trends, periods of consistency, or fluctuations that are unusual.
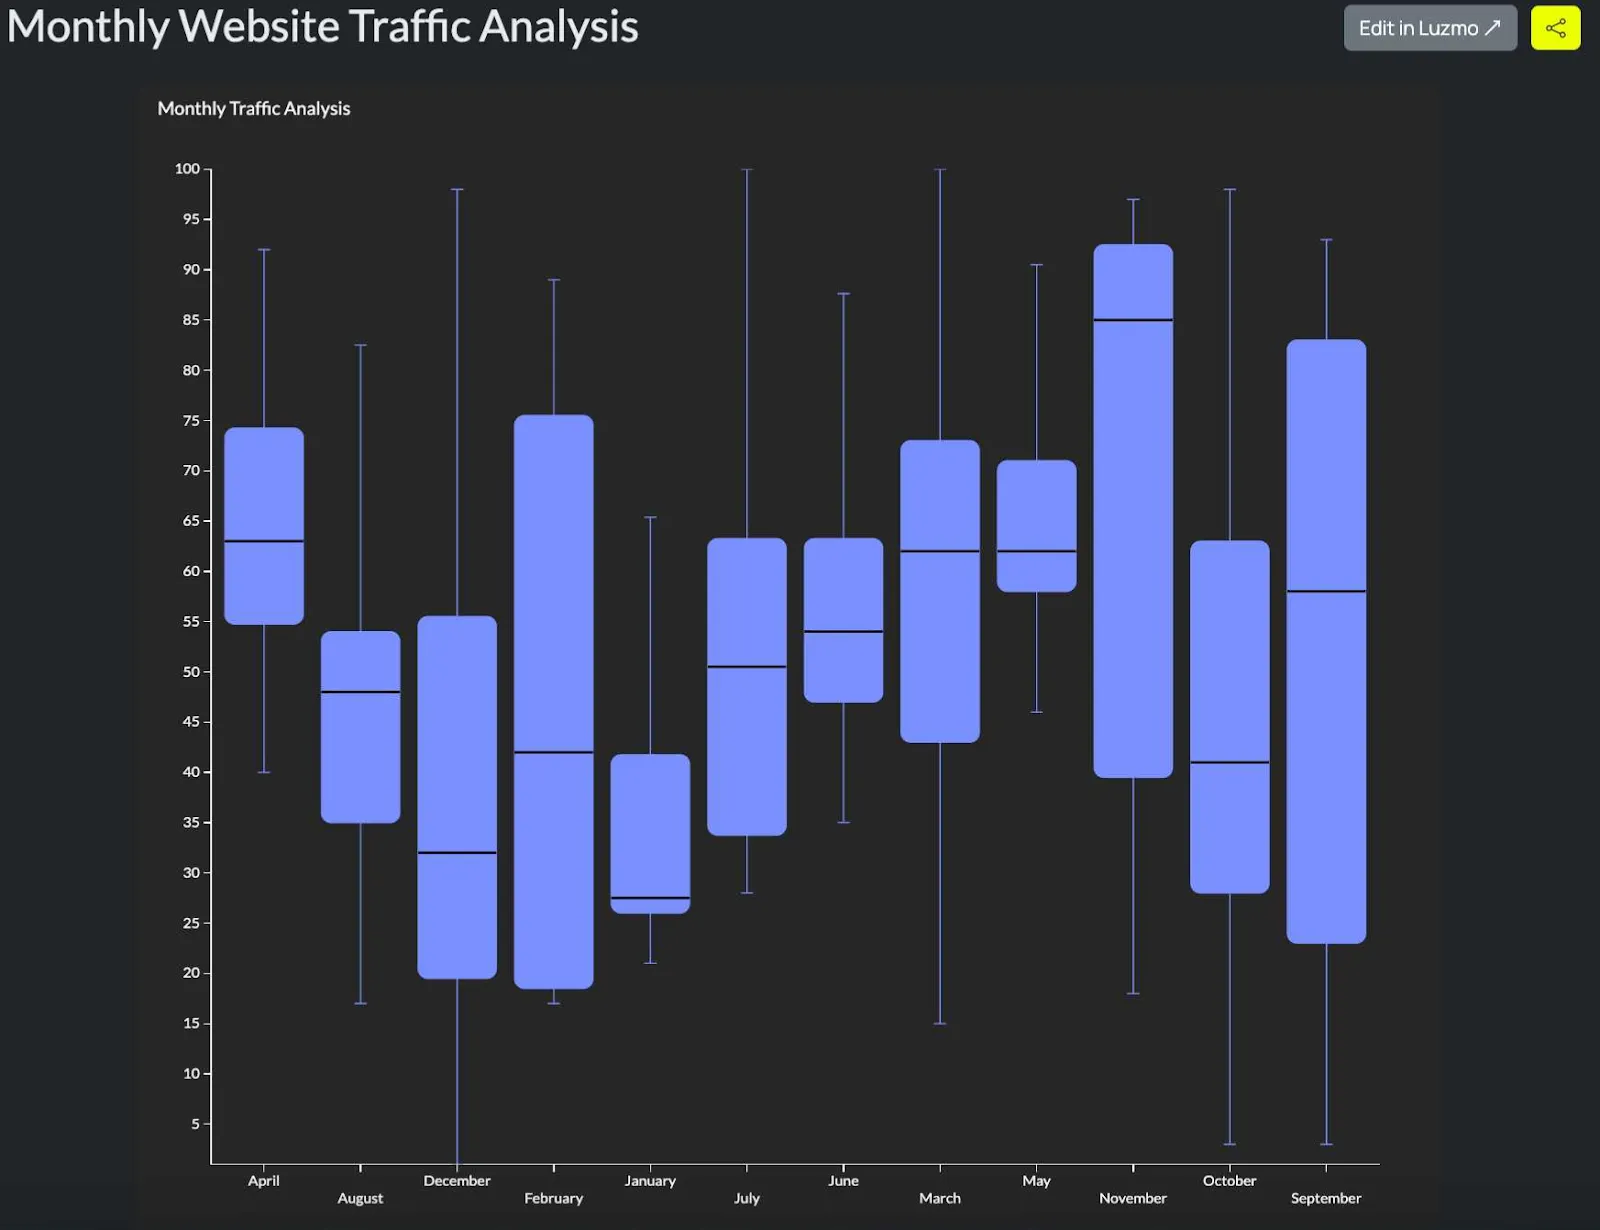
For example, you could be tracking monthly traffic for a website for a year and create a box plot diagram for each month. Each of the 12 box plots can show if the traffic increased or stabilized over time and highlight outliers or months when the traffic was particularly good or bad.
How to read a box plot: the five numbers explained
Box plots pack a lot of information into a small space, which is part of what makes them useful — and part of what makes them easy to misread. Understanding the five core components makes interpretation reliable rather than approximate.
The box itself represents the interquartile range, or IQR — the middle 50% of the data. The left edge of the box is the first quartile (Q1), where 25% of the data falls below. The right edge is the third quartile (Q3), where 75% of the data falls below. A box that is wide indicates high variability in the middle of the dataset. A narrow box indicates that the central values are tightly clustered.
The line inside the box is the median, or Q2 — the value that splits the dataset exactly in half. If the median sits closer to Q1, the distribution is right-skewed, meaning there are more extreme values on the upper end. If it sits closer to Q3, the distribution is left-skewed. A median centered in the box suggests a roughly symmetric distribution.
The whiskers extend from the box to the furthest data point that is still within 1.5 times the IQR from Q1 and Q3. This is the standard definition used by most statistical software, though some implementations use different multipliers. Data points beyond the whiskers are plotted individually as outliers — dots or markers that fall outside the main body of the distribution.
When comparing multiple box plots side by side, the key things to look for are: differences in median position (which group has higher central values), differences in box width (which group has more variability), the direction of skew in each group, and whether the outlier patterns differ meaningfully between groups.
The dos and don’ts of using a box and whisker plot for visualizing your data points
So you want to visualize your data values, but you’re unsure if a box plot diagram is the right choice.
Here are some things you should and should not do.
Box plot diagram dos
Use box plot diagrams for comparing distributions: this visualization type is excellent for comparing skewness and spread of data across different groups.
Include clear axis labels and a legend: proper labels help understand the different ranges, medians, quartiles, and outliers.
Use box plot diagrams when summarizing large sets of data: this type of visualization is excellent for condensing large data sets into a concise five-number summary that shows the range, interquartile range (IQR), median, and outliers. When you need to show lots of data without overwhelming your audience, grab this chart type.
Clearly explain outliers: indicate outliers and explain what those data points mean (e.g., errors, anomalies or rare events)
Use color or annotation to explain key comparisons: when comparing groups in a box plot diagram, colors or annotations help emphasize the differences between them and make it easier for your target audience to understand the visualization.
Box plot diagram don’ts:
Don’t use box plots for small datasets: if the data set is too small, a box plot does more harm than good and confuses the reader. Consider using dot plots or a scatter plot instead.
Don’t use box plots to show exact data points: box plots summarize a large number of data points, which means that an individual data point will be hidden. For showing the distribution of individual data points, use a scatter plot or a strip plot instead.
Don’t use them if your data is categorical: this chart type is ideal for continuous, numerical data. For categorical data, use a bar chart or a pie chart instead.
Don’t forget to check for data skewness: if your data is highly skewed, a box and whisker diagram will distort the perception of data distribution. A violin plot will be the better choice in this case.
Don’t overload the box plot with too many categories: just like with other visualization types, having too many categories results in the diagram being too difficult to read and interpret.
Box plot examples by industry
Healthcare and clinical research
Clinical researchers use box plots to compare distributions of continuous outcome variables — recovery time, test scores, biomarker levels — across patient groups or treatment arms. A box plot showing recovery time by treatment group communicates both the typical outcome (median) and the variability in response, which is often as clinically significant as the central value. Outliers in clinical data frequently warrant investigation: a patient with an unusually long recovery time may indicate a confounding condition or a data quality issue.
Finance and portfolio analysis
Risk analysts use box plots to compare the return distributions of different assets or portfolios over a defined period. The width of the IQR represents volatility in the middle of the return distribution — a wide box signals high volatility in typical returns, not just extreme events. Comparing the whisker lengths across assets shows which have more asymmetric tail risk. A portfolio manager might use a box plot of daily returns across ten assets to quickly identify which positions have the most unpredictable behavior.
Product analytics and software metrics
Product teams use box plots to compare distributions of behavioral metrics — session duration, feature usage frequency, time to first value — across user segments, plan types, or cohorts. A box plot of time to first meaningful action segmented by acquisition channel can reveal that users from one channel take significantly longer to reach activation, which might indicate a mismatch between ad messaging and product onboarding. The outliers in these distributions are often power users whose behavior is worth understanding separately.
For embedded analytics, box plots work well when end users need to compare their own performance distribution against a benchmark — their support response time against industry median, their conversion rate against their historical range. Luzmo AI can surface these comparisons conversationally, selecting box plots automatically when the question involves distributional comparison across groups.
Box plot vs. violin plot vs. histogram: choosing the right distribution chart
Box plots, violin plots, and histograms all visualize the distribution of a dataset, but they make different trade-offs between information density, readability, and the ability to handle multiple groups simultaneously.
A histogram shows the full shape of a distribution in a single group by dividing values into bins and displaying their frequency as bars. It is the most intuitive format for a general audience and the best choice when you want to communicate the shape of a single distribution clearly. Its weakness is comparison: showing multiple histograms at once requires either overlapping them (which creates visual noise) or displaying them in small multiples (which takes more space).
A box plot summarizes the distribution into five numbers and sacrifices shape detail for compactness. It is excellent for comparing many groups simultaneously because each box takes up very little horizontal space. The trade-off is that two distributions with very different shapes can produce identical box plots — a bimodal distribution and a uniform distribution with the same quartiles will look the same in a box plot, which is a genuine limitation for exploratory analysis.
A violin plot is a hybrid: it uses a box plot structure for the quartiles and median, but adds a mirrored density curve on each side to show the full shape of the distribution. This gives more information than a box plot while remaining more compact than small-multiple histograms. The downside is that violin plots are less familiar to general audiences and require more explanation to interpret correctly.
In practice: use histograms for explaining a single distribution to a non-technical audience, box plots for comparing many groups where shape is less critical than central tendency and spread, and violin plots when shape matters and the audience is comfortable with statistical visualization.
Visualize your data set with Luzmo
Box plot diagrams are some of the many visualization types supported in Luzmo, an app that allows you to add a dashboard to your software platform. You can choose from many types of visualizations: histogram, bar chart, tree map, donut chart, and many, many others. But even more importantly, you can embed those visualizations right into your app.
Want to learn more? Book a free demo with our team to find out how Luzmo can help you and your app’s end-users unlock the true power of data visualization. Plans start at $495/month for Starter, $1,995/month for Premium, with custom Enterprise pricing available as you scale.
FAQ
All your questions answered.
What does a box plot show that a bar chart doesn’t?
Box plots display the distribution of data, including median, spread (interquartile range), and outliers, rather than simply totals or averages. This makes them particularly effective for understanding variation and identifying anomalies within a dataset.
How do I interpret outliers in a box plot?
Data points outside the “whiskers” represent outliers - values that fall significantly above or below the central range. These may signal exceptional cases, measurement errors, or important deviations worth investigating.
When should I choose a box plot over a histogram?
Use a box plot when you want to compare distributions across categories (e.g., test scores by classroom), and a histogram when you want to see frequency distributions in a single set of data.
Do users need advanced statistical knowledge to read box plots?
Not necessarily. With a little explanation of quartiles and medians, most audiences can quickly grasp the key story, especially when paired with clear labels and legends.
Written by

Ship the future of your data
Let us show you what Luzmo can do for your product.

Leave your e-mail and one of our analytics experts will reach out to you