6 Embedded Analytics Requirements for Great Dashboards

Embedded analytics is one of the hottest trends in SaaS in recent years and for a good reason. This functionality can provide additional value to your users, give them access to interactive data regarding their business, offer opportunities for creating additional upsell packages and more.
But the big question is - is your SaaS app ready for embedded analytics? Do you have all the technicalities in place to get started? Today, we’ll show you a checklist of the most important embedded analytics requirements, so you can confidently get the process started.
What is embedded analytics?
Embedded analytics is the process of taking an analytics dashboard or report and embedding it in a SaaS application or a website. Typically, business users can access analytics dashboards in standalone apps, such as Tableau or Microsoft Power BI.
Embedded analytics allows you to visualize valuable insights and through APIs and integrations, place those dashboards inside of an app or a website. This allows your end-users to access data about your product and make more informed decisions.
The core of embedded data analytics is that it shows end-users data visualizations instead of raw data. A good embedded analytics tool connects to the necessary data sources, transforms and analyzes data, and gives the end-user beautiful data visualizations they can quickly understand and act on.
To take it one step further, the best embedded analytics tools offer self-service capabilities: they allow the end-user to explore the data on their own terms.
Key embedded analytics requirements for SaaS businesses
Whether you already have a business intelligence tool or not, walk through this checklist of requirements to see if you’re embedded-analytics-ready.
Embeddability
Not every business intelligence tool is a good embedded analytics platform. Let’s break that down for you.
For example, Power BI is an extremely powerful tool for data analytics. But it’s primarily built for an on-premise use case and embedded analytics is more of an afterthought. Building embedded dashboards in Power BI is fairly simple, but embedding them in an app or website and getting them to work? Not a walk in the park.
There are two key aspects of embeddability. First, the embedded analytics solution should be built with embedding in mind. Integrating the dashboards and reports in your app or site should be an easy job for your development team. The app should have a flexible API and a variety of data sources, allowing your devs to embed it in an existing app without a fuss.
Most commonly, dashboards are embedded by copying an iframe of Javascript code, which allows your developers to finish the embedding without breaking a sweat. Besides iframes, the most innovative embedded analytics tools allow more modern ways of embedding, for example through web components.
The second aspect is the user experience. Your business users should not notice a difference between the dashboard and the rest of your app in terms of the design or functionality. The embedded analytics dashboard should look and feel like it was part of your app from day one.
The right set of data integrations
To get real-time insights and visualizations, that data has to come from somewhere. The road from raw data to actionable metrics starts with the data sources. Depending on your unique use case, you may need a number of different data sources and integrations, such as:
- Your own app via an API
- CRMs
- Customer experience platforms
- Big data processing systems
- Data warehouses and data lakes
- ERP software
- Just about any tool or provider you may need as a data source
For the whole analytics functionality to work, your embedded analytics tool needs to have the right data integrations. This can be done directly with an integration to an app or through an API that your developers can use.
Before opting for an embedded analytics app, make sure it supports your preferred data sources or has a usable API. Otherwise, your developers are going to spend weeks and months creating connectors for the embedded solution to work.
The data security
Embedded analytics software gives business users access to data from your app. But it’s not that simple - you need to make sure that you give the right users access to the right datasets and visualizations.
Features such as activity tracking and audit logs ensure that you can see who accesses the data for data analysis and when they do it.
Other features include row-level security and column-level security, protecting your data from third-party access. Speaking of access, it needs to be role-based. For example, a senior-level manager can drill down into data, while individual contributors can only view it.
Single sign-on and authentication protocols ensure that only your app users can access your embedded BI dashboards. Or you can simply leave the dashboard public to give all app users a streamlined analytics experience.
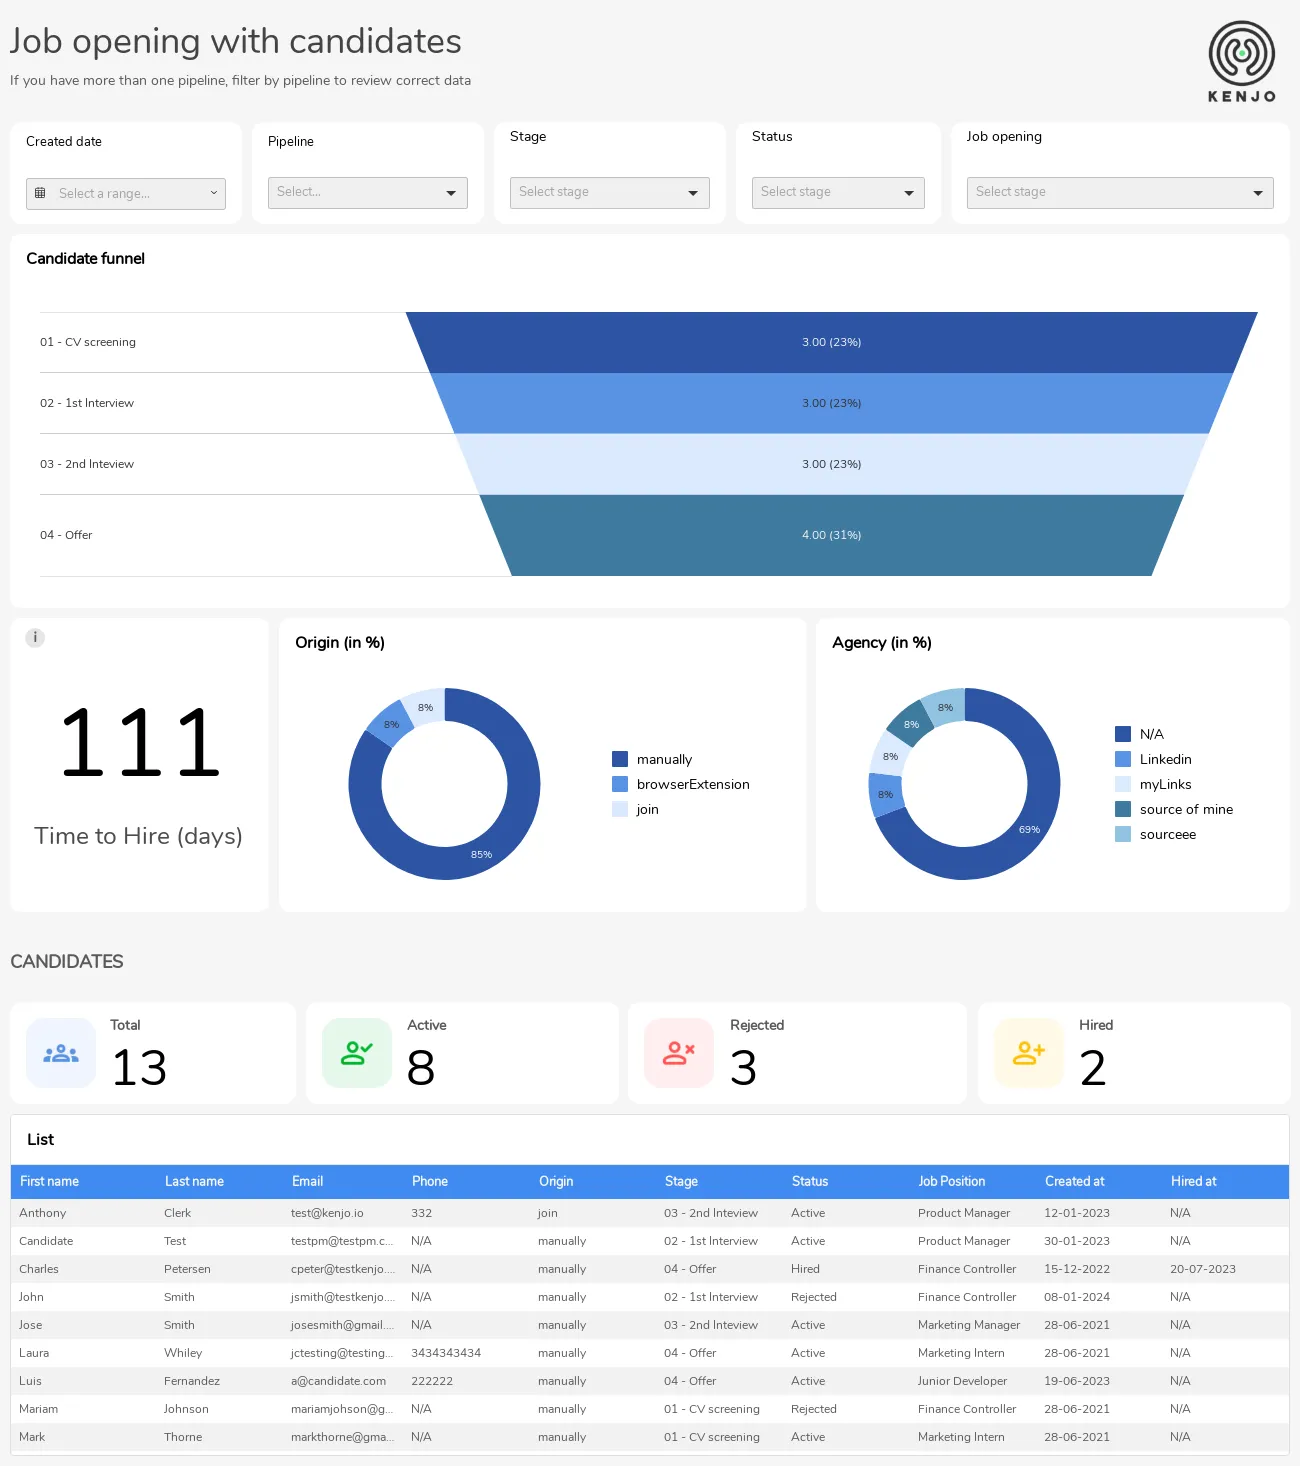
Excellent data visualization capabilities
A basic Excel graph is considered a visualization - but is it a good one? Not likely. For the best customer experience and data-driven decision-making, your BI dashboard should look great, and offer a variety of visualizations and self-service BI capabilities.
For a superior user interface, you need a large selection of visualization types: bar charts, line graphs, histograms, scatter plots, heat maps, and more. For different types of data and use cases, you’re going to need different visualization formats.
The dashboards should have templates, as many in-house teams can’t decide on the right KPIs or visualizations to choose. With a template, you can unlock the right analytics capabilities for your needs.
Drill-drown capabilities are a must, as this is one of the key benefits of embedded analytics. The end-user should be able to explore their data, look at different date ranges, do forecasting based on historical data and more. This is the foundation for proper self-service analytics.
AI features
Artificial intelligence is one of those new features that every app needs to have in 2024, and for a good reason. A combination of AI and embedded systems allows for proper data democratization and ensures that even without a data analyst or engineer on board, anyone can get immediate data insights.
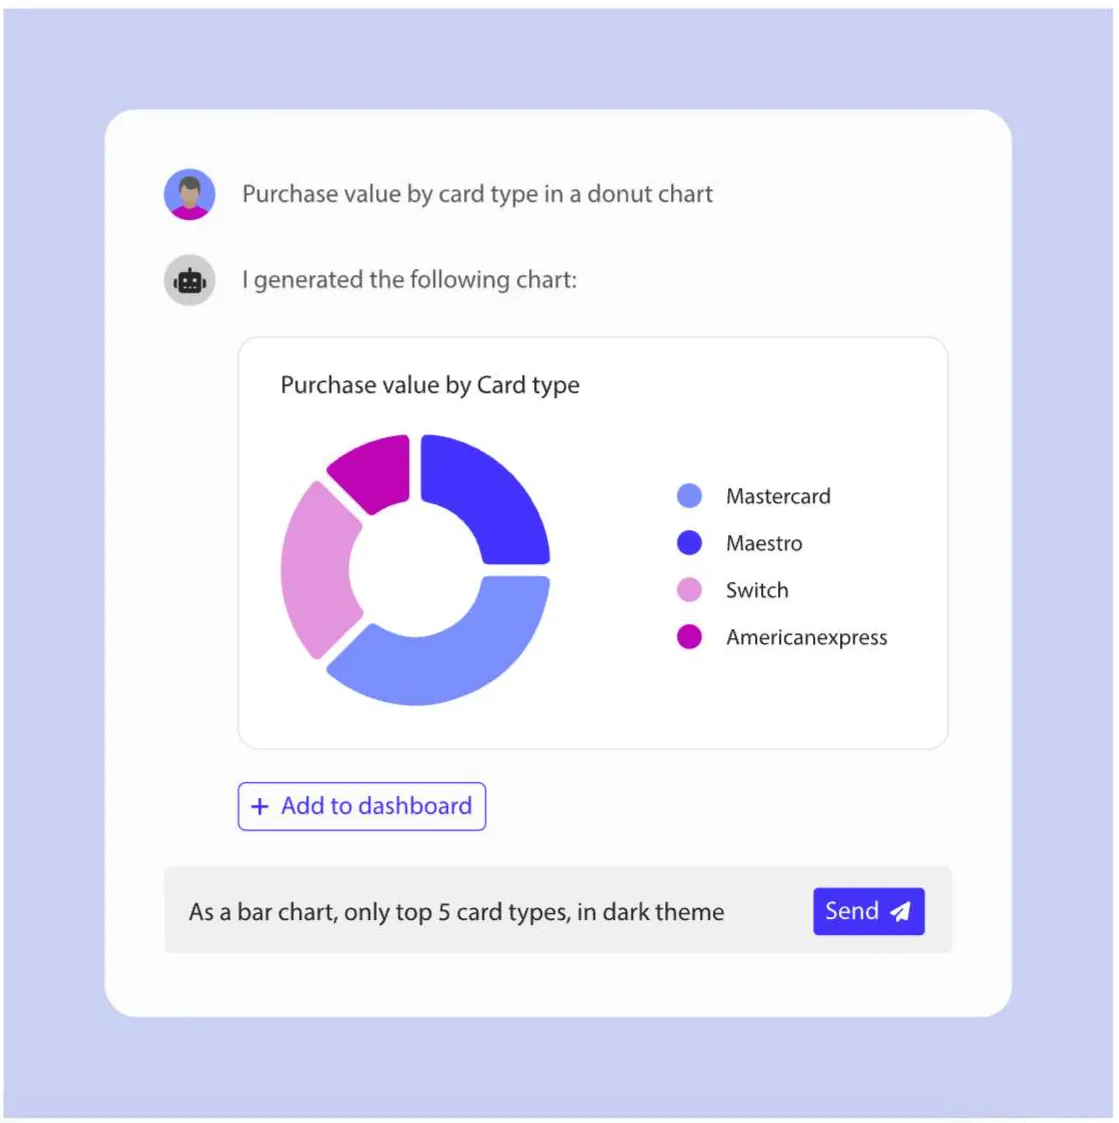
For example, we launched our AI chart generator at Luzmo. Pick a dataset and Luzmo takes care of the data analysis and visualization for you. Once you upload your data, we give you suggestions on what type of visualizations would be best for your use case and analytics application.
This is just one example of how AI can help with real-time and ad-hoc reporting for businesses that don’t have dedicated data specialists on board.
The scalability
Traditional BI apps lock you into a certain number of users per month or year at a certain pricing point. With embedded analytics, it’s different because naturally, you expect the number of your app users to grow.
With this in mind, you want to choose an embedded analytics platform that can grow with you. This means adding more data sources, users and dashboards as you and your user base grow.
There is also the benefit of being able to customize reporting to a large set of users without making those changes for every user - or coding it from scratch. For example, multilingual dashboards that you adapt to a specific language, or changing the currency and the timezone in a dashboard type. All these users can come out of the box with the right embedded BI software.
Embed your dashboards with Luzmo
Ready to unlock new revenue streams and offer advanced analytics to your end-users? At Lumo, we specialize in providing embedded dashboards to SaaS companies like you. Unlike typical business applications that focus on BI and leave embedded as an afterthought, we help software vendors give superior data experiences to their end users.
Shorten your time to market with our flexible API and add dashboards to your app in days - not weeks or months. Use our connectors for a variety of data sources and choose from a wide range of visualizations for your analytics needs.
Last but not least, embedding our BI solution ensures it looks and feels like it was always in your app. Superior customization options let your customers use embedded analytics as a native part of your app.
Ready to give it a go? Sign up for a free trial of Luzmo today or grab a free demo with our team to learn more!
Written by

Ship the future of your data
Let us show you what Luzmo can do for your product.

Leave your e-mail and one of our analytics experts will reach out to you