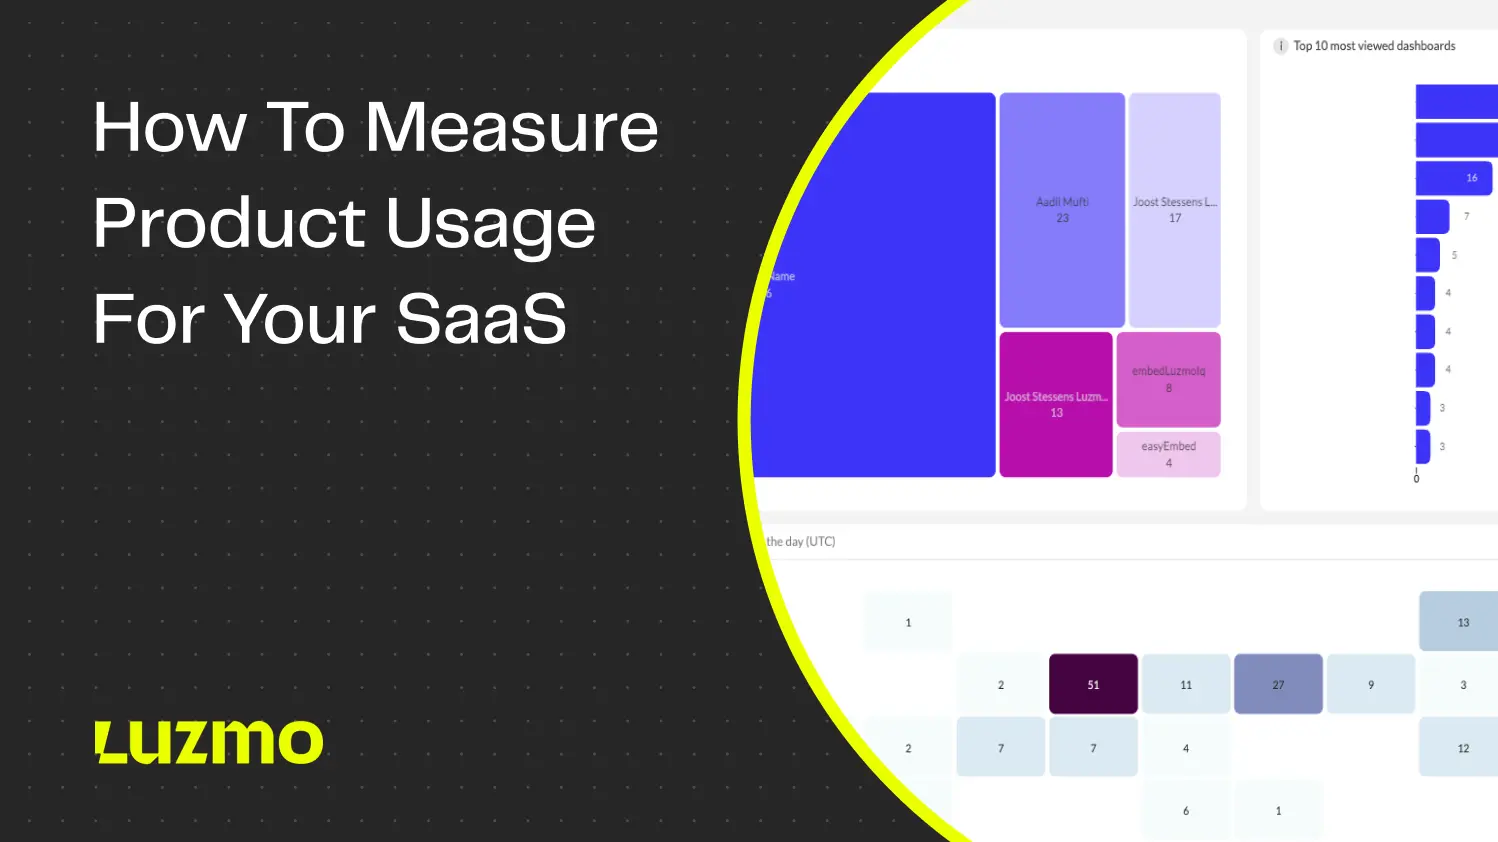
What is Product Usage and How to Measure It for Your SaaS
Data is the new currency of the modern age, and no data points are more important than those about your customers.
How your customers interact with your product can give you all the essential info you need to make better decisions, improve customer engagement, and drive more revenue for your business.
But what is even product usage, and how do you measure it? Today, we show you everything you ever wanted to know about product usage in a SaaS app.
What is product usage?
Product usage data is the data from your SaaS product that shows how your customers use it. For example, what features are they using, where do they spend the most time, which features cause them to upgrade from free to trial, and more.
Product usage data helps you understand your customers, upgrade your product to improve the customer experience and unlock new revenue for your business.
It also helps your customers realize how your app helps them solve their problems more quickly.
Furthermore, product usage data serves as a contact center solution between you and your customer behavior and helps you understand their wants and needs.
This way, they are more likely to convert to a paid customer sooner, upgrade to a higher plan, and stay as a customer for a longer period of time, and you will have a higher lifetime value from them.
Why is it important to measure product usage?
The short answer is to understand how customers engage with your product so you can make informed decisions about what to improve and what to build next. Here are some of the significant effects of measuring product usage:
- Higher conversion rates
- An improved product experience
- A more engaging user experience
- A future-proof method for prioritizing features
- A better way to manage product roadmaps
- More information for the product and marketing teams on how to improve onboarding and activation
In short, this data is massively helpful for everyone, from customer support to product development to marketing and sales – every aspect of project management.
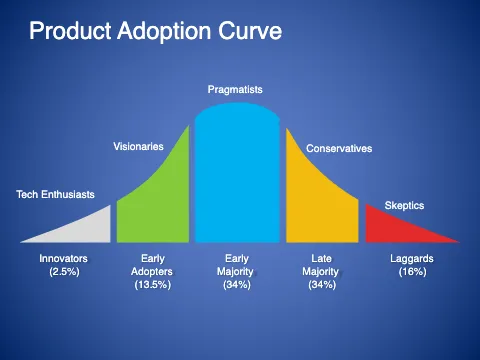
Defining product adoption
To better understand product usage and how to measure it, we need to define product adoption.
Product adoption is the customer journey that a user takes from first hearing about your product to becoming an advanced user and an evangelist.
Depending on the source you’re getting information from, there are different numbers of steps in the product adoption process. Here are the basic ones:
- First contact - when the user first gets in touch with your product
- Activation - when the customer begins using the product
- Selection - the customer decides to use your product exclusively
- Payment - they start becoming a paying user
- Basic use - they use the basic product features
- Advanced use - the user learns about and uses advanced product features
- Advocacy - the user spreads the word about your product
Ideally, each customer should go through all of these stages. In reality, only a select few customers get to the final stage. However, with the proper user experience, a great onboarding process, and lots of personalization, it is not impossible.
The most important product usage metrics to track for a SaaS product
Getting sidetracked with countless metrics to track regarding a product can be easy. Here are some crucial product usage metrics that impact your customer experience and bottom line.
The product adoption rate
While customer success definitions vary from company to company, product adoption rate can be a more practical tool for assessing clients’ satisfaction and understanding how the product works in practice. Measuring the product and feature adoption rate requires the product teams to define the different stages and assign values to them.
For example, you could define the adoption rate as the percentage of users that reach the “aha” moment in their customer journey.
If you run a messaging app, this could be when you invite your entire team to the app and start exchanging messages. If you have a fitness app, it could be the first time someone completes an exercise using your tool.
Product activation rate
The activation moment in the user journey differs from the “aha moment” because it’s when the user gets the product's value and does not just realize it. For example, if you have an email marketing app, this is the moment when they send out their first campaign and start getting conversions from it.
A good product activation rate impacts all the associated metrics, such as stickiness, time to value, churn, and practically every other relevant product metric.
How to calculate it: divide the total number of users who reached the point of activation by the number of new users who signed up in a given period of time.
Time to value
This is how long it takes for the customer to see value in your product. Some call it the “aha” moment - the moment when the user sees the reason why they became a paying customer.
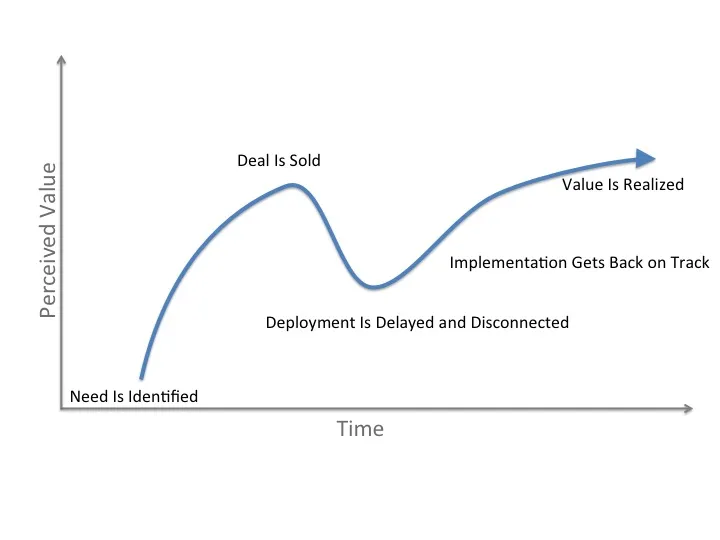
The shorter the time to value, the better. With a shorter period to see the product value, you get many benefits: improved product adoption, better customer retention, lower churn, and a higher chance of upselling the customer later.
There is no time to value or “aha moment” that works for all SaaS products. For example, one of my previous employers was a SaaS for sending business proposals.
The “aha” moment was not when they sent out the first proposal. Instead, it was when they received their first signed proposal from a customer.
Product stickiness
Even though it sounds vague, stickiness is very easy to define. You divide the daily active users (DAU) by the monthly active users (MAU).
In other words, you want as many users as possible to use your product daily. A reasonable stickiness rate is anything above 20%, while most SaaS companies have an average of 13%.
If a product is “sticky,” it means it solves a big enough problem for customers to use it frequently. The better the stickiness, the better the lifetime value and the more revenue you can expect.
Feature usage
This metric shows how much your customers use a particular feature in your app. For example, if you just launched a new feature or want to test whether an existing feature has value, you would like to look at this metric.
Feature usage can help product managers by showing them whether a feature they worked on has actual value for customers. Moreover, they can use it to guide their roadmaps in the future and determine whether it is worth investing in similar features or integrations in future sprints.
It is important to remember that when analyzing feature usage, you should consider different user groups rather than in isolation. Certain types of user personas use some features more, and when you consider this, you can refine and develop new features just for that use case.
How to calculate it: divide the monthly active users of a feature by the number of logins for a specific period, then multiply by 100.
Customer effort score (CES)
This is one of the most common metrics in customer success. It denotes the effort a customer needs to make to achieve something. In simpler words, customers assign a score from 0 to 10 for taking an in-app action.
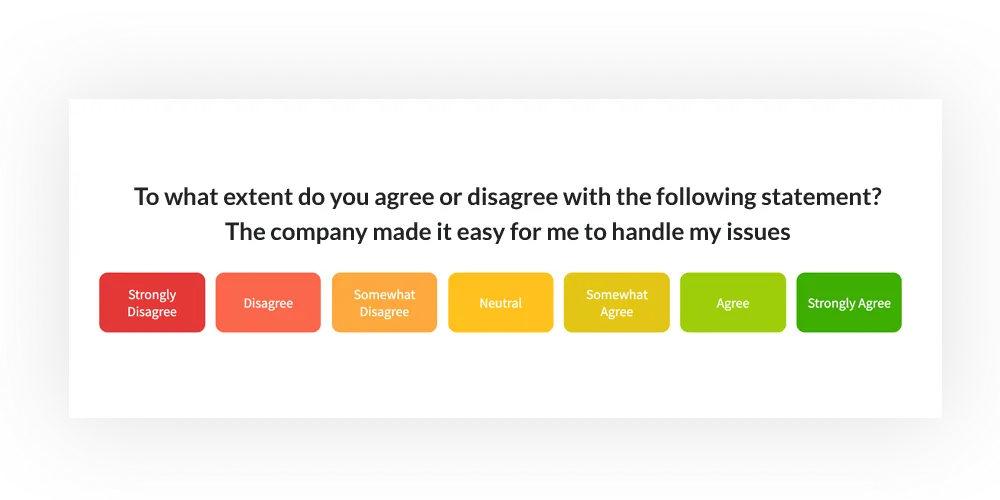
Let’s say you launched a new feature many customers have requested. Within the app, you launch a CES survey asking customers to rate the difficulty of using that feature on a scale from 0 to 10.
CES can tell you whether a feature you worked hard on is getting the usage frequency and ease of use you anticipated. It’s an effortless way to measure in-product activities without being too intrusive and guide your future product development efforts.
Top tools to measure product usage
If you don’t have product usage analytics as a part of your tool, you can rely on various analytics tools to help you. Here are some of the best tools that can help you measure your product usage and related metrics.
Luzmo
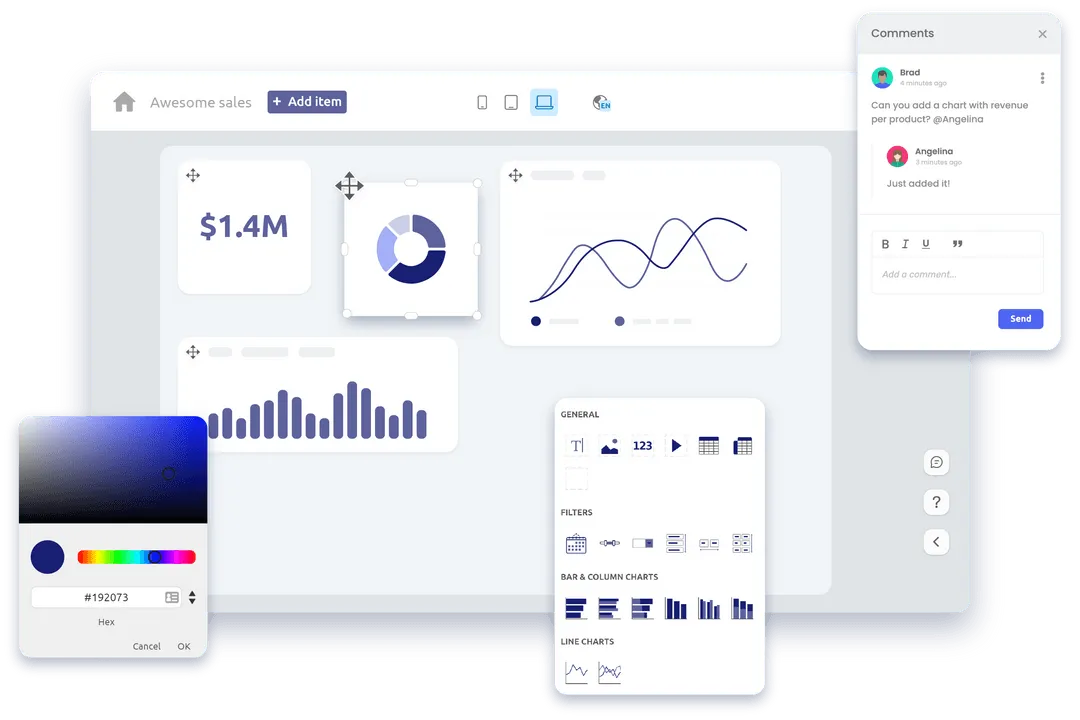
Our platform lets you create an embedded analytics platform within your app and pull the data directly from your product. This way, you can show your users their product usage metrics, shorten the time to value, improve product stickiness, and ultimately impact your churn rate and lifetime value.
Here is a good example. One of our customers is 24Sessions, which runs a video communication platform. They show their customers' product usage data and statistics.
For example, through a dashboard, they could show that using their tool saved them 20 minutes per meeting compared to in-person meetings.
Luzmo also allows you to add an embedded dashboard editor so your customers can create their dashboards and customize them to their liking. Add as many KPIs and widgets as possible to show your customers what they are doing within your app in real-time.
Behind the scenes, several components power this analytics experience. Luzmo Studio provides a visual environment where teams can design and manage embedded dashboards without heavy development work. Luzmo IQ helps automatically surface patterns and trends in product usage data, while Luzmo AI enables natural-language exploration so users can ask questions about their data and instantly generate charts or insights.
Hotjar
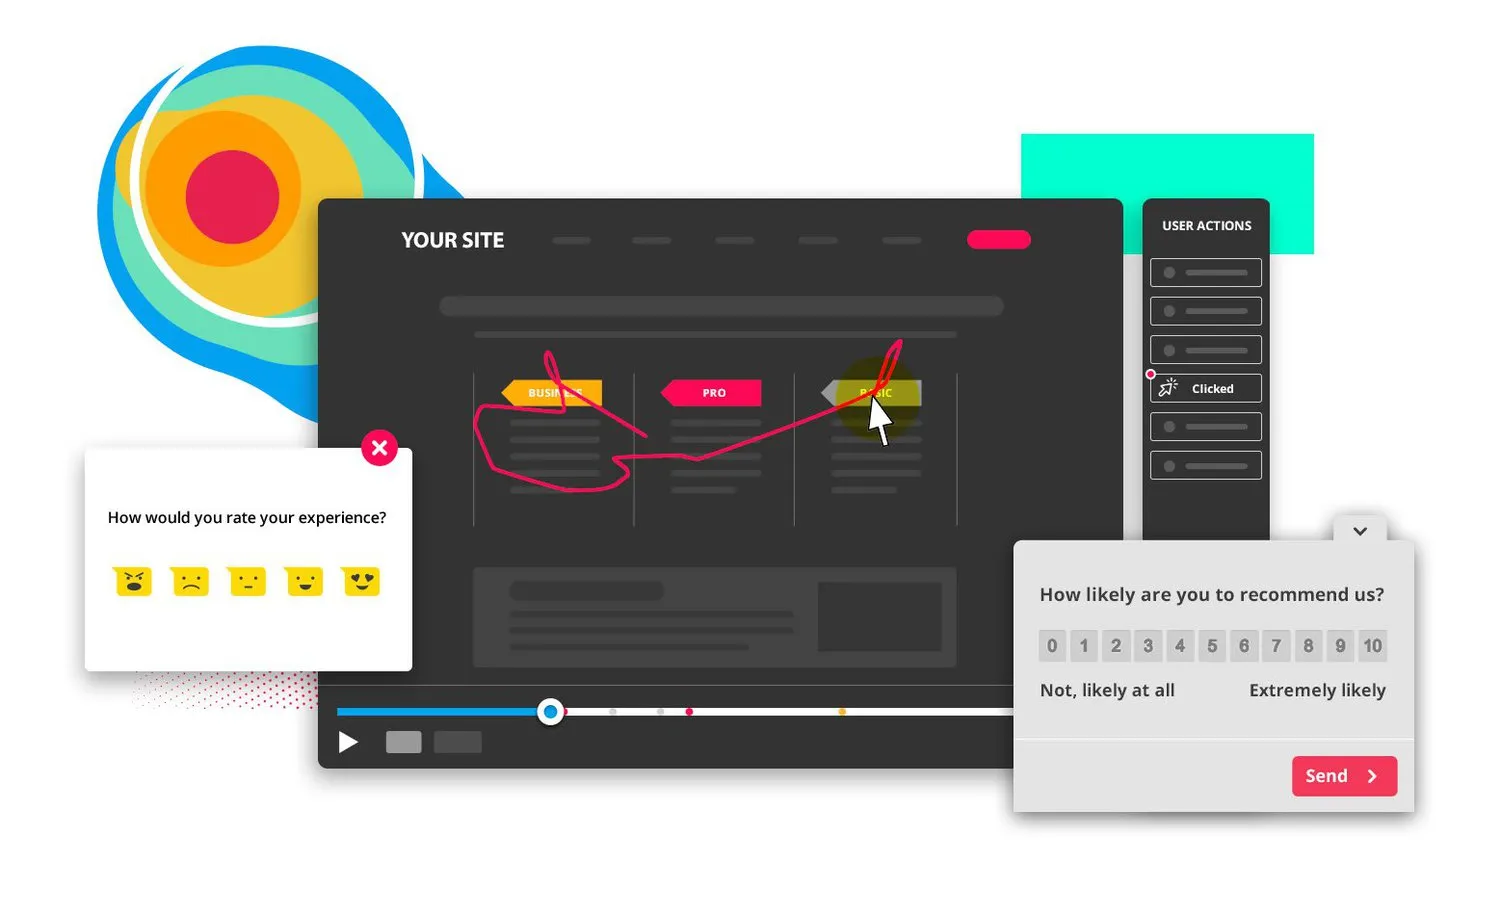
With Hotjar, you don’t need to make assumptions about what customers are doing in your app. You can use this tool to record user sessions and see how they interact with your app, one click at a time. For a bird’s eye view of the product use, you can also use heatmaps to show which areas of a page get the most use and which ones get neglected.
Survicate
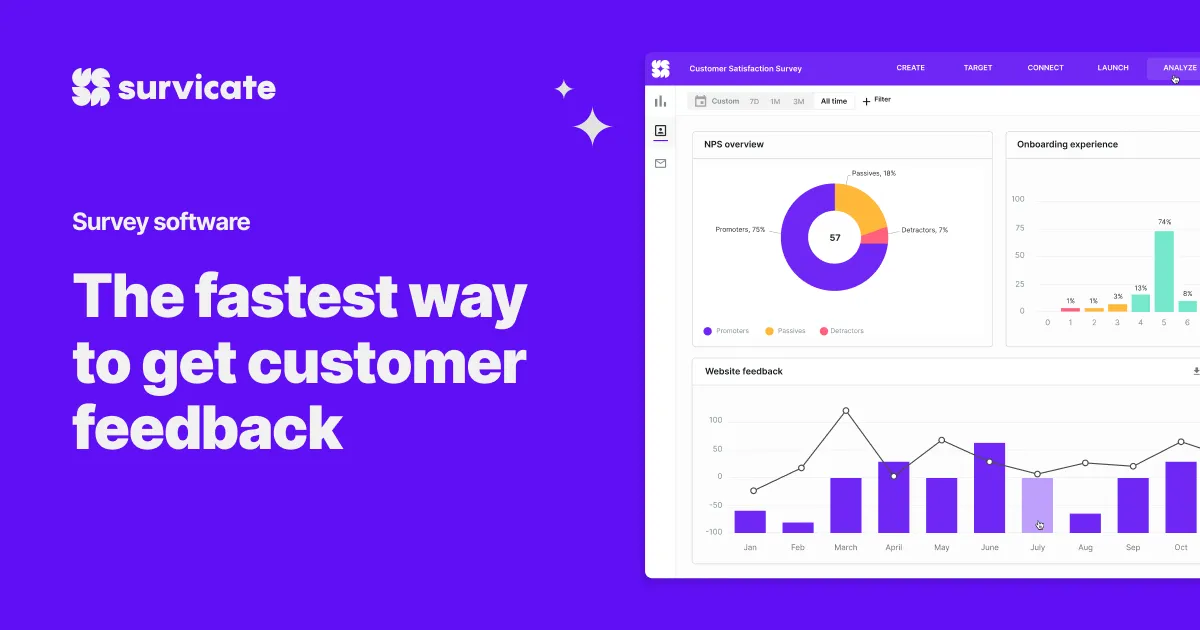
In-app surveys can give you a wealth of information about how customers use your product. You can use Survicate at different customer journey points and trigger it after specific in-app activities. It includes various surveys, such as CSAT (customer satisfaction survey), CES, NPS (Net Promoter Score), and many others.
Best practices for leveraging product usage data
Optimize onboarding based on user behavior
Use product analytics tools like Mixpanel to track user actions and identify friction points during onboarding. Analyzing these behaviors can reveal where new users struggle, helping you refine the onboarding process to create a smoother, more intuitive start for end users. Tailoring onboarding to alleviate specific pain points can improve initial engagement and set users up for success from day one. To generate meaningful insights, this behavioral data must be mapped against accurate and centralized product data, which a PIM system manages to ensure every SKU and attribute is correctly identified.
Identify and prioritize key features
Track user engagement with each feature to understand which drives the most value. If a feature attracts power users or leads to higher retention, consider allocating resources to enhance it further. With such an approach, you can help focus team members build a better product – by prioritizing features that directly impact user satisfaction and long-term loyalty.
Segment users for targeted marketing campaigns
Break down product usage data by user segments to identify valuable insights into how different groups use the product. This breakdown supports creating marketing campaigns targeting specific user needs and pain points and allows your outreach to resonate more with each segment. For example, you might find opportunities to promote certain features to inactive users or upsell premium services to power users.
Refine pricing based on usage data
Adjusting your pricing should not be a guesswork! Product analytics tools can reveal how user segments interact with various features and pricing tiers.
By understanding which features are most popular among different segments, you can optimize pricing structures to better align with user preferences. This data-driven decision-making approach can improve conversion rates and boost overall revenue by offering price points that fit user behavior.
Track and address friction points to enhance retention
Pinpointing common friction points throughout the user journey helps product teams proactively address areas where users may experience frustration. This data can guide team members to adjust to reduce churn and foster long-term engagement. Continuously tracking these pain points will allow you to improve the overall product experience for all users.
Wrapping up
Tracking product usage can unlock precious insights about how users interact with your SaaS application. It’s not just nice to have; it’s a key element of a great product adoption strategy and an amazing tool for improving retention rate and decreasing churn.
And if you want to provide product usage information to your customers and not just for yourself, there is no better way to do it than embedded analytics dashboards. Sign up for your free trial today and create an embedded dashboard in your product in a few hours!
FAQ
All your questions answered.
What is product usage analytics?
Product usage analytics refers to the process of collecting and analyzing data about how users interact with a product. This includes metrics such as feature usage, session duration, and activation rates, which help businesses understand customer behavior and improve their product experience.
Why is tracking product usage important for SaaS companies?
Tracking product usage helps SaaS companies identify which features bring the most value to customers, detect friction points in the user journey, and improve onboarding or retention strategies. By understanding user behavior, teams can prioritize product improvements that increase engagement and revenue.
What metrics are commonly used to measure product usage?
Common product usage metrics include product adoption rate, activation rate, time to value, feature usage, and stickiness (DAU/MAU ratio). These metrics help product teams evaluate how effectively users engage with the product and where improvements are needed.
Written by

Ship the future of your data
Let us show you what Luzmo can do for your product.

Leave your e-mail and one of our analytics experts will reach out to you