Sisense vs Power BI: Which is Better for Embedded Analytics
As with any SaaS product, people buy your app to work more efficiently and become more productive.
Reports and analytics are a vital part of that productivity. Businesses can make decisions up to five times faster when using data insights to validate their assumptions. Therefore, smart SaaS businesses invest in a dashboard to help their users get the most out of their products.
SaaS businesses can offer key insights and usage statistics to customers in‑app in various ways. You can choose to build analytics in‑house or embed an off‑the‑shelf BI tool to save time and money.
In this article, we’ll compare two established business intelligence tools: Sisense vs Power BI.
Each platform has evolved significantly since our last review, with generative AI, new connectors, and pricing updates. For the full platform picture, see our Sisense overview.
Let’s explore which one is best for embedded analytics use cases and integrate the latest features and pricing information.
What is Sisense embedded analytics?
Sisense began as an end‑to‑end business intelligence solution but now markets itself as an analytics platform as a service. At its core, Sisense provides tools for connecting data sources, modeling data, and delivering dashboards and widgets. Since early 2024, the company has doubled down on embedded analytics and AI. In May 2025 Sisense launched Sisense Intelligence, a unified suite of AI‑powered features that includes the Assistant for natural language queries, Narrative for auto‑generated summaries, Forecast and Trend analysis, and Explanation tools. These features sit atop Sisense’s semantic layer and can be invoked inside dashboards or embedded via the Compose SDK for React, Vue and Angular. A new navigation UI and dashboard design mode support the Compose SDK so developers can design dashboards optimized for embedding.
In October 2025 the 2025.4 release unified the assistant experience and improved the NLQ engine: the AI assistant now lives in its own tab, supports every stage of the analytics lifecycle and returns more precise answers. It also offers a human‑in‑the‑loop workflow for semantic enrichment, letting teams edit AI‑generated descriptions before publishing. Additional enhancements include better widget creation flows and support for publishing semantic changes without rebuilding models. For developers, these upgrades mean faster iteration and more relevant results when building dashboards for customers.
Sisense’s strength lies in its broad range of chart types, flexible widget configuration and customization options. The drag‑and‑drop builder supports bar charts, scatter plots, decomposition trees and heat maps, and you can white‑label dashboards to match your brand. Through the Compose SDK you can embed analytics components into your product, control behavior with JavaScript, and secure content using Azure Active Directory or your own identity provider. Sisense gives developers fine‑grained permissions and row‑level security, and the platform integrates with CI/CD via Git. The data engine queries data from your warehouse in real time, unlike traditional BI tools that rely on an in‑memory cube, Sisense relies heavily on direct queries to your data platforms.
Despite these improvements, Sisense still has weaknesses.
- Setting up embedding is complex: you must configure users, roles and tenants, and differences between the Linux and Windows versions can complicate hosting.
- Many customers report a steep learning curve when implementing the Sisense Embed SDK, and the detailed permission system can be cumbersome to configure.
- Performance can degrade on complex data or large data volumes, and some users complain that the interface feels cluttered.
In short, Sisense is powerful but may require a skilled data team and more time than expected to deliver a polished embedded experience.
What is Power BI embedded?
Microsoft Power BI is one of the most popular BI platforms and part of the broader Microsoft ecosystem. Originally built for internal reporting, it connects to a wide variety of data sources: Excel, JSON, relational databases and SaaS services. The service comprises Power BI Desktop, Power BI Pro and Power BI Premium. In 2024 Microsoft launched Microsoft Fabric, a unified analytics platform that integrates data engineering, data warehousing and business intelligence. Power BI now sits atop Fabric, which means datasets, models and reports can be built on lakehouse storage and used across other Fabric experiences.
The Power BI Embedded offering lets SaaS teams embed interactive reports and dashboards into applications. Since 2024 Microsoft has added generative AI features to Power BI. The Copilot (GA for service and preview in mobile) lets users chat with their data, automatically selects the right data source and generates visuals or DAX expressions from natural language. Copilot improvements in late 2025 include new entry points on the home page, suggested prompts and better attachment handling, making the assistant more intuitive. A Report Copilot helps create and refine report pages with AI assistance - it chooses visuals based on context, offers an expanded visual library and understands nuanced instructions. Verified Answers now inherit the full visual state, including slicers, filters and drill‑through settings. It provides more reliable results.
In November 2025 Microsoft announced a Remote Model Context Protocol server (Preview) that allows developers to build their own agents to chat with semantic models. The server exposes tools to fetch the schema, generate DAX queries using Copilot and execute those queries against the model. This paves the way for new agentic experiences and deeper AI integration. On the reporting side, Microsoft introduced automatic matrix expansion, a new Card visual with hero images and dynamic layouts, enhancements to the Image visual, and support for Spark and Impala connectors. Power BI also continues to improve its modeling tools: Semantic Model Version History is now GA, and the TMDL Visual Studio Code extension helps developers maintain models as code. One notable change is that Power BI will deprecate R and Python visuals in the Embed for your customers (app‑owns‑data) scenario by May 1 2026. Customers embedding reports with R or Python visuals must migrate to native visuals or DAX; secure embedding scenarios (user‑owns‑data) are not affected.
Power BI’s pros include deep integration with the Microsoft stack, an ever‑expanding library of data connectors, and the ability to import custom visuals from third parties or build your own. Power BI offers a wide range of chart types and interactive elements, and its semantic model enables reuse of metrics across reports. It is widely adopted in enterprises, so many analysts already know it.
However, Power BI embedded remains complex.
- You must provision capacity in Azure (A‑series or F‑series nodes), configure authentication with Azure Active Directory, and handle embedding tokens.
- The look and feel can be difficult to white‑label, and customizing themes requires JSON.
- Embedding also imposes limitations: R and Python visuals will be disabled in 2026, and some AI features are not available in embed.
Like Sisense, Power BI was built for internal reporting. While Microsoft is investing in generative AI and better APIs, the SaaS embedding experience still lags behind dedicated platforms.
Power BI vs Sisense features comparison
Although both platforms are business intelligence tools with overlapping functionality, their strengths differ. Below we summarise their features, pros, and cons.
Sisense: pros
Visualization and widget variety: Sisense provides a rich library of data visualizations and chart types, including line charts, treemaps, sankey diagrams and decomposition trees. Widgets can be configured extensively, enabling dashboards that look and feel native to your application.
Customization and SDK: The Sisense Embed SDK lets developers embed dashboards and individual widgets into any web framework. You can use JavaScript and REST APIs to control interactivity, set filters programmatically and respond to events. The SDK also supports white‑labeling and row‑level security. Because Sisense is built on a modular architecture, you can mix low‑code and code‑first approaches.
AI features: The Assistant, Narrative and other Sisense Intelligence tools reduce time‑to‑insight by surfacing relevant patterns or generating natural language summaries. Forecast and Trend analyses help users spot anomalies without writing code.
Data modeling: Sisense allows you to build semantic models and publish changes without rebuilding the entire model. Sisense relies heavily on direct query to your underlying warehouse, so there’s no need to duplicate data into an elasticube.
Security and governance: Multi‑tenant security, detailed user roles, support for Azure Active Directory, and a new human‑in‑the‑loop workflow for semantic enrichment provide strong governance.
Sisense: cons
Complex setup: The initial setup for embedding can feel overwhelming. Configuring tenants, users and permissions requires careful planning, and differences between the Linux and Windows installers can create friction.
Learning curve: Although the dashboard builder is intuitive, customizing embed via the SDK requires knowledge of jQuery and JavaScript. Non‑technical users may struggle to find the right settings and build advanced data analysis expressions.
Performance: Some users note slow load times when handling raw data with many joins or large volumes. Performance tuning may require caching or pre‑aggregations.
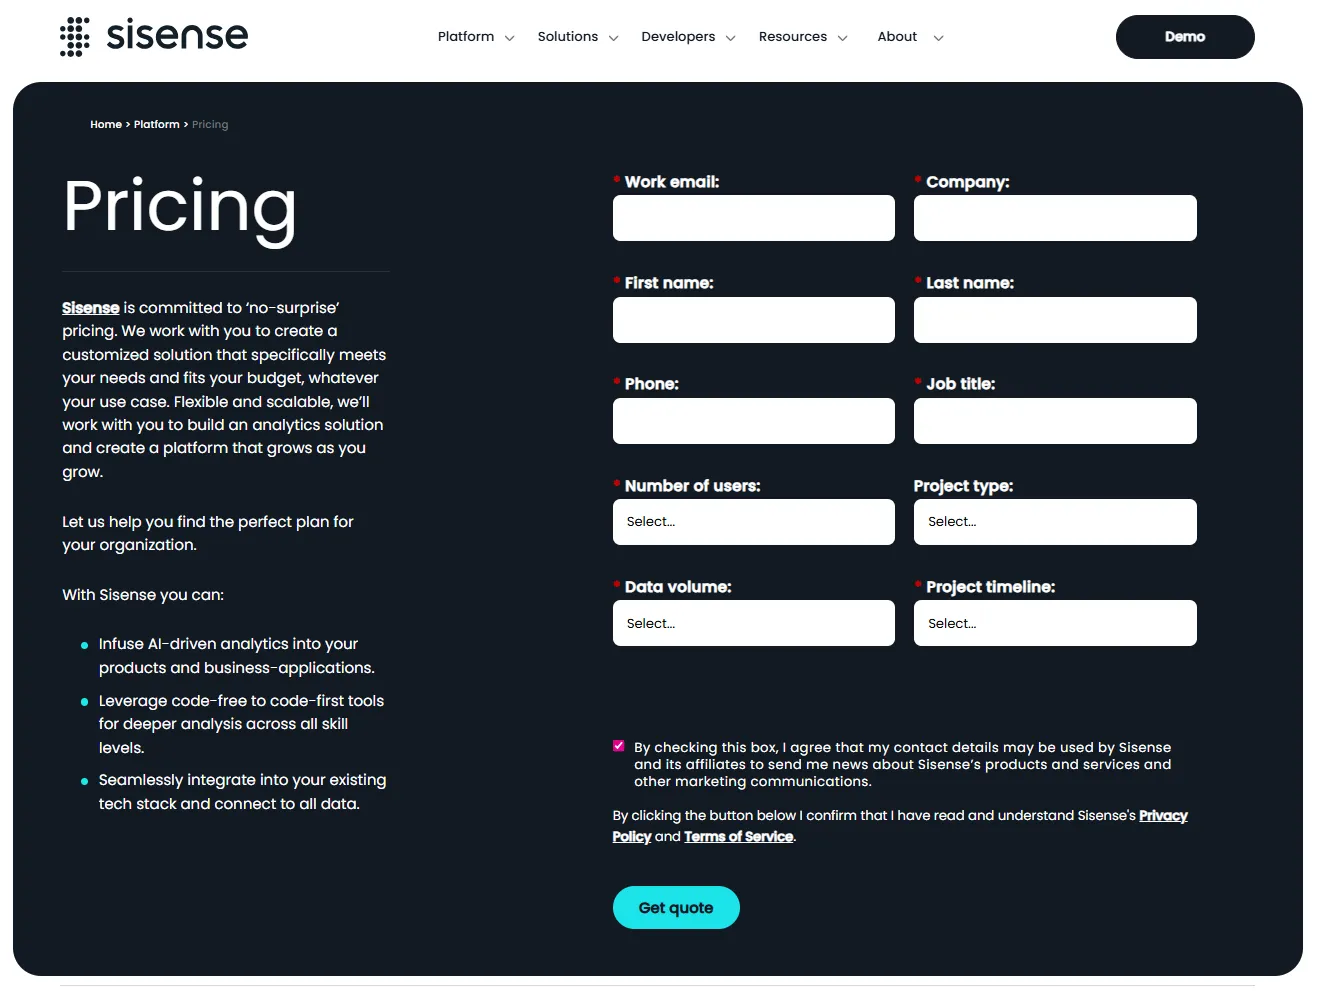
Pricing: Sisense doesn’t publish its rates, and quotes range from roughly US$35 000 to US$75 000 per year. Costs depend on user seats, hosting method and usage; expect to pay at least US$2 000-US$9 000 per month for mid‑tier packages.
Support: Documentation is improving, but support responses can be slow compared to other vendors.
Power BI: pros
Wide adoption and ecosystem: Power BI is entrenched in the Microsoft stack and integrates smoothly with other Microsoft products like Excel, Teams, SharePoint, Dynamics 365 and Azure Synapse. Many teams already use it, reducing training time.
Data connectors: It offers hundreds of connectors for databases, SaaS apps and file formats, plus the ability to build custom connectors.
Custom visuals and extensibility: A marketplace of third‑party visuals, along with the capability to author your own, allows specialized charts. Developers can also embed the service in custom apps with the Power BI service APIs.
AI and Copilot: Natural language chat, automatic DAX generation, power query integration and Verified Answers make it easier for non‑analysts to explore data.
Semantic modeling: Power BI uses a robust semantic model with relationships and measures defined using Data Analysis Expressions (DAX). The Semantic Model Version History (GA) and TMDL extension help teams manage models as code.
Flexible deployment: You can deploy reports to Power BI Premium capacity, embed them for customers, or publish them inside Microsoft Fabric; this flexibility is useful if your SaaS must integrate with other internal systems.
Power BI: cons
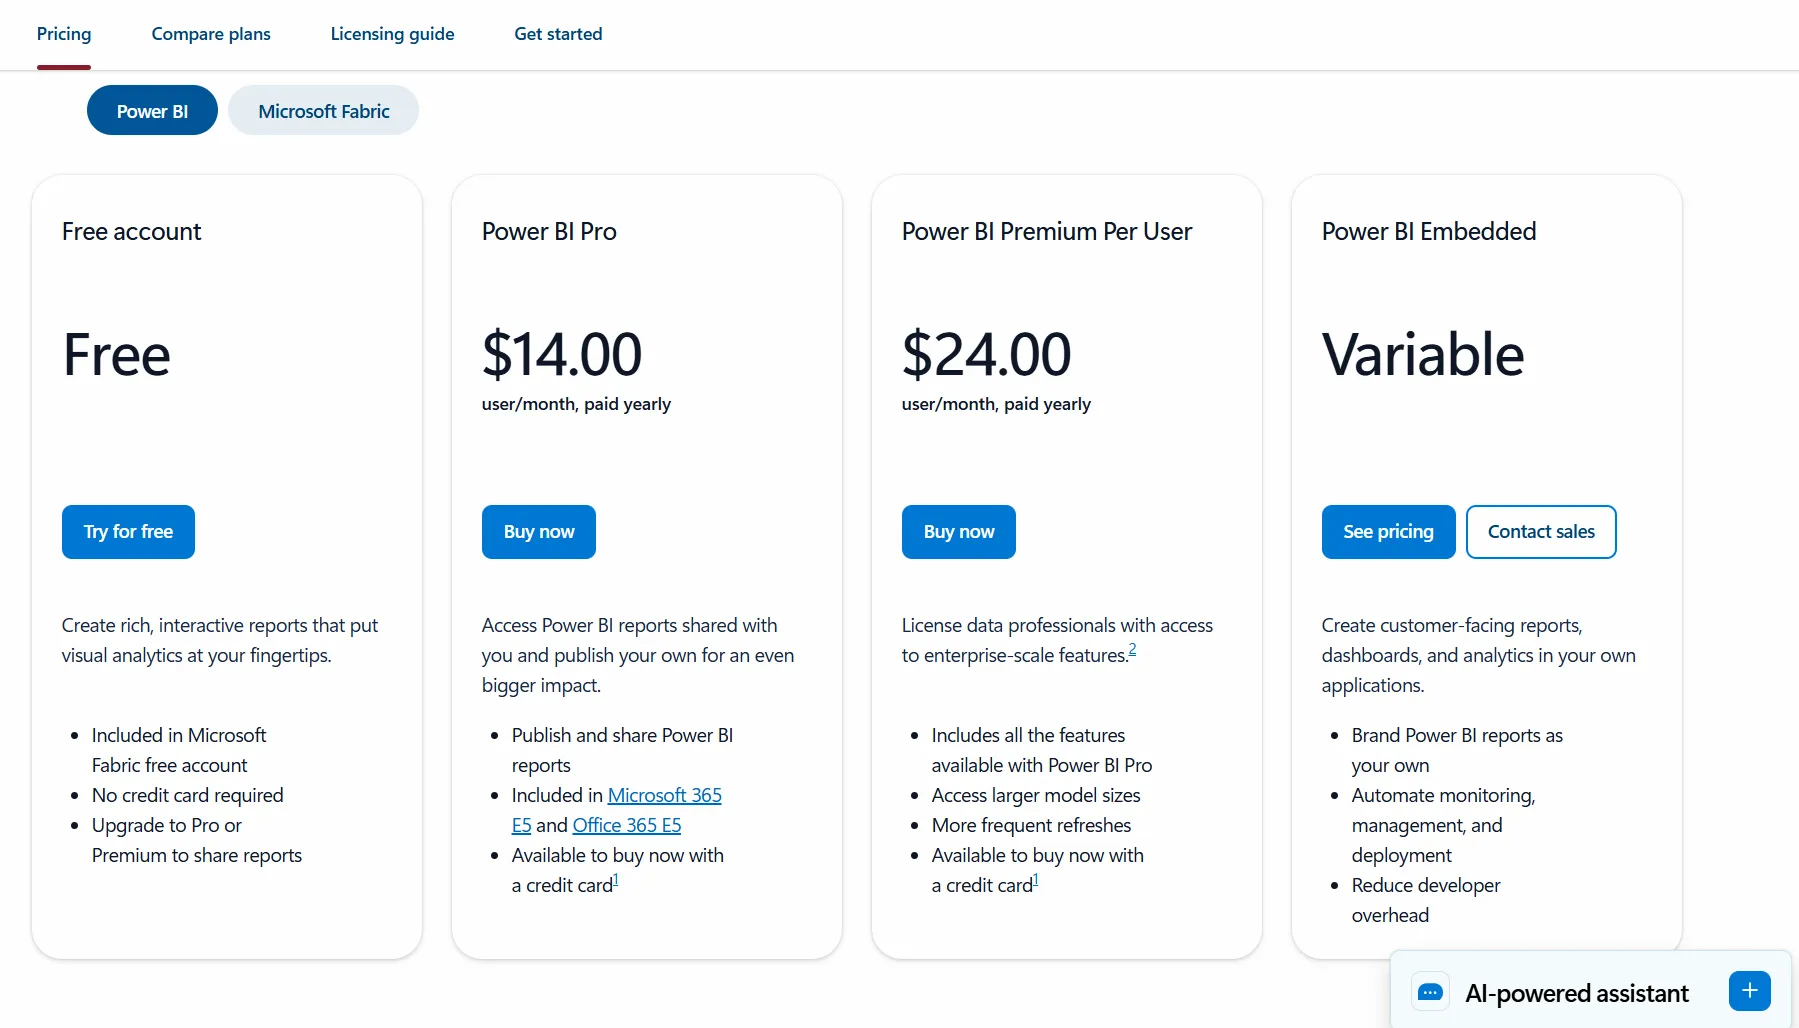
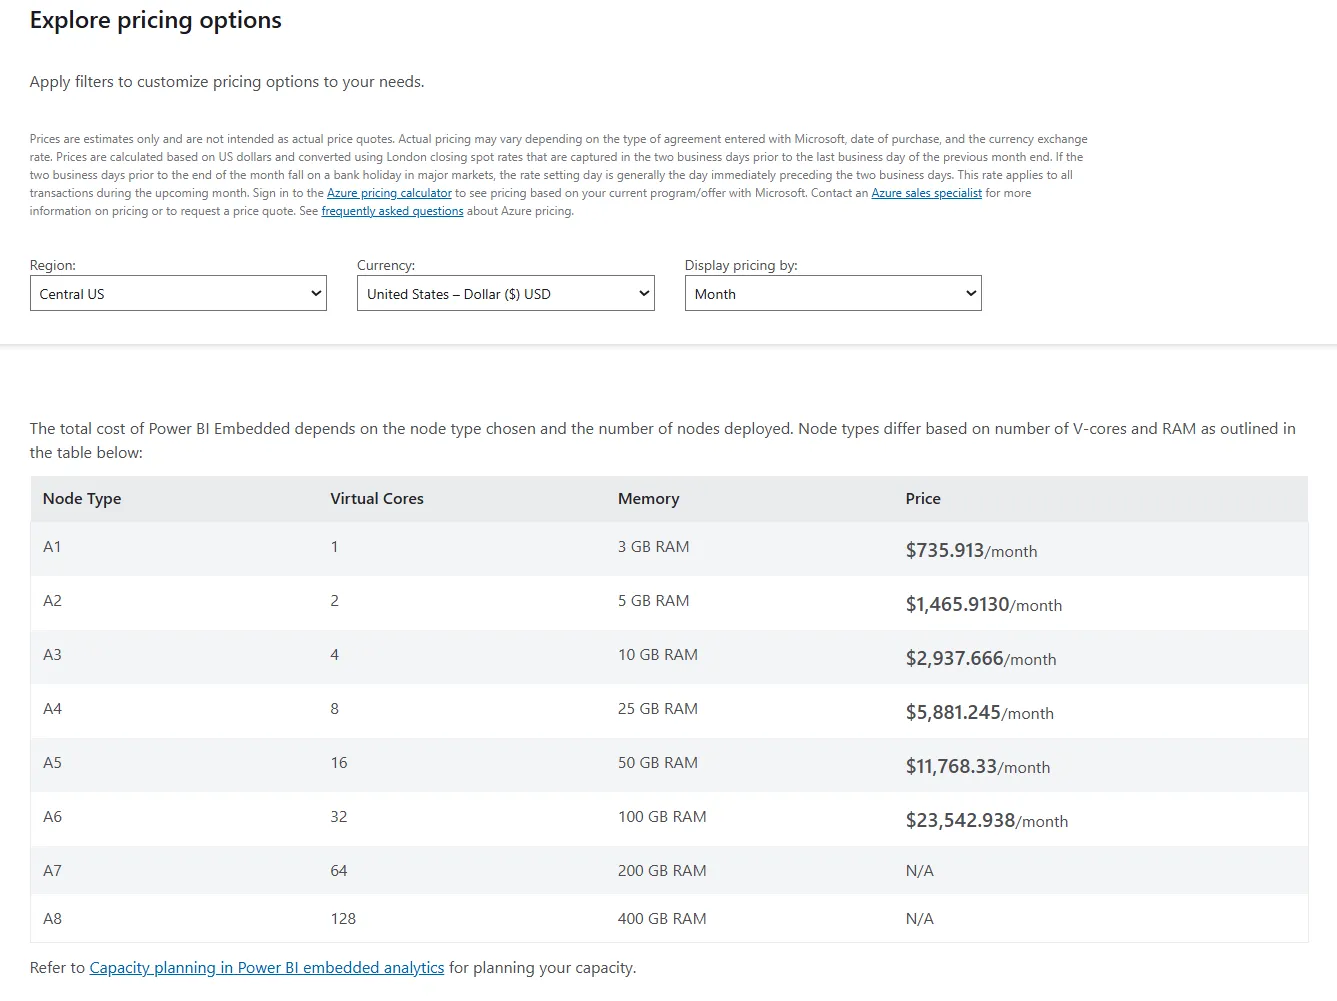
Complex embedding: Embedding requires provisioning a dedicated capacity (F‑series or A‑series), generating embed tokens and configuring authentication with Azure Active Directory. Pricing depends on the node type, ranging from about US$735 to US$23 500 per month. This makes budgeting challenging.
Limited customization: While you can adjust themes, customizing the look and feel to match your brand may require editing JSON theme files or building custom visuals.
Performance considerations: Because the product was built for internal reporting, some features (like R/Python visuals) aren’t supported for embed and others may load slowly on low‑end capacity. The deprecation of R and Python visuals in embed scenarios by May 2026 means you must redesign such reports.
Pricing complexity: Authors need a Power BI Pro license (US$10 per user per month), and high usage requires a Premium capacity or Fabric F‑SKU. For fast‑growing SaaS products, estimating costs is difficult, and overspending is common.
Not built for SaaS: Although Microsoft has improved the embed story, Power BI is still primarily used for internal reporting. Embedded analytics that feel native to your product require extra work and often feel bolted on.
Sisense vs Power BI - integrations and data sources
Both Sisense and Power BI support numerous data connectors.
Sisense integrates with major cloud warehouses (Snowflake, Google BigQuery, Amazon Redshift, Databricks), relational databases, Excel files, and SaaS apps via REST connectors. Sisense allows you to query data in place without copying it into a proprietary cube.
Power BI connects to data from multiple sources, including Oracle, SAP, Salesforce, and even streaming services via DirectQuery or power query, making it easy to blend cloud data with on‑premises sources. The ability to integrate with other Microsoft products such as Azure Data Factory and Logic Apps is a key selling point for Power BI.
Pricing comparison
Sisense pricing is opaque. Reviews on Reddit and forums suggest that you won’t get Sisense for less than about US$25 000 annually, and many users pay between US$35 000 and US$75 000 per year. Pricing depends on the number of user seats, hosting (cloud vs on‑premises), and usage. There may also be hidden costs for advanced features.
Power BI pricing is published, but the embedded model is complex. You pay for capacity nodes based on memory and virtual cores, costing roughly US$735 to US$23 500 per month. Additionally, every author needs a Power BI Pro license (US$10 per user per month). While Power BI Premium includes more capacity, it’s expensive for small startups.
Because the costs scale with usage and capacity, both tools can become costly quickly. Power BI has a lower entry point, but the unpredictable capacity model can lead to runaway expenses. Sisense has higher upfront costs but provides predictable pricing once negotiated. We suggest that you evaluate your expected data volumes, concurrency and user numbers before committing.
Verdict: can Power BI and Sisense meet your needs?
For embedded use cases, Sisense or Power BI can both deliver value, but there are trade‑offs.
Sisense provides a robust analytics platform tailored for embedding. Its rich visualization library, Compose SDK and AI features make it attractive if you want a custom experience that feels part of your app.
However, the heavy setup and higher cost may deter startups.
Power BI, meanwhile, is widely adopted, integrates with the Microsoft ecosystem and is familiar to many analysts.
It offers strong modeling, data preparation and a massive marketplace, but embedding remains complicated, theming options are limited and capacity‑based pricing can be unpredictable.
If you already use other Microsoft products or need deep integration with the Azure active directory and the microsoft fabric, Power BI may be a natural choice. If you prioritize a modern embedding experience with built‑in AI and are willing to pay for ease, Sisense may edge ahead. But for many SaaS builders, both are still harder than they should be.
A modern alternative: Luzmo
If neither Sisense nor Power BI fits your needs, consider Luzmo, an embedded analytics platform built specifically for SaaS applications. It offers four key components:
Luzmo Studio - a low‑code, drag‑and‑drop dashboard builder that lets anyone create and embed dashboards in minutes. It supports localization, responsive layouts and real‑time updates, making it easy to visualize data and customize the look and feel.
Luzmo Flex - a code‑first SDK for developers who want complete control. You can programmatically create charts, build custom components and blend Luzmo visualizations with your own UI using JavaScript.
Luzmo IQ - an AI assistant that answers questions about your data in natural language, generates summaries and charts, and integrates via chat widgets or API.
Luzmo Agentic APIs - a suite of AI‑powered endpoints to describe datasets, generate formulas, discover relevant tables and create visualizations programmatically. These APIs let you build custom agents and workflows on top of your data model.
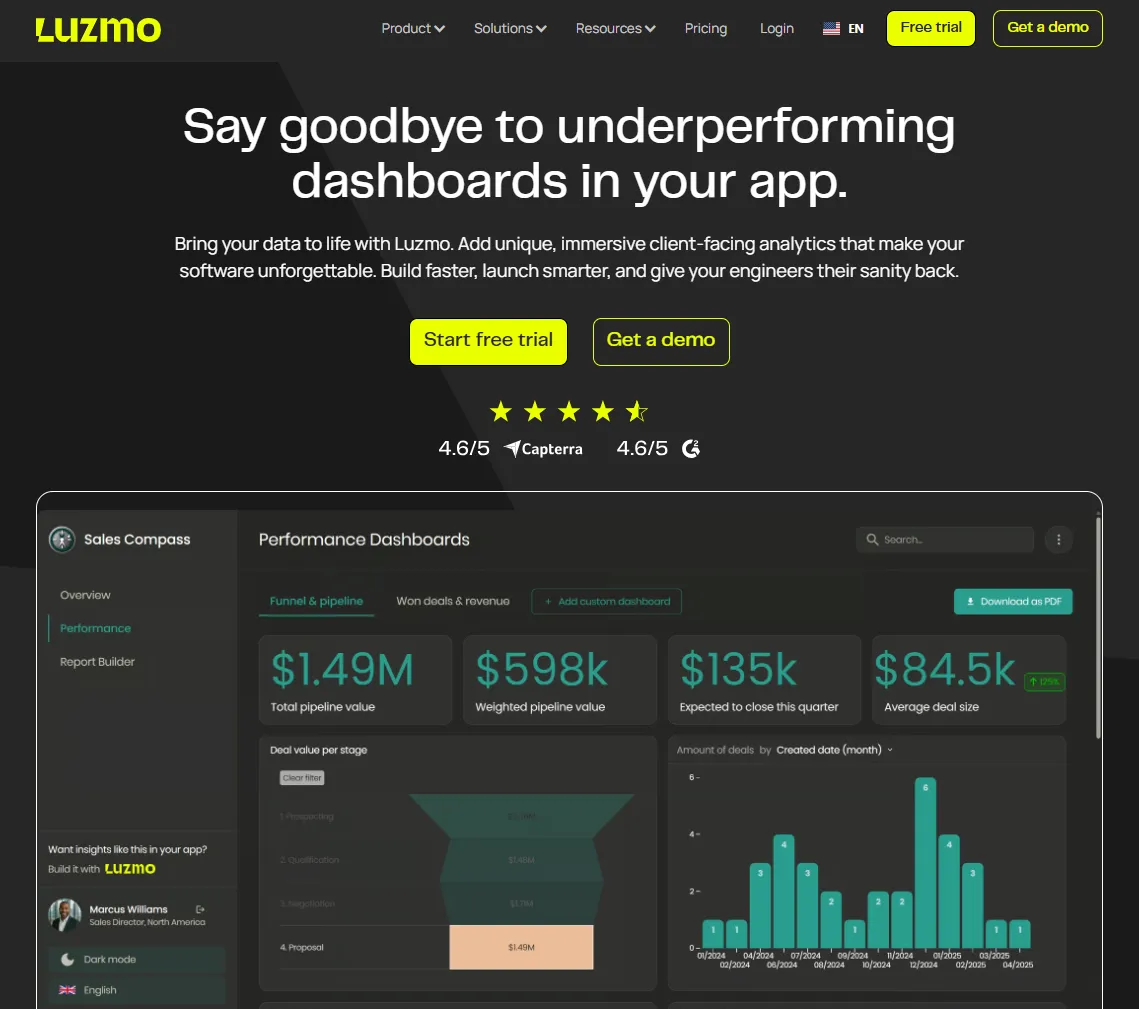
With Luzmo, you can embed your first dashboard in less than 10 days, and pricing starts at $495/month for Starter and $1,995/month for Premium, with transparent tiers and no per-query charges. Dashboards are fully customizable, and the platform is scalable to thousands of users without complex hosting. For SaaS companies that need to embed analytics quickly and provide a pleasant user experience, Luzmo offers a compelling alternative to legacy solutions.
Ultimately, Power BI and Sisense are two of many options, and the right choice depends on your budget, team skills and technical requirements.
Modern embedded solutions like Luzmo show that you don’t have to sacrifice customization or security for data to deliver value.
With the right tool, you can offer embedded analytics that feel native, handle data access securely, and give customers better insights, without the headaches of traditional business analytics platforms.
Don't wait, try Luzmo for free now.
FAQ
All your questions answered.
How do Power BI and Sisense differ as embedded analytics tools?
When teams compare Power BI and Sisense, the biggest difference lies in architecture and development workflow. Power BI and Sisense both support embedded dashboards, but each follows its own model for capacity, security and integration. Power BI ties deeply into Azure and the Microsoft ecosystem, while Sisense offers more flexibility for custom front-end experiences. This BI comparison matters most for SaaS teams that want full control over branding and interactions.
Is Sisense easier to embed than Power BI?
Sisense is built with developers in mind, and Sisense offers a modern SDK plus modular embedding options. Power BI embedding depends on Azure capacity, tokens and specific deployment steps. For many SaaS teams, the deciding factor is ease of use - Sisense tends to offer smoother setup for product teams, while Power BI requires more infrastructure knowledge.
Can both platforms handle modern data analytics workloads?
Yes. Both platforms support robust data analytics features, including semantic modeling, governance and advanced calculations. Sisense focuses on live querying, while Power BI works best with well-modeled datasets in Fabric or Premium capacity environments. Both can be extended with visual libraries or custom code for advanced scenarios.
How do Sisense and Power BI compare to other BI tools?
If you compare Sisense to newer cloud tools, it still stands out for its rich APIs and customization options. When teams compare Power BI, they often benchmark it against tools like Tableau or Looker, especially for visual quality and enterprise adoption. For organizations already invested in Microsoft, a Tableau and Power BI solution comparison often ends with Power BI leading because of ecosystem benefits.
Do these tools support real-time analytics in SaaS apps?
To an extent. Power BI uses DirectQuery and Fabric real-time pipelines, while Sisense supports live querying against operational sources. Neither is pure streaming analytics, but both can handle real-time data scenarios when tuned correctly. Most SaaS teams find Sisense slightly easier here, especially when customer dashboards need better data freshness without rebuilding models.
Can Power BI and Sisense replace legacy BI platforms?
Yes, both are strong upgrades to legacy BI tools that relied heavily on manual data prep or desktop-only workflows. Power BI brings deep modeling and Fabric integration, while Sisense provides flexible embedding and a modern developer-focused framework.
How well do Power BI and Sisense integrate with external systems?
Power BI connects seamlessly to Microsoft services, and Power BI is widely adopted in enterprise workflows. Sisense supports warehouse-native querying and flexible embedding through JavaScript, Git integration and cloud connectors. Both platforms offer strong extensibility, but Power BI has more built-in connectors because of the size of the Microsoft ecosystem.
Which one is better for teams that want to analyze data inside their SaaS product?
Both platforms let end users analyze data through dashboards, filters and semantic models. Sisense leans toward customization and a native-feel design, while Power BI focuses on governed modeling and standardized reporting. If you want embedded dashboards that blend into your UI, Sisense provides more flexibility; if you want tight alignment with enterprise IT, Power BI may be a better fit.
Written by

Ship the future of your data
Let us show you what Luzmo can do for your product.

Leave your e-mail and one of our analytics experts will reach out to you