Looker vs Tableau: Which is The Better BI Tool for SaaS In 2026?
Looker vs Tableau: Which is The Better BI Tool for SaaS In 2026?
SaaS development might seem simple at first: build a useful tool, market it and scale. Hidden beneath every successful product, however, is a business intelligence (BI) layer that turns raw information into actionable insights.
In 2026 and beyond, BI platforms empower SaaS teams to unlock critical data for their users and underpin embedded analytics experiences.
This guide compares Looker (now part of Google Cloud) and Tableau, two long‑standing BI tools that help you create powerful dashboards.
We highlight functionality, ease of use, pricing and use cases, including embedded analytics. We also introduce Luzmo, a modern alternative built for SaaS.
Why business intelligence matters for SaaS
Modern SaaS applications collect a wealth of metrics (user engagement, performance, revenue) and customers expect to explore this data directly within your product. BI tools allow users to query and visualize datasets without having to code. Embedded analytics lets you integrate dashboards into your app so customers can analyse data without leaving it.
Looker and Tableau are both business intelligence tools with strong capabilities beyond embedding. Each platform can connect to almost any data source, provide data modelling and deliver real‑time data and advanced analytics. Choosing the right BI solution is critical for customer adoption, retention and revenue growth.
Looker vs Tableau: key features
Looker
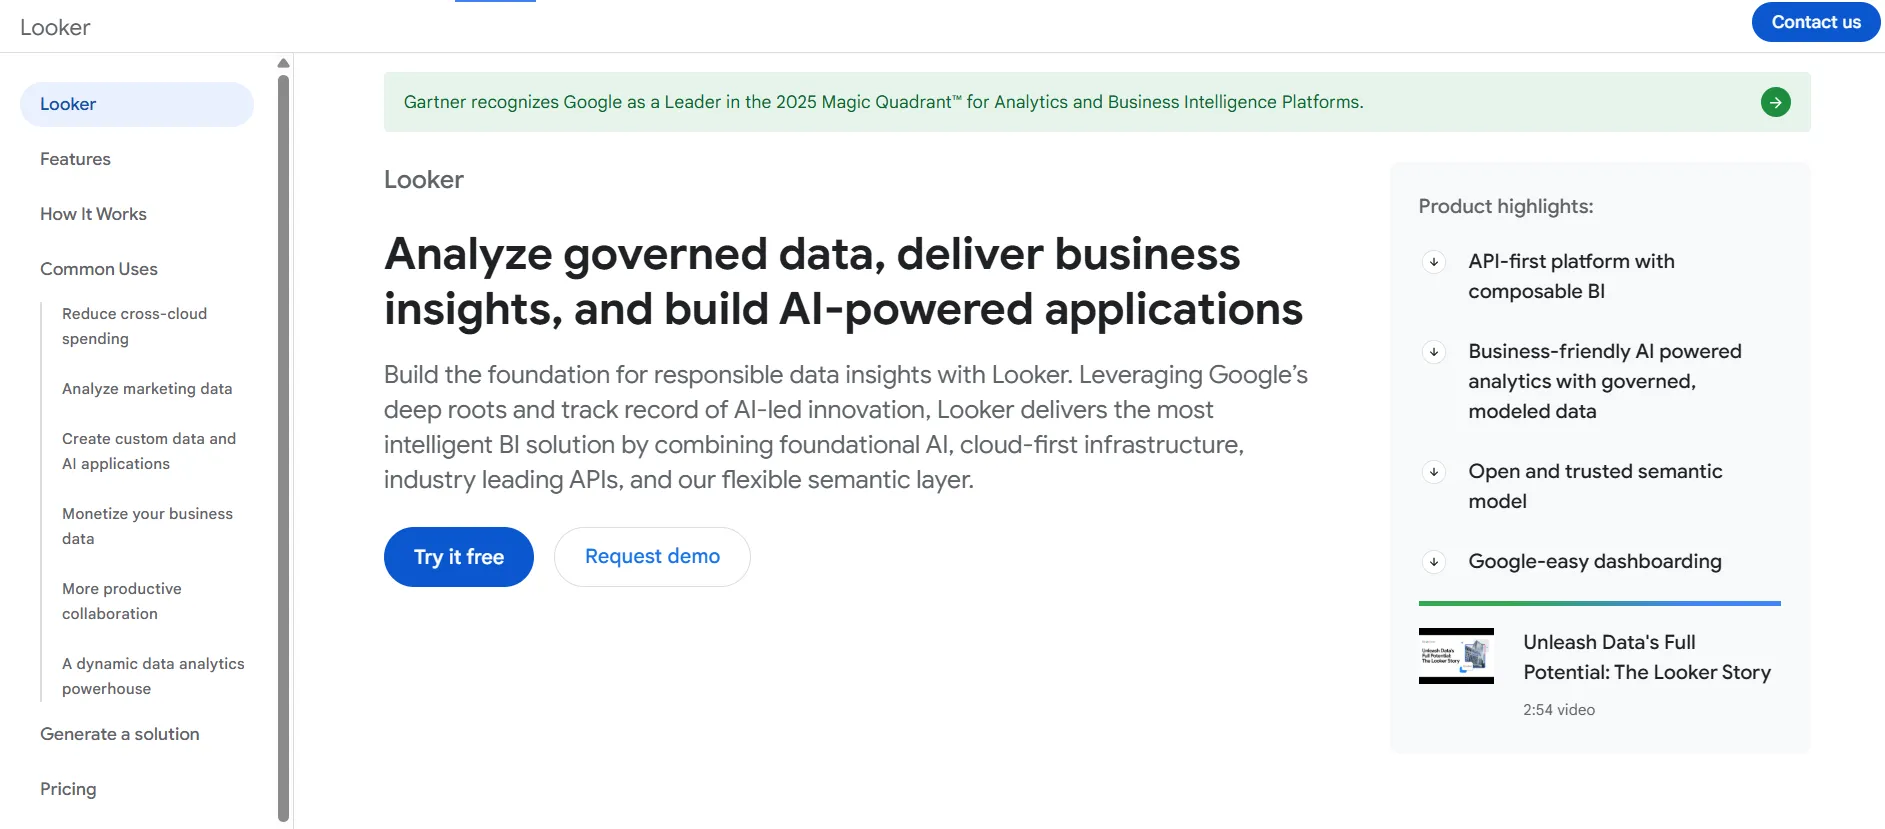
Looker, sometimes called Looker Platform (not to mistake it with Looker Studio), sits at the centre of the Google Cloud analytics stack. Its strengths lie in data modelling, governance and extensibility:
LookML modelling - Looker uses a proprietary modelling layer (LookML) to define reusable metrics and logic. Teams can build consistent data models that analysts and business users share, making it a powerful BI platform for large data teams.
Embedded analytics via APIs - Looker allows companies to embed dashboards and reports into SaaS apps. Its RESTful API and Looker Blocks (pre‑built modules) enable deep customization and integration with other Google services such as BigQuery, Data Studio and Google Data connectors.
Custom visualizations - While Looker’s native chart library is smaller than competitors, it supports custom visualizations via JavaScript libraries like D3.js. Developers can tailor dashboards for specific use cases, such as complex network graphs or custom maps.
Data governance & collaboration - Strong governance features ensure consistent metrics across reports. Looker integrates with Google Cloud authentication and supports granular permissions, making it ideal for organizations needing strict control.
AI‑powered analytics - In 2025 Looker introduced generative‑AI capabilities powered by Google’s Gemini models. Users can ask natural‑language questions and get dashboards automatically generated. The AI features include a Conversational Analytics agent that builds charts from plain language and a Visualization Assistant that produces reports, slides and LookML code suggestions. These additions simplify self‑service and help non‑technical users explore data without SQL.
2025 product improvements - Looker Studio added responsive report layouts, hide/remove fields, improved scorecard and pivot tables, multi‑column sorting and a data preview in the data‑source editor. These updates made dashboards easier to build and maintain.
Tableau
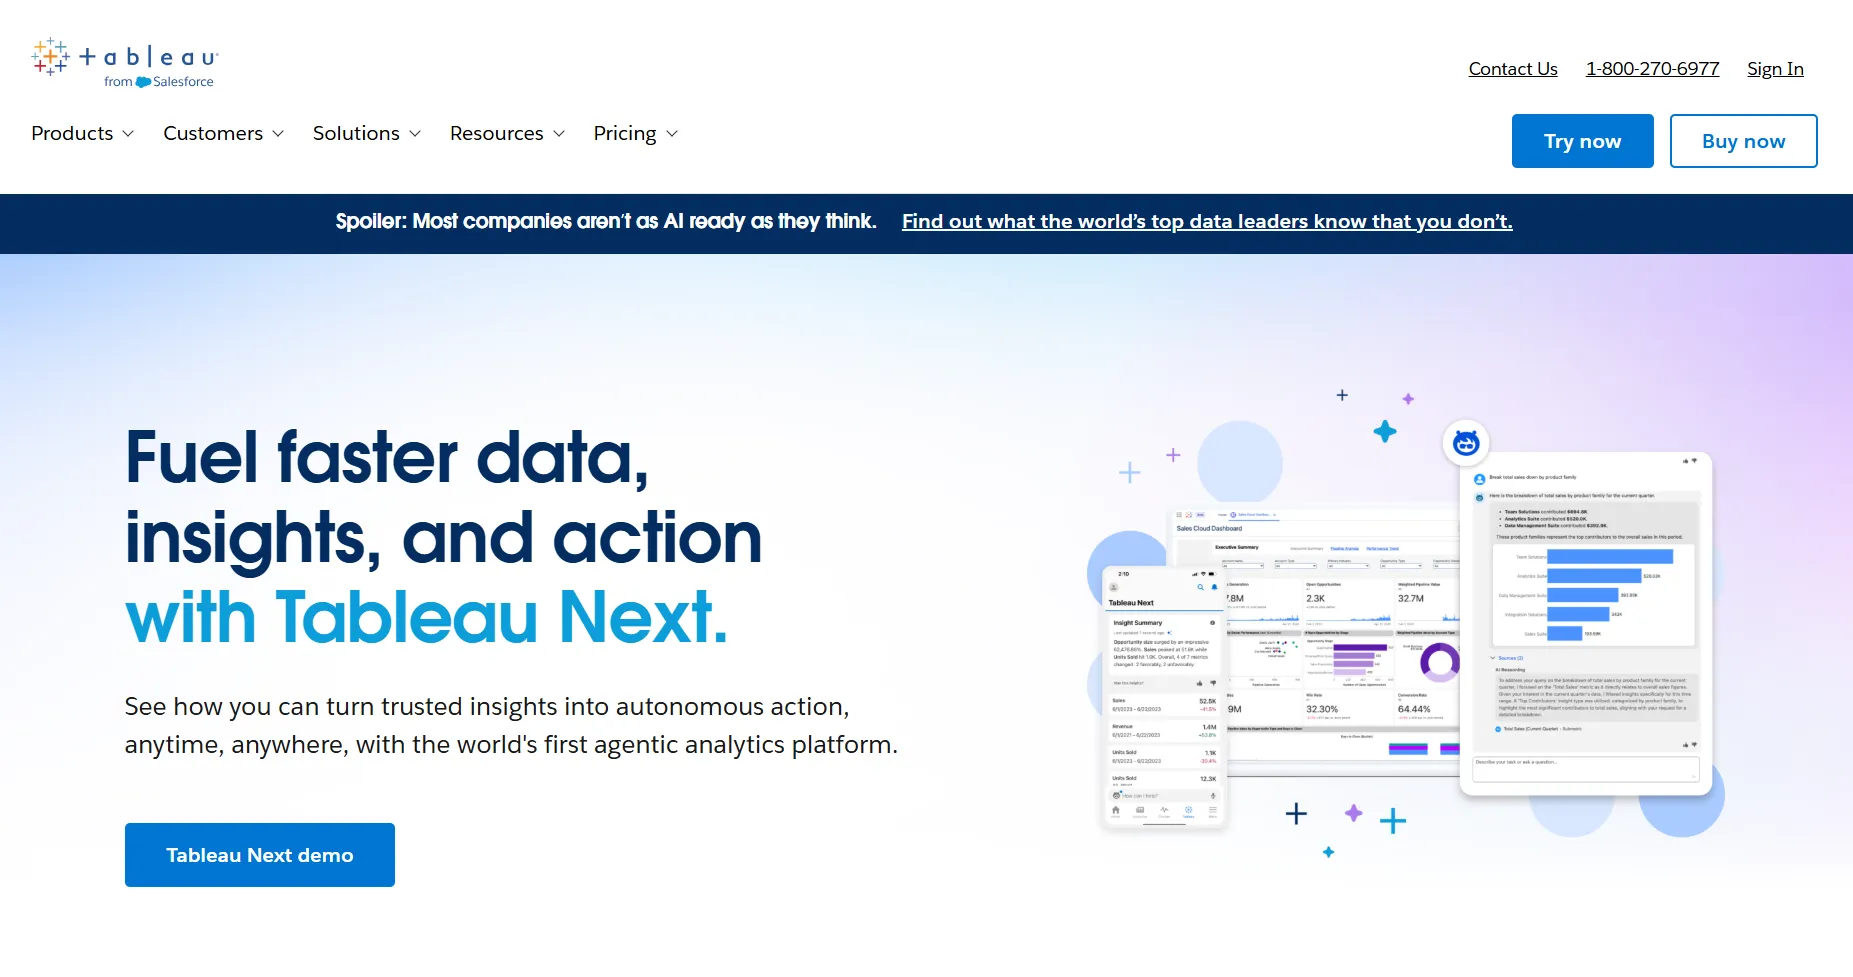
Tableau, now a part of Salesforce, remains one of the most recognised data visualization tools. It excels in ease of use and visual storytelling:
Interactive dashboards - with a drag‑and‑drop interface and extensive chart library, Tableau allows business users to create visually rich dashboards quickly. It includes mapping and geospatial visualizations, pre‑built templates and custom colour palettes.
Ask Data and AI features - Tableau’s Ask Data lets users ask questions in plain language and get insights. In 2025 Tableau introduced Concierge - a conversational assistant that inherits context from dashboards and provides recommended next actions, along with Semantic Learning for more accurate responses.
Agentic analytics and embedding - Tableau’s MCP Server and External Embedding SDK allow developers to embed agent‑driven analytics into any web app. Published data sources can be pulled into the Tableau Semantic Layer, making it easier to share models across workbooks. The November 2025 release also added ad‑hoc calculations, colour customisation and improved dashboard layout tools.
Integration & data connectors - Tableau provides native connectors to hundreds of databases (Snowflake, Redshift, BigQuery, SQL Server and more). It integrates well with Microsoft and Salesforce ecosystems and supports Tableau Desktop, Tableau Server, Tableau Cloud (formerly Tableau Online) and Tableau Public.
AI/ML pricing - Tableau’s AI capabilities, such as Concierge and predictive modelling, are available through Tableau Cloud and may require a Tableau+ bundle or additional licences.
Looker vs Tableau: ease of use
Choosing between Looker or Tableau often comes down to usability:
Looker - This platform is geared toward data teams comfortable with SQL and modelling languages. LookML requires training, but once models are defined, business users can run queries and create dashboards without writing code. Collaboration features and version control allow data analysts to work across departments. Because Looker is cloud‑based and browser‑based, there’s no heavy client to install (unlike Tableau Desktop). However, some users note that Looker’s UI can be less intuitive than drag‑and‑drop tools, and advanced features may require a developer.
Tableau - Renowned for its friendly interface, Tableau uses intuitive drag‑and‑drop workflows. Non‑technical users can build dashboards quickly using templates and pre‑built BI solutions. Tableau Online and Tableau Cloud provide browser‑based design, while Tableau Desktop offers offline development. Advanced users can integrate Python or R for data science, but most features remain accessible without coding. Its ease of use makes it the best fit for companies wanting to empower business users quickly.
Looker vs Tableau: pricing (2026)
Looker pricing continues to be opaque. Google Cloud offers Standard, Enterprise and Embed editions, and you must contact sales for a quote. Community reports suggest costs starting around $35,000 per year with viewer licences near $30 per user/month, creator licences around $60 per user/month and developer licences about $120 per user/month. These figures vary widely, and there is no free trial. An Embed Edition for external analytics can exceed six figures annually. Most of Looker’s pricing depends on user counts, query volume and API calls, and costs can scale to hundreds of thousands of dollars.
Tableau pricing is more transparent. The Creator licence for Tableau Cloud costs about $70 per user per month (or $35 per month for an on‑prem Tableau Server licence). The Explorer licence is around $42 per user per month, while Viewer licences start at $15 per user per month. Enterprise plans (including advanced management and governance) run about $115 per user per month. Note that AI features like Concierge may require additional licensing, such as the Tableau+ bundle.
Alternatives and embedded analytics: introducing Luzmo
Both Looker and Tableau offer embedded capabilities, but each comes with complexity and cost. Luzmo is a modern BI solution built specifically for SaaS companies that need fast, flexible embedded analytics.
Luzmo IQ - An AI‑powered assistant that allows end users to ask questions in natural language and receive accurate insights. It leverages automated vector embeddings and includes chat widgets, executive summaries, search and workflow APIs. Unlike Looker’s complex modelling, Luzmo IQ can be deployed quickly and supports fine‑grained access control.
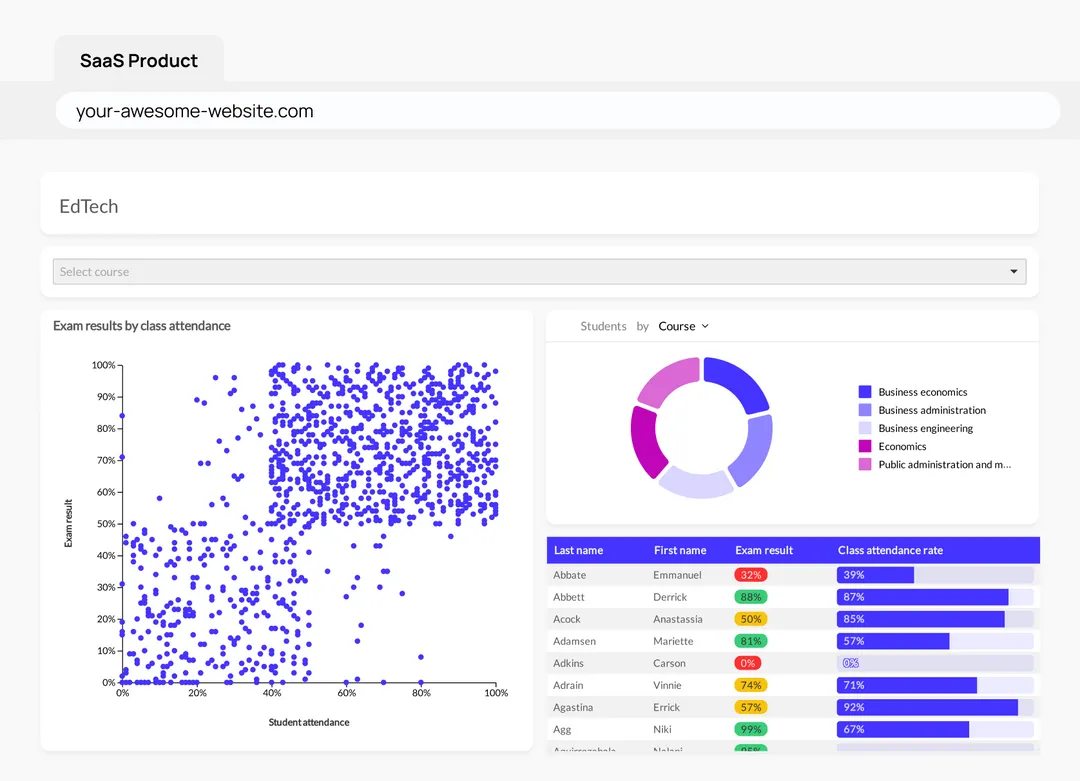
Luzmo Studio - A drag‑and‑drop dashboard builder offering over 40 chart types, drill‑down interactions and responsive design. It includes multi‑language, multi‑time‑zone and multi‑currency support, row‑level security and caching for high performance. Studio is ideal for business users who want self‑service analytics without writing code.
Luzmo Flex - A code‑first SDK that allows developers to programmatically create dashboards, combine them with custom UI components and build complex data products like report builders or AI‑powered chart generators. Flex supports unlimited scalability and automation behind the scenes.
Agentic APIs - Modular AI endpoints that can describe datasets and columns, perform semantic search, generate formulas, produce visualizations and provide conversational chat experiences. Agents can be chained for cross‑workflow automation and integrate with external tools. This agentic approach helps teams accelerate development of new analytics features.
Luzmo’s transparent pricing and purpose‑built architecture make it a strong alternative to Looker and Tableau for SaaS teams seeking embedded analytics without high costs or long implementation times.
It's designed for clarity and scalability, unlike Looker’s opaque contracts or Tableau’s per-user licensing model. Plans start at €495/month for Starter and €1,995/month for Premium, with Enterprise options available for larger deployments. Combined with Luzmo Studio for dashboard creation, Luzmo IQ for natural-language analytics, and Luzmo AI for automatic chart and insight generation, teams can deliver embedded analytics without worrying about unpredictable costs or scaling user fees.
Leveraging Looker and Tableau for complex data needs
Businesses dealing with complex data from multiple sources need tools that can scale across data warehouses, support data team workflows and handle real‑time data. Looker and Tableau each offer advanced capabilities:
Looker for enterprise data modelling – Looker integrates deeply with Google BigQuery, Redshift and other data warehouses. Looker Blocks and the Looker Marketplace provide pre‑built models for common verticals like marketing or finance. With Looker Studio updates (responsive layouts, hide/remove fields, multi‑column sorting, query variables and gridline options), teams can develop interactive dashboards faster. The 2025 AI features mean data analysts can ask conversational questions or use the AI code interpreter to generate Python for advanced analytics. Looker is often considered ideal for organizations that require robust governance, large‑scale data pipelines and code‑based modelling. Many companies compare Looker vs Tableau vs other BI platforms like Power BI or Sisense when deciding on the best BI tool.
Tableau for visual exploration and analytics – Tableau excels at data visualization and interactive analytics. With Tableau Dashboards, business users can drill down into granular metrics and create pixel‑perfect presentations. The platform supports ETL through Tableau Prep and offers connectors to almost every data source. Tableau’s 2025 releases add MCP Server for secure agentic analytics, Semantic Learning and advanced embedding options. Many analysts still use Tableau Desktop for offline analysis and publish dashboards to Tableau Cloud or Tableau Server. Looker users sometimes migrate to Tableau for its ease of use, while Tableau users adopt Looker for its governance and modelling.
Large enterprises might use both: Looker for curated models and governed metrics, and Tableau for ad‑hoc visualization and data storytelling. Deciding between Looker and Tableau often involves evaluating your data team’s expertise, your governance requirements and whether you prefer a browser‑based or desktop experience.
Deciding between Looker and Tableau: other BI tool comparisons
If you’re still on the fence or want to compare Looker vs Tableau vs other BI tools, consider exploring:
- QuickSight vs Tableau - Compare Amazon QuickSight (now part of the agentic Amazon Quick Suite) with Tableau, focusing on AWS integration, pricing model and scalability. QuickSight offers per‑user and capacity pricing for readers and authors and integrates seamlessly with AWS services.
- Looker vs Domo - Evaluate how Looker integrates with data warehouses versus Domo’s App Studio and Magic ETL. Looker excels in modelling and governance, while Domo focuses on self‑service and pre‑built workflows.
- ThoughtSpot vs Looker - ThoughtSpot’s AI‑powered search and natural language queries differentiate it from Looker’s LookML modelling. Consider ease of use versus modelling flexibility.
- Domo vs Tableau - Domo offers a cloud‑based BI solution with drag‑and‑drop dashboards and is often compared to Tableau for its real‑time integrations and consumption‑based pricing models.
- Power BI vs Tableau - Microsoft’s Power BI provides strong integration with Office 365 and Azure and typically has lower licensing costs than Tableau.
- ThoughtSpot vs Tableau - ThoughtSpot’s AI search engine is compared to Tableau’s visualization capabilities and AI features like Concierge.
- Looker vs Sisense - Compare Looker’s code‑based semantic layer with Sisense’s Elasticubes and Compose SDK for embedded analytics.
Exploring these comparisons can help you choose the best BI tool for your real-time data analysis needs.
Tableau vs Looker conclusion + alternative to Looker and Tableau
Selecting Looker or Tableau depends on your priorities. If your organization values data governance, LookML modelling, and deep integration with Google Cloud (including Google BigQuery and other data warehouse tools), Looker may be the right fit. It shines when data teams are comfortable with SQL and need to build robust semantic models. However, its high price and long learning curve can be a barrier.
If you prioritise data visualization, ease of use and quick setup for business users, Tableau is hard to beat. Its drag‑and‑drop interface, pre‑built visualizations and newer AI capabilities make it accessible. Tableau’s transparent pricing and broad ecosystem (including Tableau Desktop, Tableau Cloud and Tableau Server) add to its appeal.
For SaaS companies embedding analytics, both tools provide solutions but can be complex and costly. Luzmo offers a strong alternative with an intuitive Studio, AI‑powered IQ, developer‑friendly Flex SDK and Agentic APIs. Its pricing is transparent, and it’s built specifically for seamless embedding into SaaS applications.
Ultimately, deciding between Tableau and Looker comes down to evaluating your business needs, data culture and desired user experience. For complex modelling and governed metrics, use Looker as it's often the choice; for interactive dashboards and rapid deployment, Tableau excels. And if you’re looking for a flexible, affordable option for embedded analytics, a tool like Luzmo may be the best fit for your product. Try it for free now.
Written by

Ship the future of your data
Let us show you what Luzmo can do for your product.

Leave your e-mail and one of our analytics experts will reach out to you