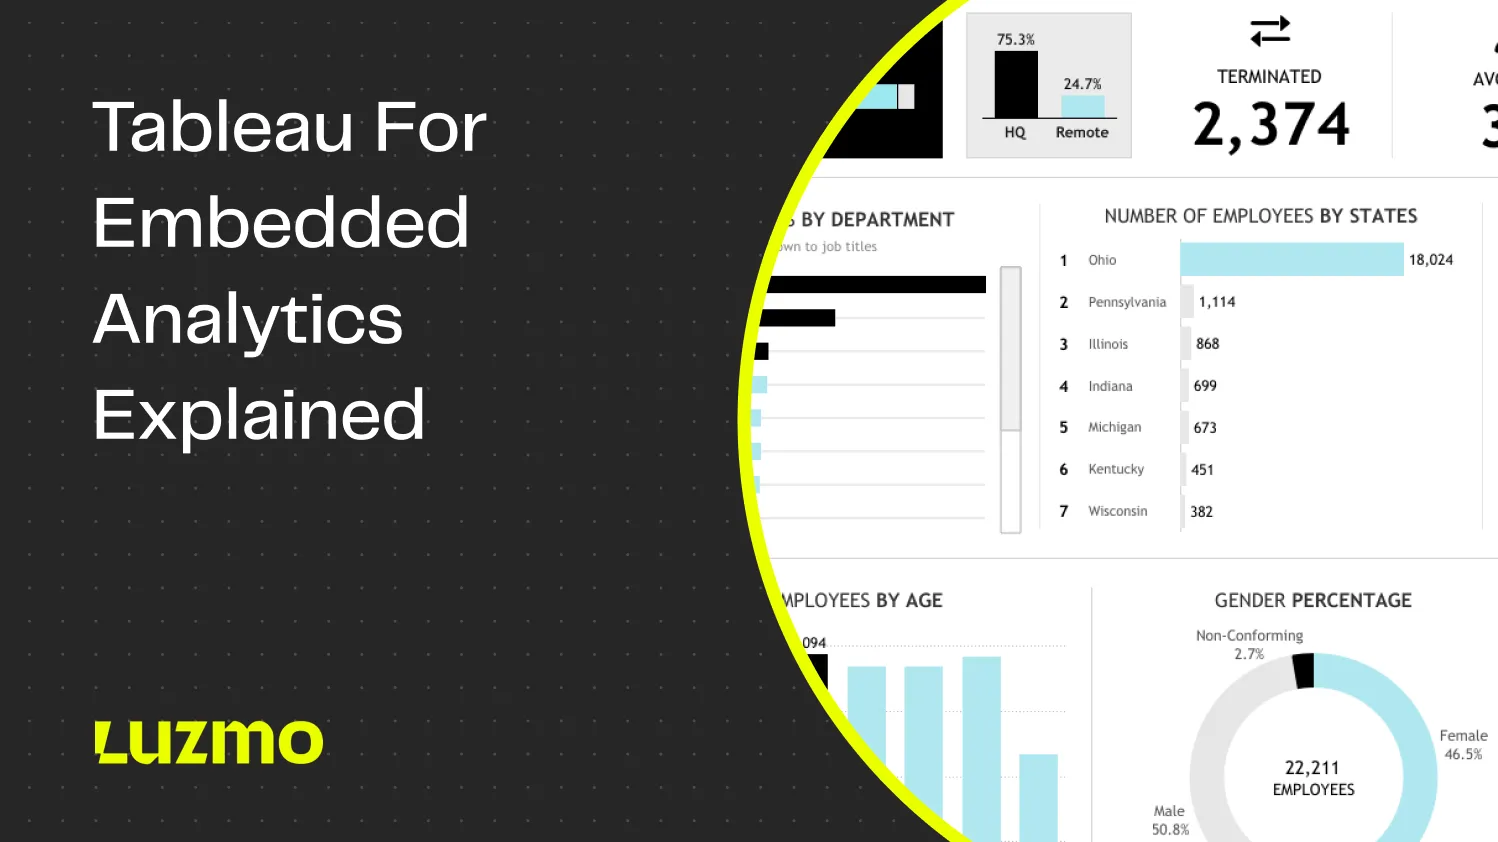
Tableau for Embedded Analytics Explained + Tableau Pricing
Even if you’ve never worked on business intelligence, there is a good chance you’ve heard of Tableau. Owned by Salesforce, this analytics platform allows businesses to analyze, explore, and visualize data from a variety of data sources. On top of their standard offer for teams, there is Tableau Embedded – for those who want to add interactive dashboards to their website or app.
If you already use Tableau, then using the Embedded portion of the app is a logical choice. But what if you’re looking for your next embedded analytics solution and wondering if Tableau is the right choice?
Today, we take a look at Tableau for embedded applications. We’ll cover everything from ease of use, features, connectivity, pricing, and more.
Tableau Embedded: features, use cases, and data management capabilities
Tableau Embedded is an offering that allows you to add Tableau dashboards to a website or app.
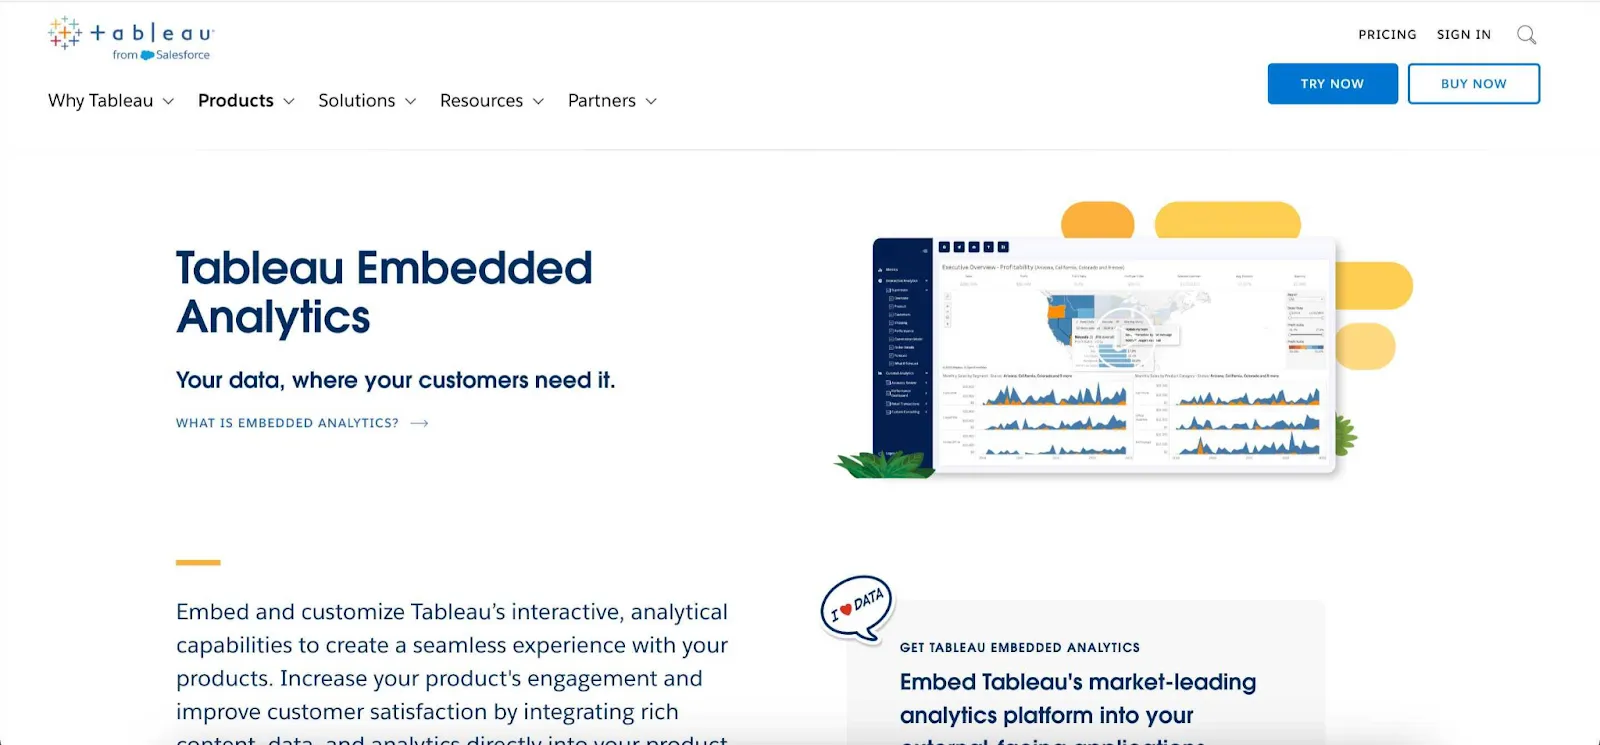
Traditionally, within Tableau, you can share your dashboard via Tableau Public – which is a link that you can share with people inside your organization. Tableau Embedded, on the other hand, is all about taking those dashboards and integrating them into your SaaS product or website, so that they look like a part of that website, rather than a standalone dashboard. Thanks to Tableau’s powerful API and enterprise grade data management capabilities, you can easily take their dashboards and embed them into various web portals and apps. For end-users of your app, it allows for easier decision-making through visual analytics.
Tableau Cloud or Server? Choose the right edition for embedded use
Do you need just Tableau or some of the many additional tools in their offering? If you’re just getting introduced to this app, you may be confused with some of them. For example, what’s the difference between Online and Embedded?
If you have your own app, you may be wondering if it’s worth going through the trouble to get Tableau Embedded, when the Online tool will do the job.
Here is the difference: Tableau Online is just that, an online version of your dashboard that registered users can access with single sign-on. Just give your users access to the platform and they can log into Tableau and view your dashboards using a viewer license or explorer license.
Tableau Embedded allows you to make the dashboard an integral part of your website or app. There is no need for additional authentication and it encourages the user to stay in the app and explore their full data, rather than going to Tableau. Whether you deploy through Tableau Cloud or Server, the embedded dashboards behave like native product features.
Creating dashboards with a creator license and strong data management tools
No matter if you want to embed them or not, Tableau allows you to create visualizations fairly easily. Once you get started and connect your data sources, you have a wide choice of visualizations for modern analytics. It’s not particularly beginner-friendly, but thanks to a huge Tableau community, you’ll find your way around it fairly quickly.
You’ll likely need to work in Tableau Desktop to build and publish dashboards. From there, you can work with published data sources and use Tableau Prep Builder for more advanced data preparation tasks like cleaning, joining, and shaping your datasets before visualization.
How to embed dashboards using Tableau Cloud or Server deployment
The embedding playground is actually easier than building the dashboards in the first place. When you have a finished dashboard that improves your customer experiences, you’ve done the hard part.
The dashboards are embedded using Tableau Embedding API, which is a type of JavaScript API that almost every good web developer is familiar with. It injects the functionalities of Tableau in a web environment, allowing the developer to add Tableau content to the website or app in a few clicks.
Basic knowledge of JavaScript and HTML should be enough to embed the most basic dashboards on your web page. For anything more complex, you’ll have to do extensive research or have a Tableau expert on demand.
For example, if you want to show different versions of one dashboard to different users, customize your language, timezone or currency, or show different types of dashboards on different devices. For this kind of embedding, you’re going to need a Tableau expert.
Why Tableau might not be the right edition for your team’s needs
If you’re already using Tableau for on-premises or cloud data analytics and you need real-time embedded analytics, it may make sense to use Tableau Embedded. However, if you don’t already use a data analytics platform, going for Tableau immediately is a bit of a risky move.
Getting started with this tool can be extremely difficult, especially if you don’t have team members who worked in Tableau before. The embedding is not the difficult part – creating the dashboards and making them work is.
Speaking of which, many Tableau users will complain that getting anything more complicated than a simple pivot table is going to require some workaround. You’ll need to do a bit of digging to find alternative solutions. Luckily, the community is pretty active and supportive – which can’t be said for the Tableau customer support team.
Then there is the issue of performance – many users complain that dashboards keep crashing because of poor server performance. And if you have lots of data that you’re pulling, the dashboards will load very slowly and impact your end-user experience. Even with performance optimized configurations, issues persist with large-scale use cases.
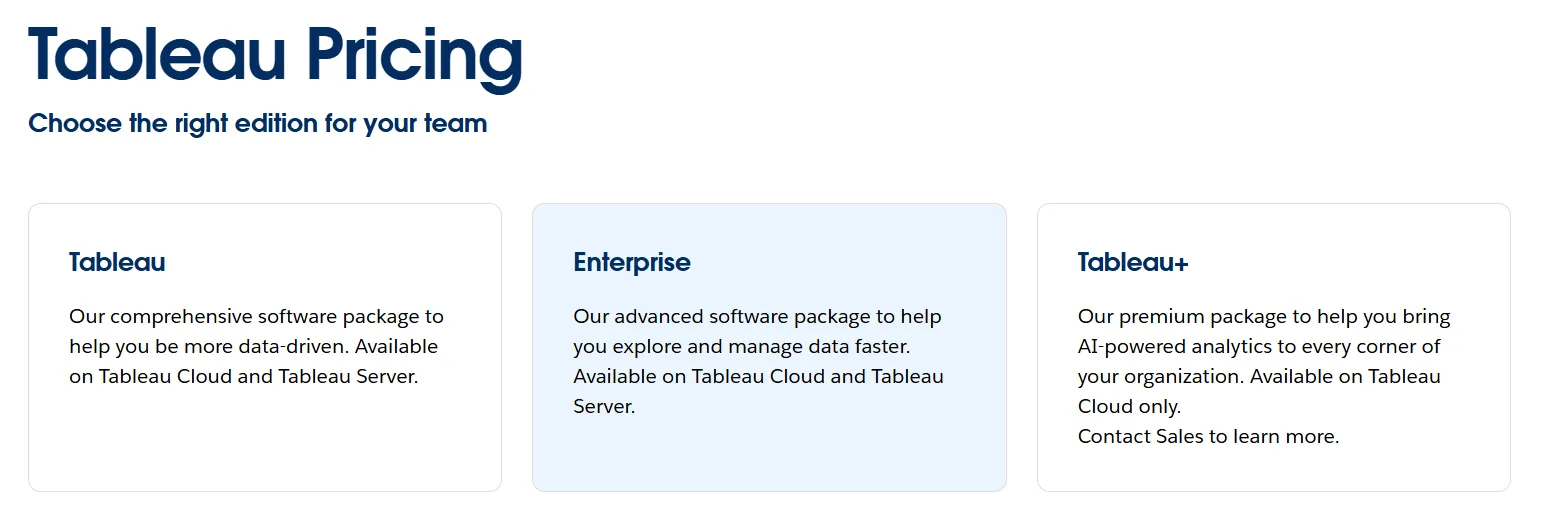
Understanding Tableau pricing: Creator, Explorer and Viewer Licenses explained
Unlike the main aspect of their product, the pricing for the embedded analytics part is not transparent. If you want to find out how much it costs to embed a dashboard you built in Tableau, you have to reach out for a custom pricing quote.
If you do just a few minutes of research, you’ll figure out that just getting in touch with sales is easier than finding the answer on your own. You’re going to need one Creator license to get started, and each creator in your team needs one for themselves.
So, that’s $115 per user month billed annually for your dev team. Also, you need to pay for every person who accesses your dashboards. On top of that, you’re going to need a core Tableau Server with advanced management or Tableau Cloud license, depending on whether you want to deploy the dashboard on a local server first before pushing it to the cloud.
Then there is the issue of end-users. Tableau embedding offers different options. You can use it for self-service analytics, where the users can access the dashboards and create their own analytics experience by changing the data visualizations, widgets, and more. Or they can be simple viewers who need access to Tableau Analytics.
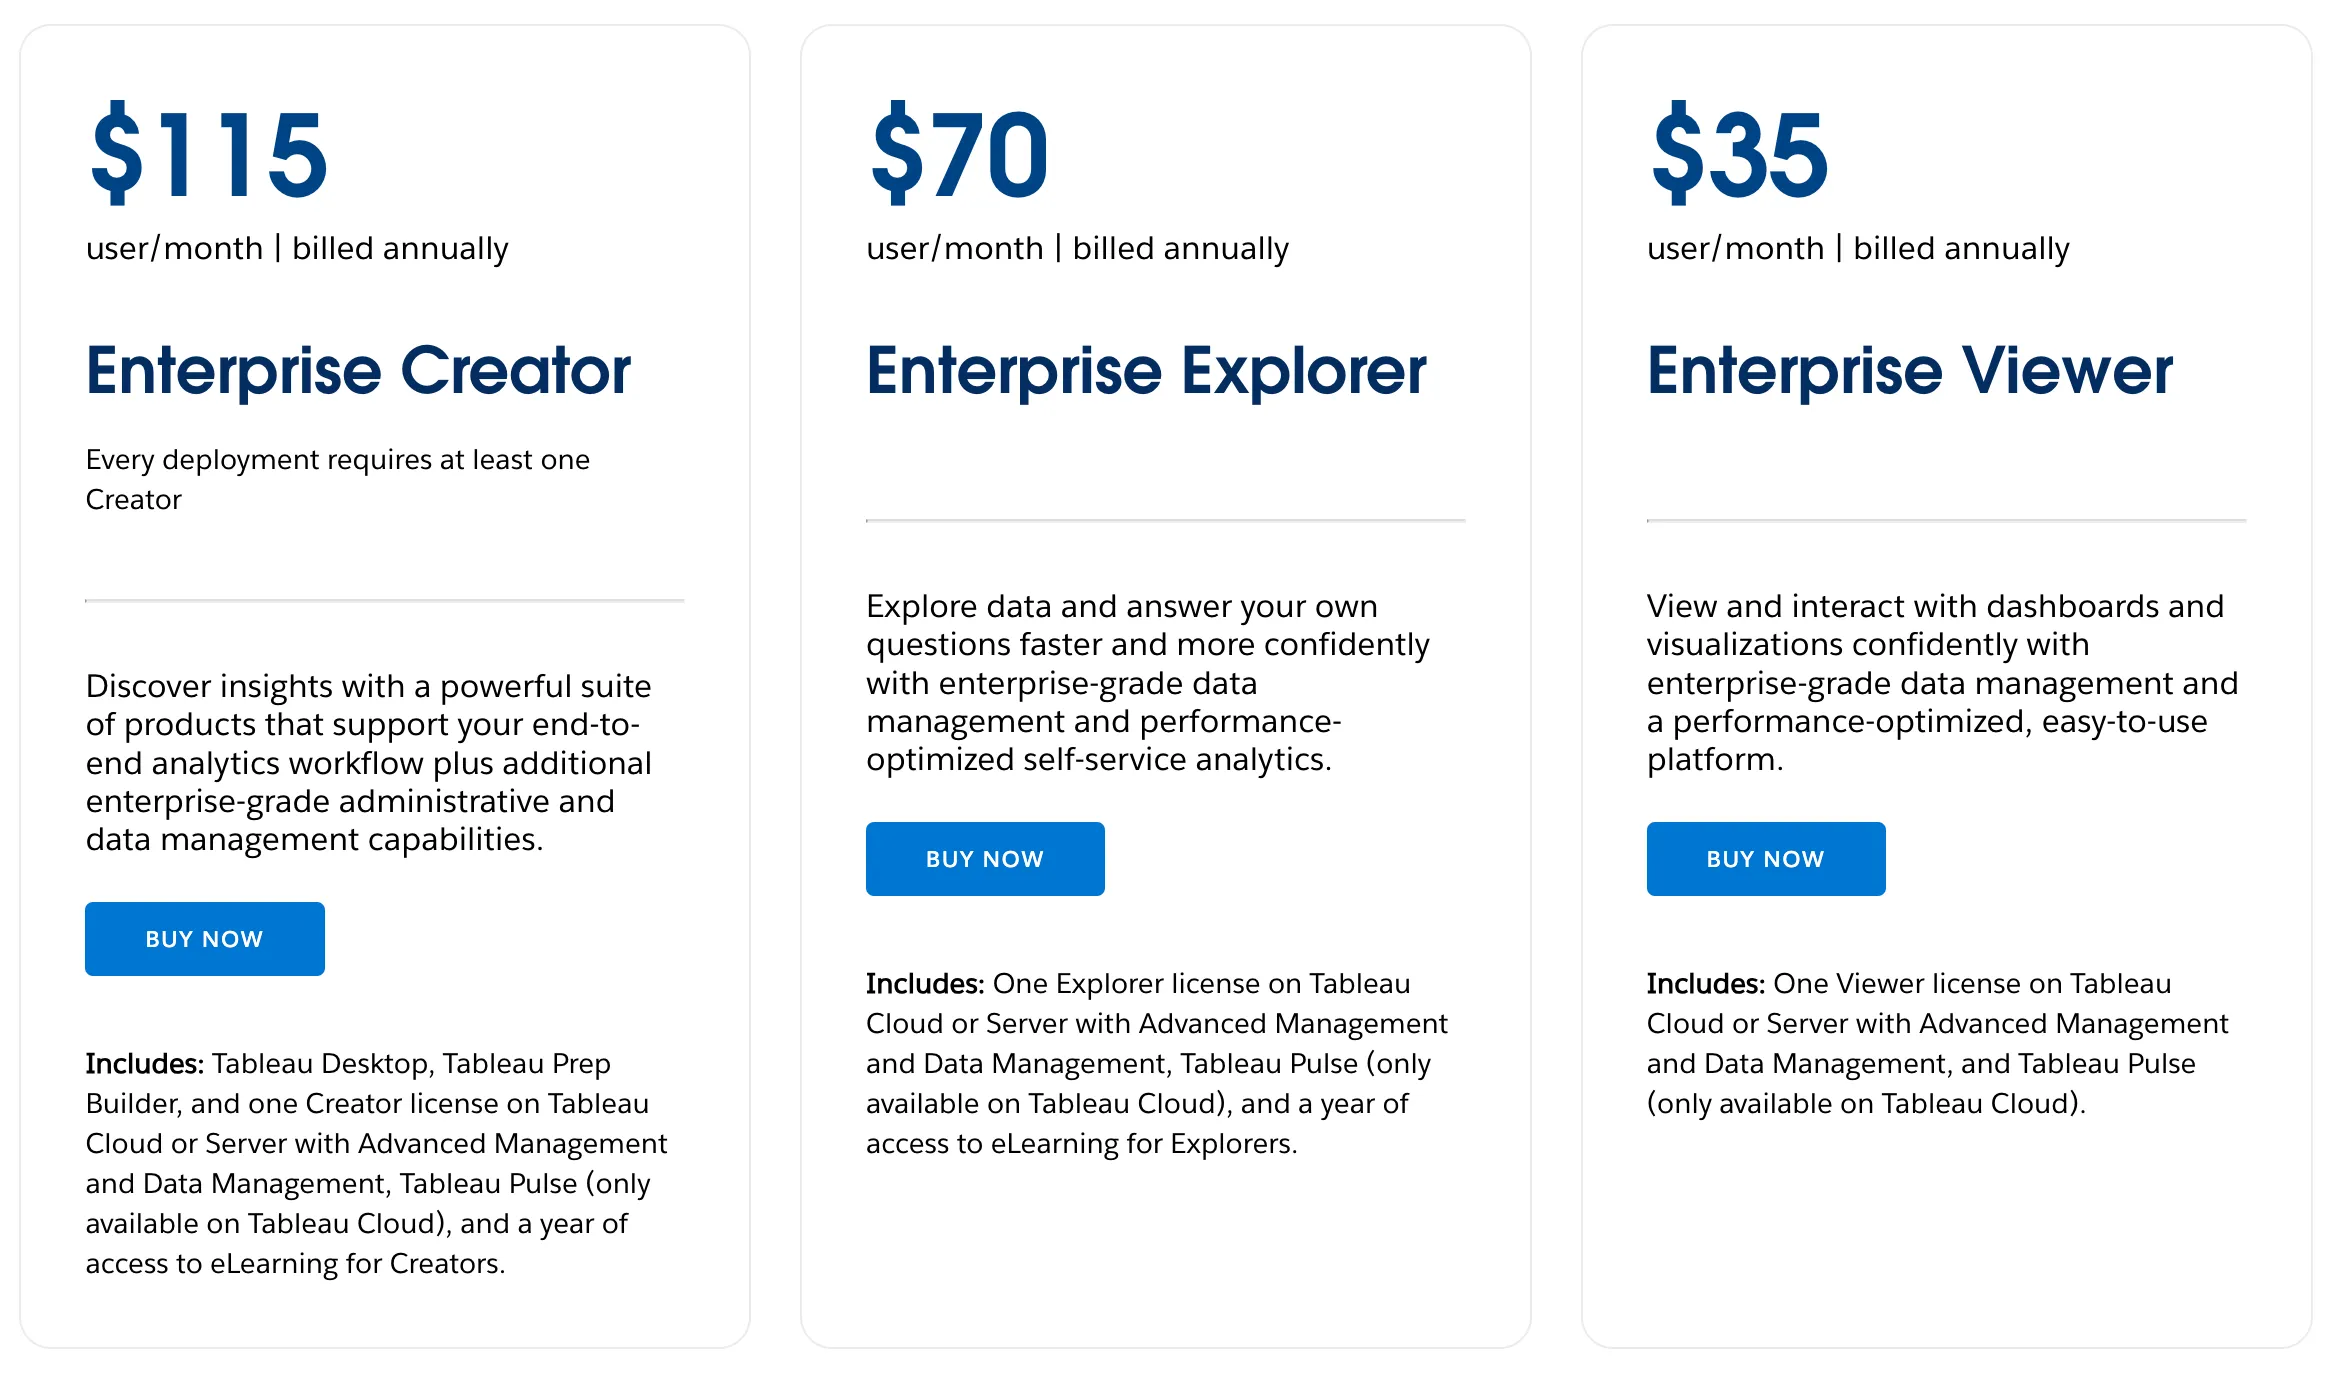
Depending on the level of access, each user will need one of three licenses: Creator, Explorer, or Viewer. That’s the standard Creator Explorer and Viewer model.
Account for the analytics capabilities your end-users should have and then purchase the right license for that functionality. For example, if you have 100 end-users who should be able to explore your Tableau dashboards, you’re going to spend $4,200 per month on embedded analytics.
And this is on top of your core licenses and the ones for your internal team. You may also need advanced software packages and license on Tableau Cloud if you're deploying in the cloud.
To cut to the chase, pricing can get very expensive, very fast, especially if you have a large data analytics team and lots of end-users who need to explore their data.
Should you invest in Tableau? Choosing the right mix of user licenses
If you’re already using Tableau internally, maybe. You should be well aware of how complex the tool is to use and you should have a basic understanding of how to create functional, interactive dashboards.
But if you have a SaaS app and you need embedded analytics to increase product usage, drive more revenue and provide an exceptional user experience… then Tableau should not be your first choice.
Here is why:
Reason #1
To set everything up, you need to pay quite a bit of cash – for creator, explorer, and viewer licenses.
Reason #2
Tableau is not built embedded-first – it’s primarily a BI tool for on-premise and cloud analytics.
Reason #3
Customization limitations – while Tableau is easy to embed, it does not have the customization and whitelabeling capabilities of modern embedded analytics tools.
Reason #4
Limited real-time analytics – Tableau excels in situations where you need to analyze historical data, but gets glitchy and slow with real-time use cases.
In short, it’s expensive, not as functional as tools built specifically for embedded analytics and it might drive away more users than it attracts.
While Tableau embedded analytics offers robust features, including self-service analytics and interactive visualizations, it may not be the perfect solution for every organization. Its integration within custom web portals and simple web pages is functional but can be complex, especially for teams without extensive technical expertise. Building custom interface elements often requires additional development time, which could slow down deployment timelines.
Additionally, while the Tableau platform is well-regarded for its advanced analytics, it sometimes struggles to accommodate fast-changing underlying data without manual intervention. The reliance on Tableau deployment using Tableau Cloud or Server can also create challenges for organizations with strict on-premise data policies, potentially leading to concerns over cost scalability and data governance.
Even with tools like preset dashboard filtering, data quality warnings, and data driven alerts, the system’s usability in more dynamic, mobile-friendly environments – such as mobile app bootstraps – has been critiqued for lacking flexibility. If you need lightweight, fast, and easily adaptable analytics in rapidly changing environments, Tableau’s strengths might not align with your priorities.
When considering integrating Tableau, weigh its capabilities against the specific needs of your business and the agility required to manage underlying data changes effectively. While it excels in structured environments, organizations seeking truly customized, agile analytics might encounter limitations – especially when looking to manage data faster with a comprehensive software package that supports advanced management and data workflows confidently with enterprise grade features.
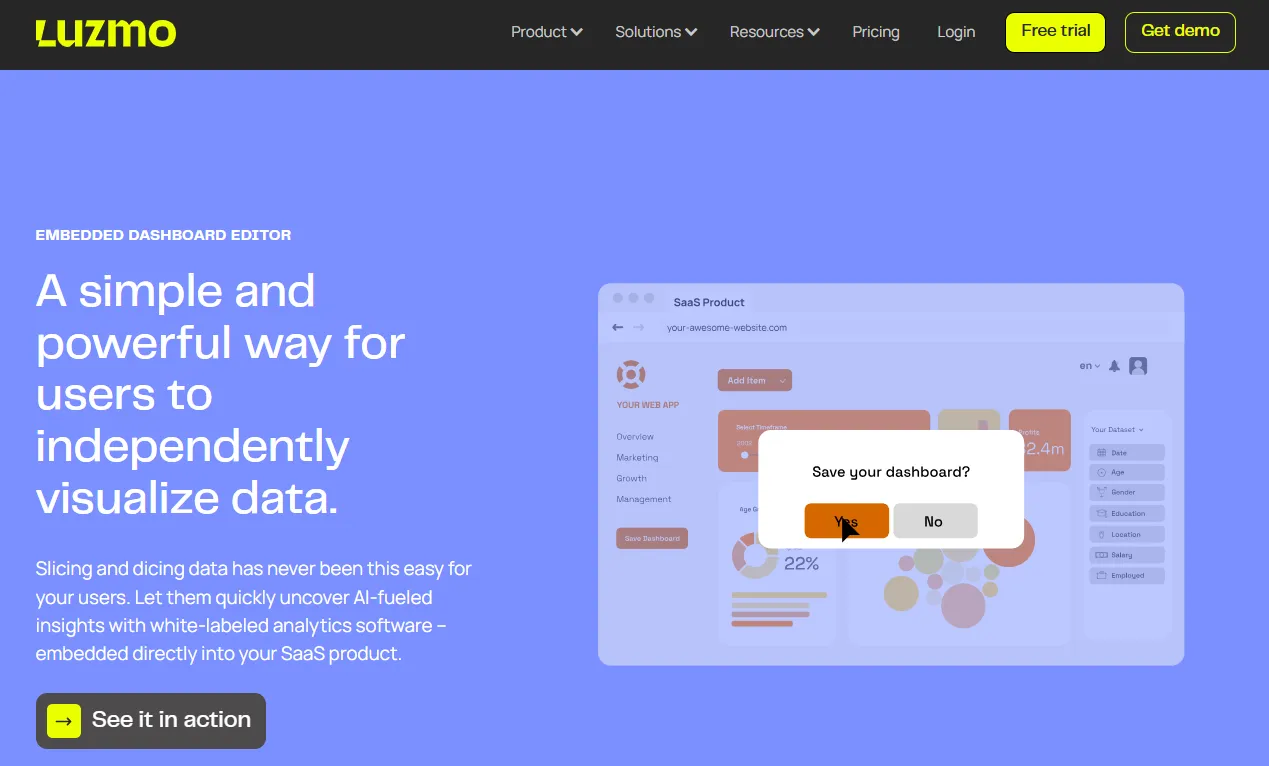
Looking for an alternative? Skip the mix of user licenses and complex editions with Luzmo
A great embedded analytics tool needs to meet a large number of conditions. It needs to have an excellent API, a wide variety of dashboard templates and visualizations, be easy to use and add to your existing workflows… and not cost an arm and a leg. And if possible, to have transparent pricing that is easy to understand.
At Luzmo, we help SaaS companies add beautiful dashboards to their product, improving the product experience while driving revenue for your business. Your developers don’t need specialized knowledge or skills – they can embed a Luzmo dashboard in just a few hours.
With Luzmo Studio, product teams can design and customize embedded dashboards that feel like a native part of their application. Luzmo IQ enables natural-language exploration, allowing users to ask questions and instantly get visual answers, while Luzmo AI helps generate charts and insights automatically from your data. On top of that, Luzmo offers transparent pricing built for SaaS growth — starting at €495/month for Starter and €1,995/month for Premium, with scalable Enterprise plans — so you avoid the unpredictable licensing and user-based costs typical of tools like Tableau.
Unlike Tableau, Luzmo is built with an embedded use case in mind. Let us help you save time and money and improve your product.
Book your free demo and get a tour of Luzmo today.
FAQ
All your questions answered.
**What is Tableau Embedded and how does it work?**
Tableau Embedded lets you integrate dashboards directly into your app or website, making analytics feel like a native part of your product. It uses JavaScript APIs and supports deployments on Tableau Cloud or Server.
**What licenses do I need for embedded analytics?**
You’ll need at least one **Creator license** to build dashboards. For your users, you’ll choose between **Explorer and Viewer licenses** depending on how much control they need. This is known as the **Creator, Explorer, and Viewer** model.
**How is Tableau Embedded different from Tableau Online?**
**Tableau Online** gives registered users access to dashboards through sign-in. **Embedded** integrates dashboards into your platform directly, with fewer steps and no external Tableau interface.
**Is Tableau a good fit for real-time analytics?**
Not really. Tableau performs best with structured, historical data. It can lag in real-time use cases or when dealing with fast-changing data.
**What makes Tableau pricing so complex?**
Pricing includes multiple factors: **user licenses**, server/cloud hosting, and functionality. You also need to match the **right mix of user access levels**, which can raise costs quickly.
**Are there easier alternatives to Tableau for embedded analytics?**
Yes. Tools like Luzmo are built embedded-first, offer simpler setup, and come with **transparent pricing**—ideal for SaaS teams needing flexibility without the complexity of managing multiple license types.
Written by

Ship the future of your data
Let us show you what Luzmo can do for your product.

Leave your e-mail and one of our analytics experts will reach out to you