Workforce Analytics: Why They Matter for HR Software
Workforce analytics turns employee and operational data into evidence for decisions about hiring, retention, capacity, skills and workforce planning. In 2026, the category reaches well beyond static HR dashboards. Teams increasingly use predictive models, scenario planning and AI-assisted exploration to understand what happened, what may happen next and which actions are worth testing.
For HR software companies, the opportunity is slightly different. Their customers already generate valuable workforce data inside the product, so the product experience has to turn that data into insight that is useful, secure and personalized. Luzmo’s original 2023 research with 20 HR tech companies showed how difficult that reporting problem already was, and it remains a useful baseline. Every figure from that study is labeled as historical research throughout this page.
What is workforce analytics?
Workforce analytics is the practice of collecting and analyzing workforce data to support decisions about people, skills, capacity and work. It can combine HR information such as hiring, turnover and engagement with operational measures such as availability, workload or labor cost. The goal is not simply to report metrics, but to help teams understand patterns, anticipate workforce needs and decide what to do next.
In practice, that means HR professionals can identify which areas of the organization need more support, anticipate future talent needs, and make data-driven decisions about where to hire, where to reskill and where workload has become unsustainable.
What changed in workforce analytics in 2026?
The fundamentals have not changed: workforce analytics still starts with reliable people data and a clear question. What has shifted is what buyers now expect from the experience around that data. Four changes stand out, and none of them is universal yet. They describe where the category is heading rather than what every organization has already adopted.
From static reporting to more timely insight. Monthly or quarterly HR reports are still common, but teams increasingly expect workforce data to be current enough to act on within a planning cycle rather than after it.
From descriptive reporting to decision support. Historical dashboards answer what happened. Buyers now also ask what may happen next and which options are worth comparing, which pulls predictive and prescriptive methods into everyday HR work.
From headcount planning to skills-based planning. Planning by job title and headcount misses the question that matters when roles change quickly: which capabilities does the organization actually have, and where are they concentrated?
From dashboards to conversation. Fixed dashboards remain the backbone, but analytics is moving beyond static dashboards toward self-service exploration and natural-language questions, so people can follow up on an answer without filing a new reporting request.
Workforce analytics vs HR analytics vs people analytics
Workforce analytics, HR analytics and people analytics often describe the same core practice: using people data to improve decisions. Some teams use the terms differently, but there is no single industry taxonomy, and reputable sources including CIPD, SAP and AIHR treat them as overlapping. When a distinction is useful, HR analytics often emphasizes HR processes, people analytics emphasizes people-related business questions, and workforce analytics can extend more directly into capacity, skills and workforce planning.
| Term | Common emphasis | Example question |
|---|---|---|
| HR analytics | HR processes and outcomes | Why is turnover increasing? |
| People analytics | People-related business questions | What is driving engagement or performance? |
| Workforce analytics | Workforce capacity, skills and planning | Do we have the people and skills needed for the next planning cycle? |
These are common emphasis areas, not strict industry definitions.
What are the four types of workforce analytics?
Workforce analytics is usually described in four levels, each answering a different kind of question. Most teams already do the first two and are working toward the third. The four build on each other rather than replacing one another, so a mature setup still needs solid descriptive reporting underneath its predictive analytics.
| Type | Question it answers | Workforce example |
|---|---|---|
| Descriptive | What happened? | Turnover increased last quarter |
| Diagnostic | Why did it happen? | Attrition was concentrated in a role, location or tenure group |
| Predictive | What may happen next? | Forecast a capacity or skills gap |
| Prescriptive | What should we consider doing? | Compare hiring, redeployment or upskilling scenarios |
Prescriptive analytics recommends and compares options. It does not remove the need for judgment, and consequential employment decisions should stay with people who can weigh context the model cannot see.
Benefits of workforce analytics
With the right workforce data at hand, HR departments are more informed and confident in their decision-making. When problems occur, modern workforce analytics software can reveal points of improvement proactively. By analyzing historical data about employee hours, overtime and time tracking, productivity, satisfaction and staffing metrics, staffing teams can drive better business outcomes on many fronts.
Workforce planning
Workforce planning software like time tracking tools or workforce management tools offer insights into who is available, how much overtime has been worked, and how capacity is distributed across teams. This makes it much easier to plan your workforce effectively. For shift-based teams, labor optimization can also help balance staffing needs with costs. Planning gets more valuable when it moves past the current schedule: combining capacity data with skills availability lets teams model scenarios, such as whether a planned launch is realistic with the capabilities on hand, rather than react to them.
Talent management
People analytics are a great help for talent management. Keeping track of your employee turnover rate, time to hire, hiring costs and employee performance will help you manage your top talent. Two measures now matter just as much: internal mobility, meaning how often people move into new roles instead of leaving, and skills coverage, meaning how many people can actually perform a critical task. A team where one person holds an essential skill is a risk headcount reporting will never surface.
Skills gaps and internal mobility
Skills data makes workforce analytics useful before a vacancy exists. HR teams can compare current capabilities against future demand, identify teams where a critical skill sits with too few people, and decide where reskilling or internal mobility is more realistic than external hiring.
The pressure here is well documented. In its Future of Jobs Report 2025, the World Economic Forum found that employers expect 39% of workers’ existing skill sets to be transformed or become outdated over the 2025 to 2030 period, and 63% of surveyed employers identified skills gaps as a major barrier to business transformation. In response, 85% said they plan to prioritize upskilling their workforce.
Those figures describe a planning problem more than a hiring problem. If a significant share of current capabilities will shift within a five-year horizon, the useful question is not only which roles to fill, but which capabilities to build, and who is already close enough to grow into them.
Employee engagement and employee retention
Just like measuring NPS, business leaders can conduct employee surveys to measure happiness on the work floor. Measuring employee satisfaction against industry benchmarks will help businesses take the right actions to boost employee experience. For example, insights from these surveys can highlight the need for consistent recognition, leading many companies to turn to employee rewards software as a way to strengthen morale and maintain motivation across teams. Some teams go a step further by offering a gift with choice, giving employees flexibility while still tying rewards to engagement insights. That same principle applies to core benefits: an employee benefits broker can use workforce data to compare plans, negotiate with carriers, and build a package around what employees value most.
Cost reduction
For many businesses, human capital is one of the biggest expenses. A clear view of labor cost, forecasting accuracy and internal promotion rates helps leaders see where money is going and which trade-offs are available.
What analytics does here is expose the trade-off, not settle it. Outsourcing, hiring in a different market or automating a process may reduce cost in one organization and increase it in another once management overhead, quality and attrition are counted. The data makes those second-order effects visible before the decision rather than after it. During staff exits, laptop retrieval services can recover company devices and reduce replacement costs.
Which workforce analytics metrics should you track?
The right workforce analytics metrics depend on the business question. Start with a small set that covers workforce size, movement, capacity, skills and employee experience. A useful dashboard should connect each metric to a decision instead of collecting every HR number available. If you are not sure which numbers to track first, our HR metrics cheat sheet is a practical place to start.
| Area | Example metric | What it helps answer |
|---|---|---|
| Workforce size | Headcount / FTE | How large is the active workforce? |
| Retention | Voluntary turnover rate | Where are employees leaving? |
| Hiring | Time to hire | How quickly are open roles filled? |
| Mobility | Internal mobility rate | How often is talent redeployed or promoted internally? |
| Skills | Skills coverage or gap | Which capabilities are missing or concentrated? |
| Capacity | Utilization or workload | Where are teams overloaded or underused? |
| Cost | Labor cost per FTE | How is workforce cost changing? |
| Experience | Engagement or satisfaction score | Where are employee-experience signals weakening? |
| Attendance | Absence rate | Are absence patterns changing by team or period? |
| Development | Training completion or skill progression | Are upskilling efforts changing capability coverage? |
Importance of HR analytics for SaaS products
HR software vendors are sitting on a pile of people data of immense value to their customers. But data collection is only one piece of the puzzle. Are they using that data to its full potential? To find out, we interviewed 20 HR tech companies.
Almost half of the companies interviewed have added HR usage statistics to their platform as a strategic company decision. On the other hand, 33% said they add reporting because their customers are asking for it.
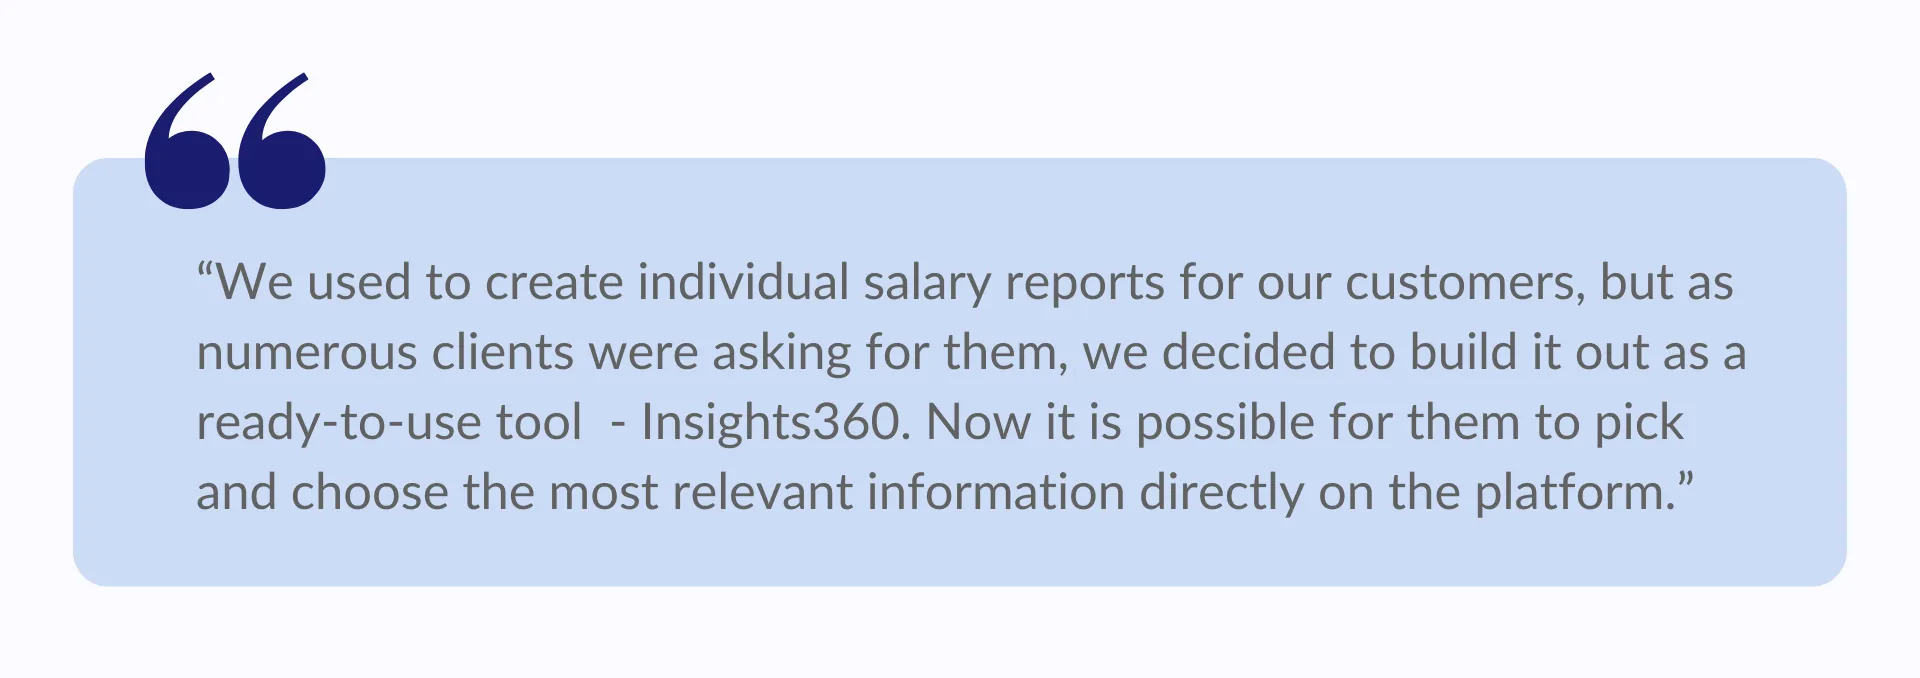
Whether it’s driven by customers or internally, the decision to add reports to HR software is usually due to the same good reason. They want to add more value for their clients, leading to happier customers and more product adoption in return.
What HR tech companies told us about analytics in our original research
Research note: Luzmo interviewed 20 HR tech companies for this research in 2023. The percentages below describe that original research sample and should be read as a historical benchmark, not as 2026 market-wide statistics.
Among our interviewees, there was no doubt that HR analytics were useful for their customers. But product managers juggle many priorities at once, so we asked how far workforce analytics actually rose up the list in 2023.
Let’s look at the top challenges they reported and, subsequently, their product priorities.
What HR tech teams were prioritizing in 2023
Unanimously, the companies we spoke to were struggling with business growth. Almost every person we interviewed said that scaling the company and acquiring more customers was their number one challenge at the time, for a range of reasons:
- 53% struggle to increase awareness for their product
- 23% are looking for ways to optimize their business model
- 18% are impacted by the economic climate
- 6% want to expand internationally
Top product priorities in HR software
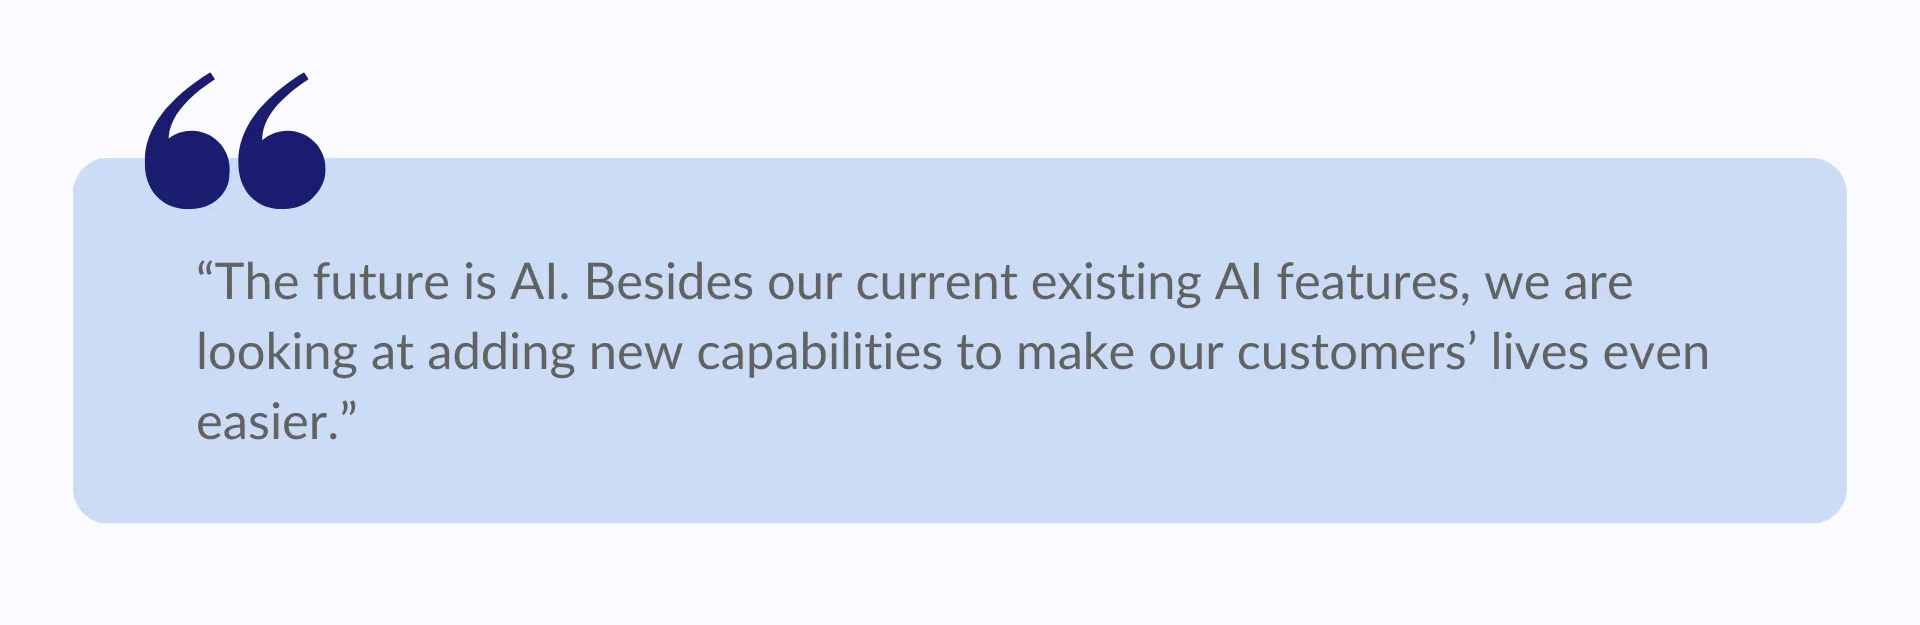
It was no surprise that the top product priorities related directly to company growth. 53% said they would focus on building a more mature core product, while 47% planned to expand upon their core product. On innovation, most companies mentioned adding machine learning and AI features, such as AI-driven predictive analytics, to their product.
What our 2023 research found about workforce analytics
So where did workforce analytics sit on the product roadmap at the time? Only 24% of the 2023 sample mentioned improved insights as a top product priority for that year. For a quick visual summary of these findings, take a look at our HR analytics infographic.
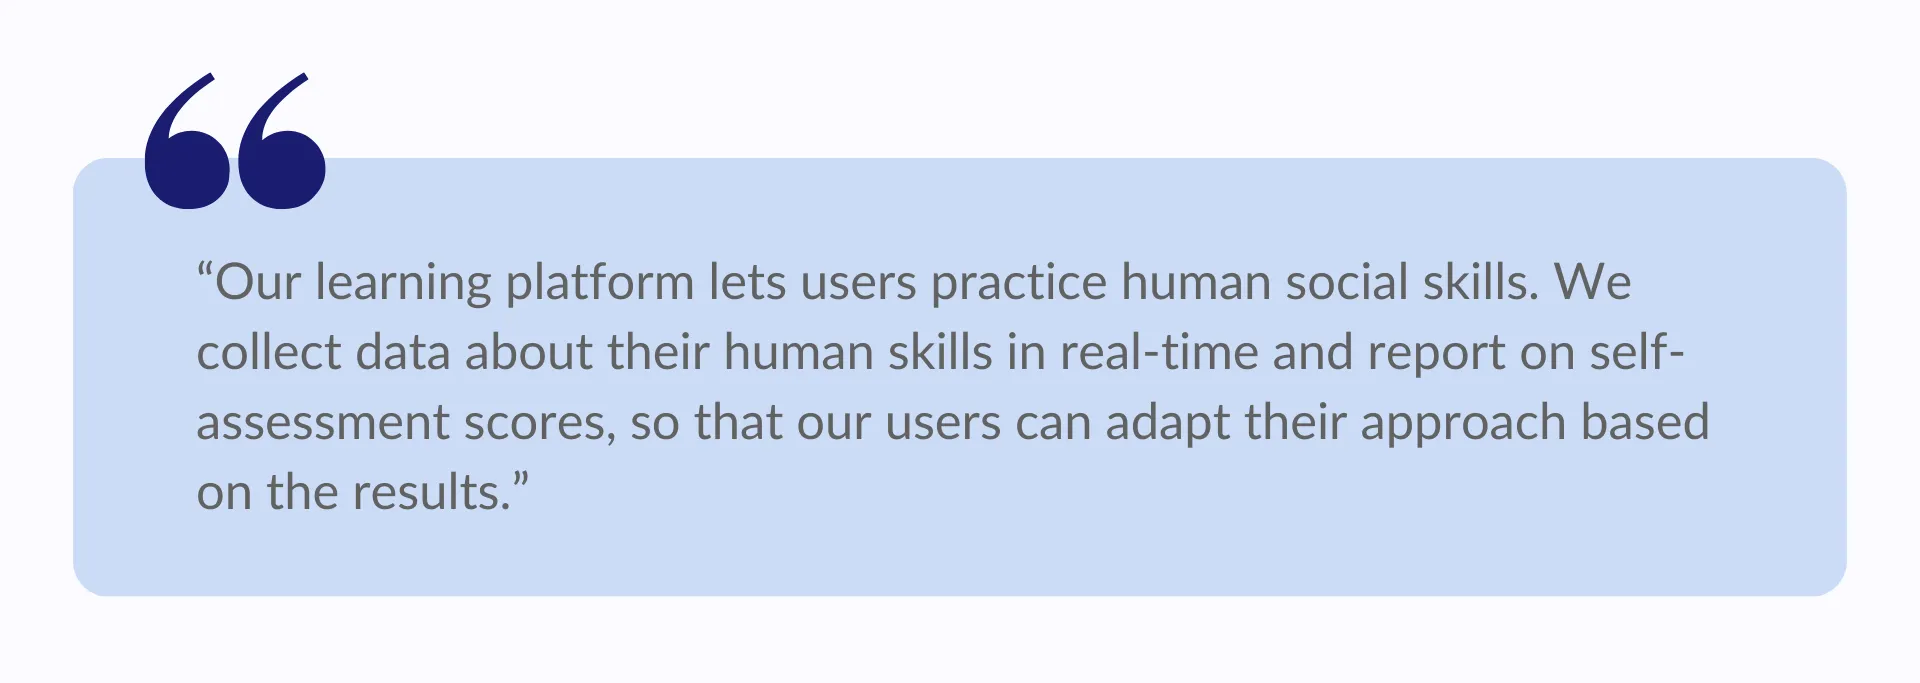
That is less surprising once you know that 82% of the people we interviewed in 2023 were already offering an analytics solution alongside their product.
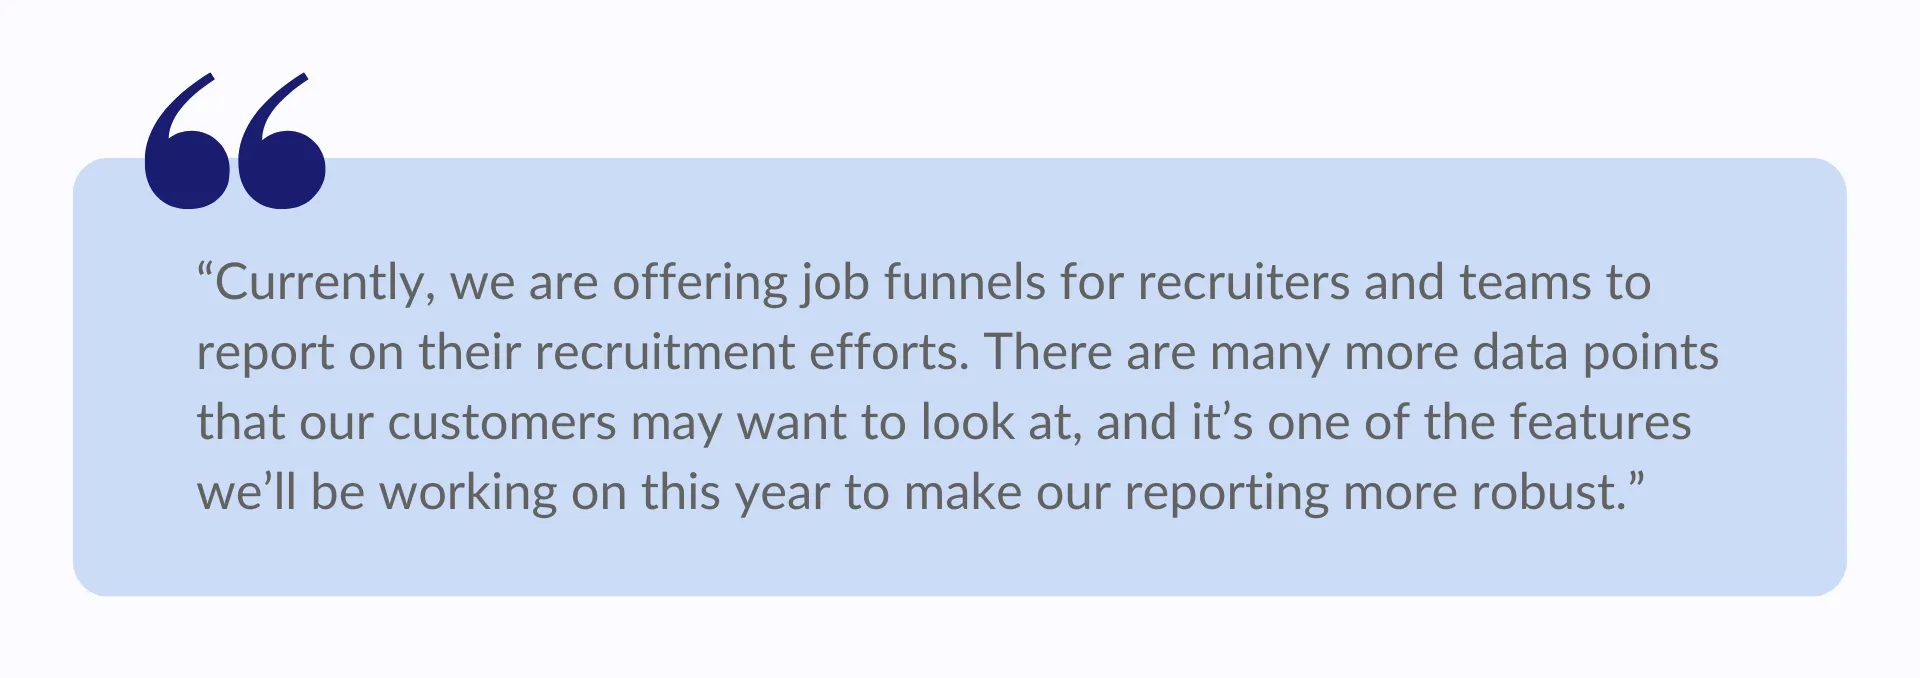
Of those, 60% had built standard reports in-house, while 27% were still building manual reports on customer request.
Top challenges in HR analytics
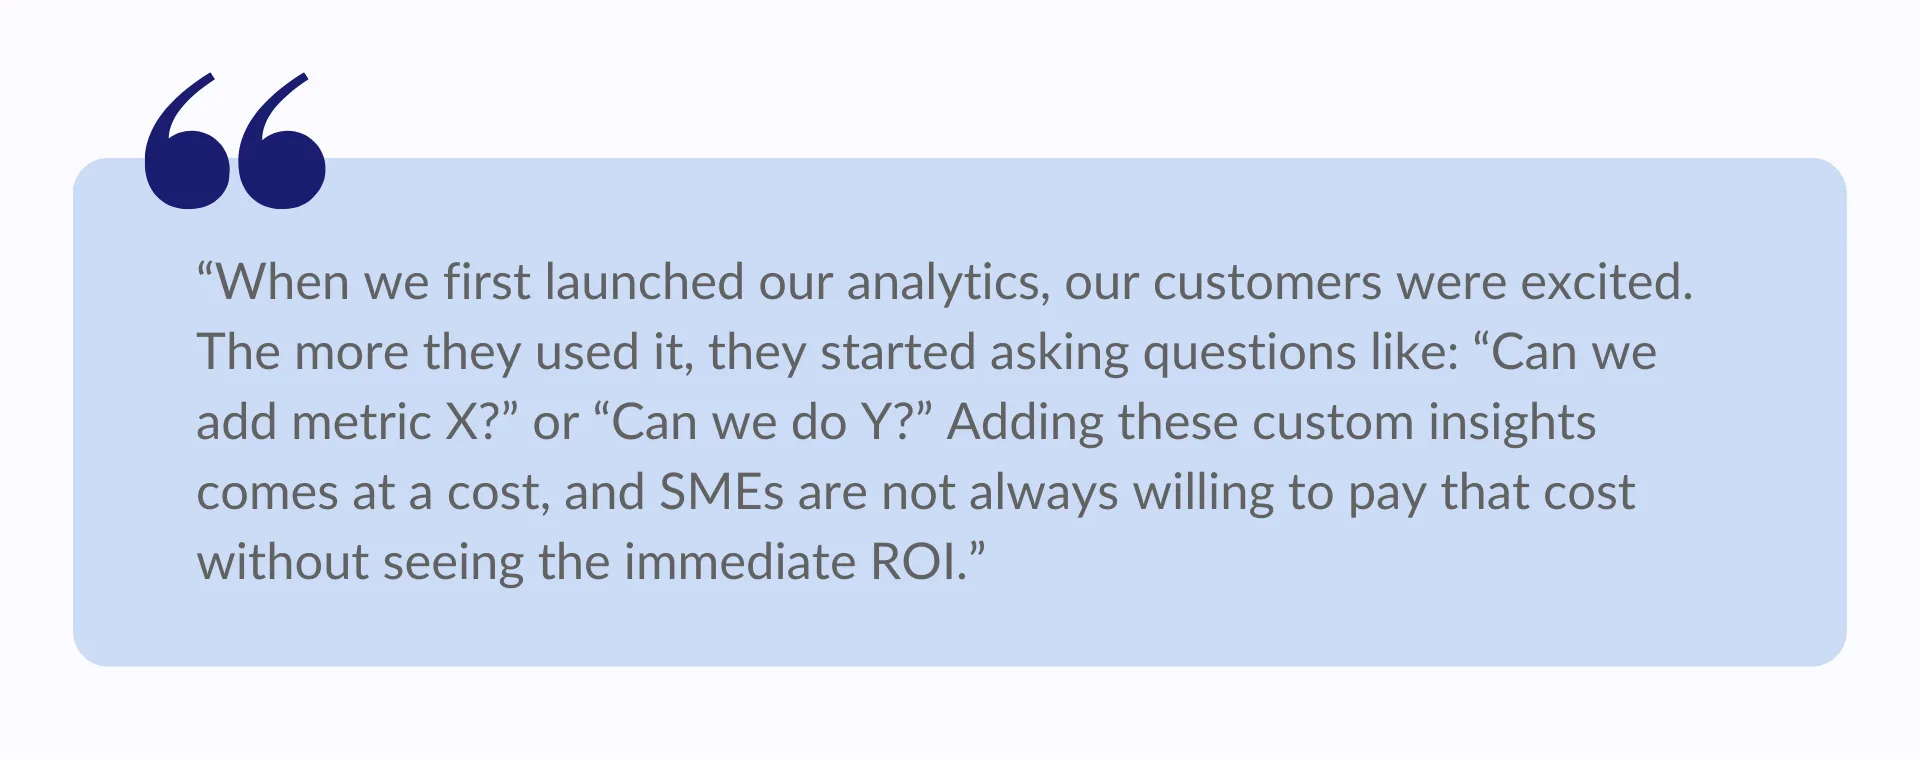
For 82% of the HR software leaders we interviewed in 2023, analytics was already part of their offering and packages. The biggest challenge they reported was personalization: 44% said they did not know which metrics to visualize for their customers, or they received many different reporting requests from customers.
With limited resources, catering to all those different requests was challenging and expensive.
What has changed since the 2023 research?
The 2023 sample described a reporting problem: customers wanted insight, and HR software teams were absorbing that demand as one-off report requests. Three years on, the shape of the demand has changed more than its volume.
Customer expectations have widened from fixed reports toward self-service exploration and, increasingly, conversational questions. A finance lead who sees turnover rising rarely wants a new report. They want to ask the follow-up themselves, which is the pattern behind self-service analytics inside SaaS products. The Kenjo example on that page comes directly from HR software.
Personalization is still the core challenge our 2023 respondents named, but the answer looks different now. Rather than choosing between one shared dashboard and endless bespoke reports, product teams can combine standard dashboards, governed self-service editing and AI-assisted questions in the same experience, and let different customer segments use the layer that suits them.
Skills and workforce scenario planning have also moved up the agenda, which raises the bar for the underlying data model. Answering a skills question requires more than an employee table.
Finally, HR software teams now need clearer thinking about permissions, context and governance, because workforce data is sensitive and AI features widen who can query it and how.
How is AI changing workforce analytics?
AI shows up in workforce analytics in four fairly distinct ways, and it helps to keep them separate, because they carry different risks.
Natural-language questions over governed data. Users ask a question in plain language and get an answer drawn from data they are already permitted to see. The governance matters as much as the language model: the question should never widen access.
AI-assisted chart and report creation. Instead of configuring a visualization by hand, someone describes what they want to see and adjusts the result. This mostly saves time for the person building the report.
Predictive models. Turnover risk, capacity forecasts and skills-gap projections fall here. These are useful at the level of teams, roles and time periods, and they should be treated as estimates that inform a conversation, not verdicts about individuals.
Agentic workflows. An agent can surface a relevant insight or prepare a follow-up action, subject to product permissions and human review.
A concrete example makes the difference clear. A customer asks, “Which departments saw the largest increase in voluntary turnover over the last two quarters?” The analytics experience can return the relevant view, then let the user narrow the question to tenure, location or role without filing another reporting request. That second step is where most of the value sits, and it is also the pattern behind agentic analytics.
For HR software teams building this, Luzmo IQ can support conversational analytics inside embedded dashboards, and Luzmo AI is the current agentic AI suite, including prompt-to-visual generation from natural-language requests and AI Context for defining business rules and metric meaning. Where AI agents need governed access to analytics, the Embedded MCP Server and agent APIs are the relevant building blocks, and embedded authorization should preserve the host product’s access and tenant context throughout.
Privacy and responsible workforce analytics
Workforce data describes people, which makes restraint a design requirement rather than a nice-to-have. A few practices carry most of the weight.
Collect and analyze only the workforce data a defined decision actually needs. Document who can access which metrics and at what level of aggregation, and treat that document as part of the product, not as compliance paperwork. Where possible, separate team-level analytics from individual-level evaluation: understanding that attrition is concentrated in one function is a different activity from scoring a named employee.
When analytics is embedded in HR software, tenant and role permissions have to hold inside the analytics layer too. An insight that leaks across tenants is a security incident, not a reporting bug. Keep a human in the loop for consequential employment decisions, and explain to employees what is being measured and why. Something being measurable does not make measuring it neutral.
There is a regulatory dimension as well. The European Commission lists certain AI uses in employment and worker management as high-risk, including filtering job applications and evaluating candidates. Following the 2026 AI Omnibus timeline change, Commission material says the high-risk rules for areas including employment are scheduled to apply from December 2, 2027. Classification depends on the intended use of the AI system, so not every HR analytics dashboard falls into this category.
This is not legal advice. If AI is used to support recruitment, promotion, termination, worker monitoring or other consequential employment decisions, review the applicable legal and compliance requirements for the intended use and jurisdiction.
Seeing analytics win over customers
Strong analytics does more than tidy up reporting. It changes how customers experience your product, especially the demanding, high-value accounts. For a closer look at those moments, read 5 ways to impress your enterprise customers with analytics, which walks through where embedded dashboards make the biggest difference.
What workforce analytics looks like in HR software in 2026
Reporting needs inside an HR product are not uniform, so the analytics experience usually grows in layers. Each layer solves a different customer need, and later layers do not make earlier ones obsolete.
Standard dashboards cover the questions almost every customer asks, and they remain the backbone of the experience. Personalized embedded analytics adapt what a given customer or role sees, using multi-tenant patterns so an account only ever sees its own data. Governed self-service lets customers adjust or build views themselves within limits you define, through an embedded dashboard editor rather than a support ticket. Conversational analytics adds plain-language questions on top, which Luzmo IQ supports inside embedded dashboard experiences. Agentic analytics, the pattern behind Luzmo AI, extends that toward surfacing insights and preparing follow-up actions under product permissions and human review.
HR software teams can start with standard embedded dashboards, then add customer-specific permissions, self-service editing and conversational analytics as reporting needs become more varied. The implementation still requires deliberate data modeling, authorization and product design, but the team does not have to build every visualization, editor and analytics interaction from scratch. Luzmo provides embedded analytics for SaaS product teams, with role- and tenant-aware access handled through embed authorization rather than reimplemented per customer.
If you are weighing what this would take for your own product, start a free trial and take a look at the HR dashboard examples built on Luzmo.
FAQ
All your questions answered.
What is workforce analytics?
Workforce analytics is the practice of analyzing employee and operational data to support decisions about people, skills, capacity and work. It combines HR information such as hiring, turnover and engagement with operational measures such as workload or labor cost, so teams can spot patterns, anticipate workforce needs and decide what to do next.
What is the difference between workforce analytics and HR analytics?
The terms overlap heavily and are often used interchangeably. When a distinction is drawn, HR analytics tends to emphasize HR processes and outcomes, while workforce analytics extends further into capacity, skills and workforce planning. There is no single industry taxonomy, so treat these as differences in emphasis rather than fixed categories.
What are examples of workforce analytics?
Common examples include turnover analysis, workforce capacity and utilization reviews, skills-gap analysis, hiring metrics such as time to hire, internal mobility tracking and engagement trends. Each one connects a measure to a decision, such as where to hire, where to reskill and where workload is unsustainable.
Which workforce analytics metrics should you track?
Start with a small set tied to decisions rather than every available HR number. Headcount, voluntary turnover rate, time to hire, internal mobility rate, skills coverage, capacity or utilization, labor cost per FTE and an engagement score cover workforce size, movement, capability, capacity and experience.
How is AI used in workforce analytics?
AI supports natural-language exploration of governed workforce data, assisted chart and report creation, and predictive models for turnover, capacity or skills scenarios. It can also surface insights or prepare follow-up actions. Consequential employment decisions still require governance, documented permissions and human oversight.
Written by

Ship the future of your data
Let us show you what Luzmo can do for your product.

Book your session with our analytics expert.