Build your first embedded data product now. Talk to our product experts for a guided demo or get your hands dirty with a free 10-day trial.

March 6, 2024
Mon Nov 20 2023 08:00:00 GMT+0000 (Coordinated Universal Time)
Mieke Houbrechts

About Spaceflow:
Customer-facing reporting challenges:
Spaceflow wanted to transition away from its existing BI solution with Tableau.
❌ Difficulty integrating analytics dashboards in their portal interface
❌ Users had to use 2 separate apps: Spaceflow portal and BI tool
❌ Moving away from suboptimal UX design to a better product experience
Solution with embedded analytics:
✔️ Modern dashboards with superior user experience
✔️ Fully embedded in one platform for landlords
✔️ Birds-eye view for landlords on key metrics
Spaceflow is a PropTech SaaS, specializing in tenant experience. They work with residential and commercial buildings globally to streamline their building operations and grow revenue.
Their all-in-one platform helps landlords and tenants communicate more easily with each other and provide better service in their buildings. Tenants use a mobile app to access services like resource booking, visitor management or requests, and smart building features like mobile access, smart metering and more. Landlords can manage all of these services and communication with tenants and watch trends over time through a desktop portal.
Spaceflow wanted to add useful statistics inside that portal to help landlords spot trends and issues in their buildings and portfolios, or find opportunities to grow their revenue. They traded their stand-alone Tableau dashboards for a smoother, fully integrated experience with Luzmo.
As a growing startup, Spaceflow is focused on building the best tenant-landlord platform. But to answer their customers’ growing needs means regularly changing course and adapting their SaaS product to meet expectations.
When Eva Lisonova joined the company as Data & Analytics Manager, she was tasked with improving Spaceflow’s reporting and analytics features. By doing so, landlords would be able to make better decisions faster, leading to happier tenants.
Back then, Spaceflow offered analytics dashboards to their customers using a traditional BI solution. Although it did a good job at delivering insights, they now needed a solution that would seamlessly integrate inside their SaaS product’s interface.
In terms of user experience, they wanted to move away from separating analytics from their core product:
To make the experience smooth and easy, and to bring users back to one single platform - Spaceflow - they decided to redesign their reporting and embed it directly inside their portal.
“We used another BI tool before, which was great but less suited for integration. Clients had access to analytics, but it wasn’t inside our platform, and it didn’t have the same design. When we started researching tools that would perfectly embed into our platform, Luzmo immediately stood out.”
Eva Lisonova - Data & Analytics Manager at Spaceflow
To grow a strong brand, Eva believes every aspect of their SaaS product should have a unified design. To make sure their reporting breathes the Spaceflow brand, they needed an analytics solution they could seamlessly adjust to their product’s look and feel.
With an experienced designer, Patrick Beznoska, on the team, they had all the skills they needed. Equipped with Luzmo, they now also had the toolset that would allow him to carry out designs fully matching their brand and existing dashboards.
“We tried for a long time to have a nice, clean design of our dashboards, with easy integration into our desktop platform. The easy, quick, and seamless integration is what really sets Luzmo apart from other BI tools. It empowered our designer to spend more time on what he does best - creating beautiful designs - and less time on the implementation.”
Eva Lisonova - Data & Analytics Manager at Spaceflow
They now have a collection of dashboards, showing the metrics their customers care about the most. For example:
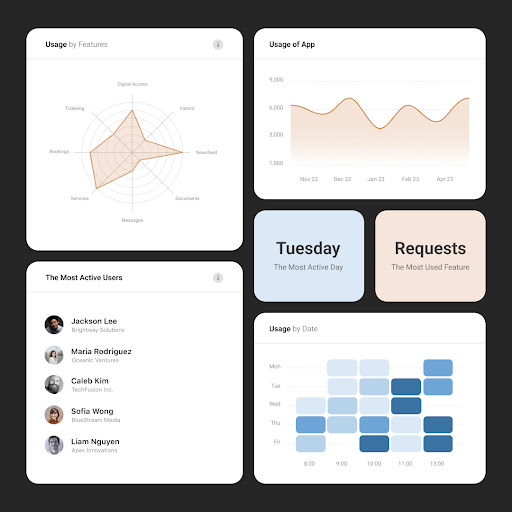
Besides a great visual design and useful metrics, the Spaceflow team has gone to great lengths to improve dashboard UX, ensuring the best possible experience for their clients. Just a few examples are:
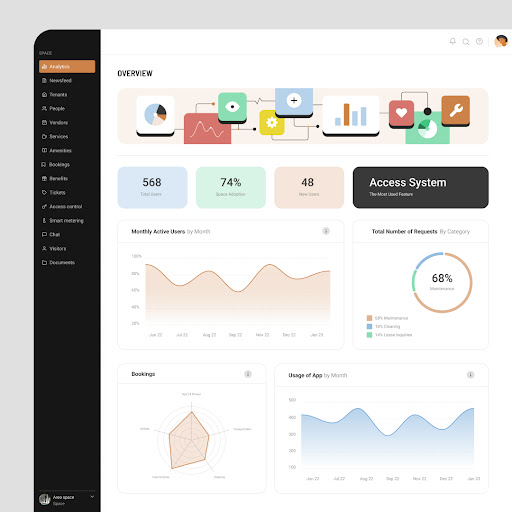
Within their powerful tenant app and landlord portal, this reporting layer offers landlords all the insights they need to manage their properties better. By embedding Luzmo, they aimed for higher-quality analytics, solving real needs landlords and their tenants face.
Since they did their reporting overhaul and started using Luzmo, Eva has seen requests for custom data reports go down with as much as 80%.
“We improved our entire dashboard structure, added many new metrics, and upgraded the design. On top of that, we embedded this refreshed experience directly into our platform with Luzmo. And as a result of all that work, we are now seeing up to 80% less data requests.”
Eva Lisonova - Data & Analytics Manager at Spaceflow
Landlords no longer have to leave the Spaceflow portal to analyze their building management. The combination of new tooling, as well as using customer feedback to improve UX and design, have led to clear results for Spaceflow. Their customers get to insights quicker, and their development team can fully focus on improving the product without being distracted by individual reporting requests.
Interested to learn more about adding interactive data visualization to your PropTech software? Get in touch with Luzmo's product experts for a live demo.
Build your first embedded data product now. Talk to our product experts for a guided demo or get your hands dirty with a free 10-day trial.


