Build your first embedded data product now. Talk to our product experts for a guided demo or get your hands dirty with a free 10-day trial.

July 18, 2025
July 18, 2025
Mieke Houbrechts
Westtoer's crowd barometer shows you the way!
Whether you want to enjoy a peaceful walk along the Belgian coast or are planning a beach weekend away with family, one question always comes up.
How busy is it going to be?
That’s exactly the challenge Westtoer, West Flanders’ tourism agency, set out to solve. With support from telecom provider Proximus and Luzmo’s embedded analytics platform, they built a real-time crowd barometer to help tourists, locals, and policymakers make smarter decisions based on real-time location data.
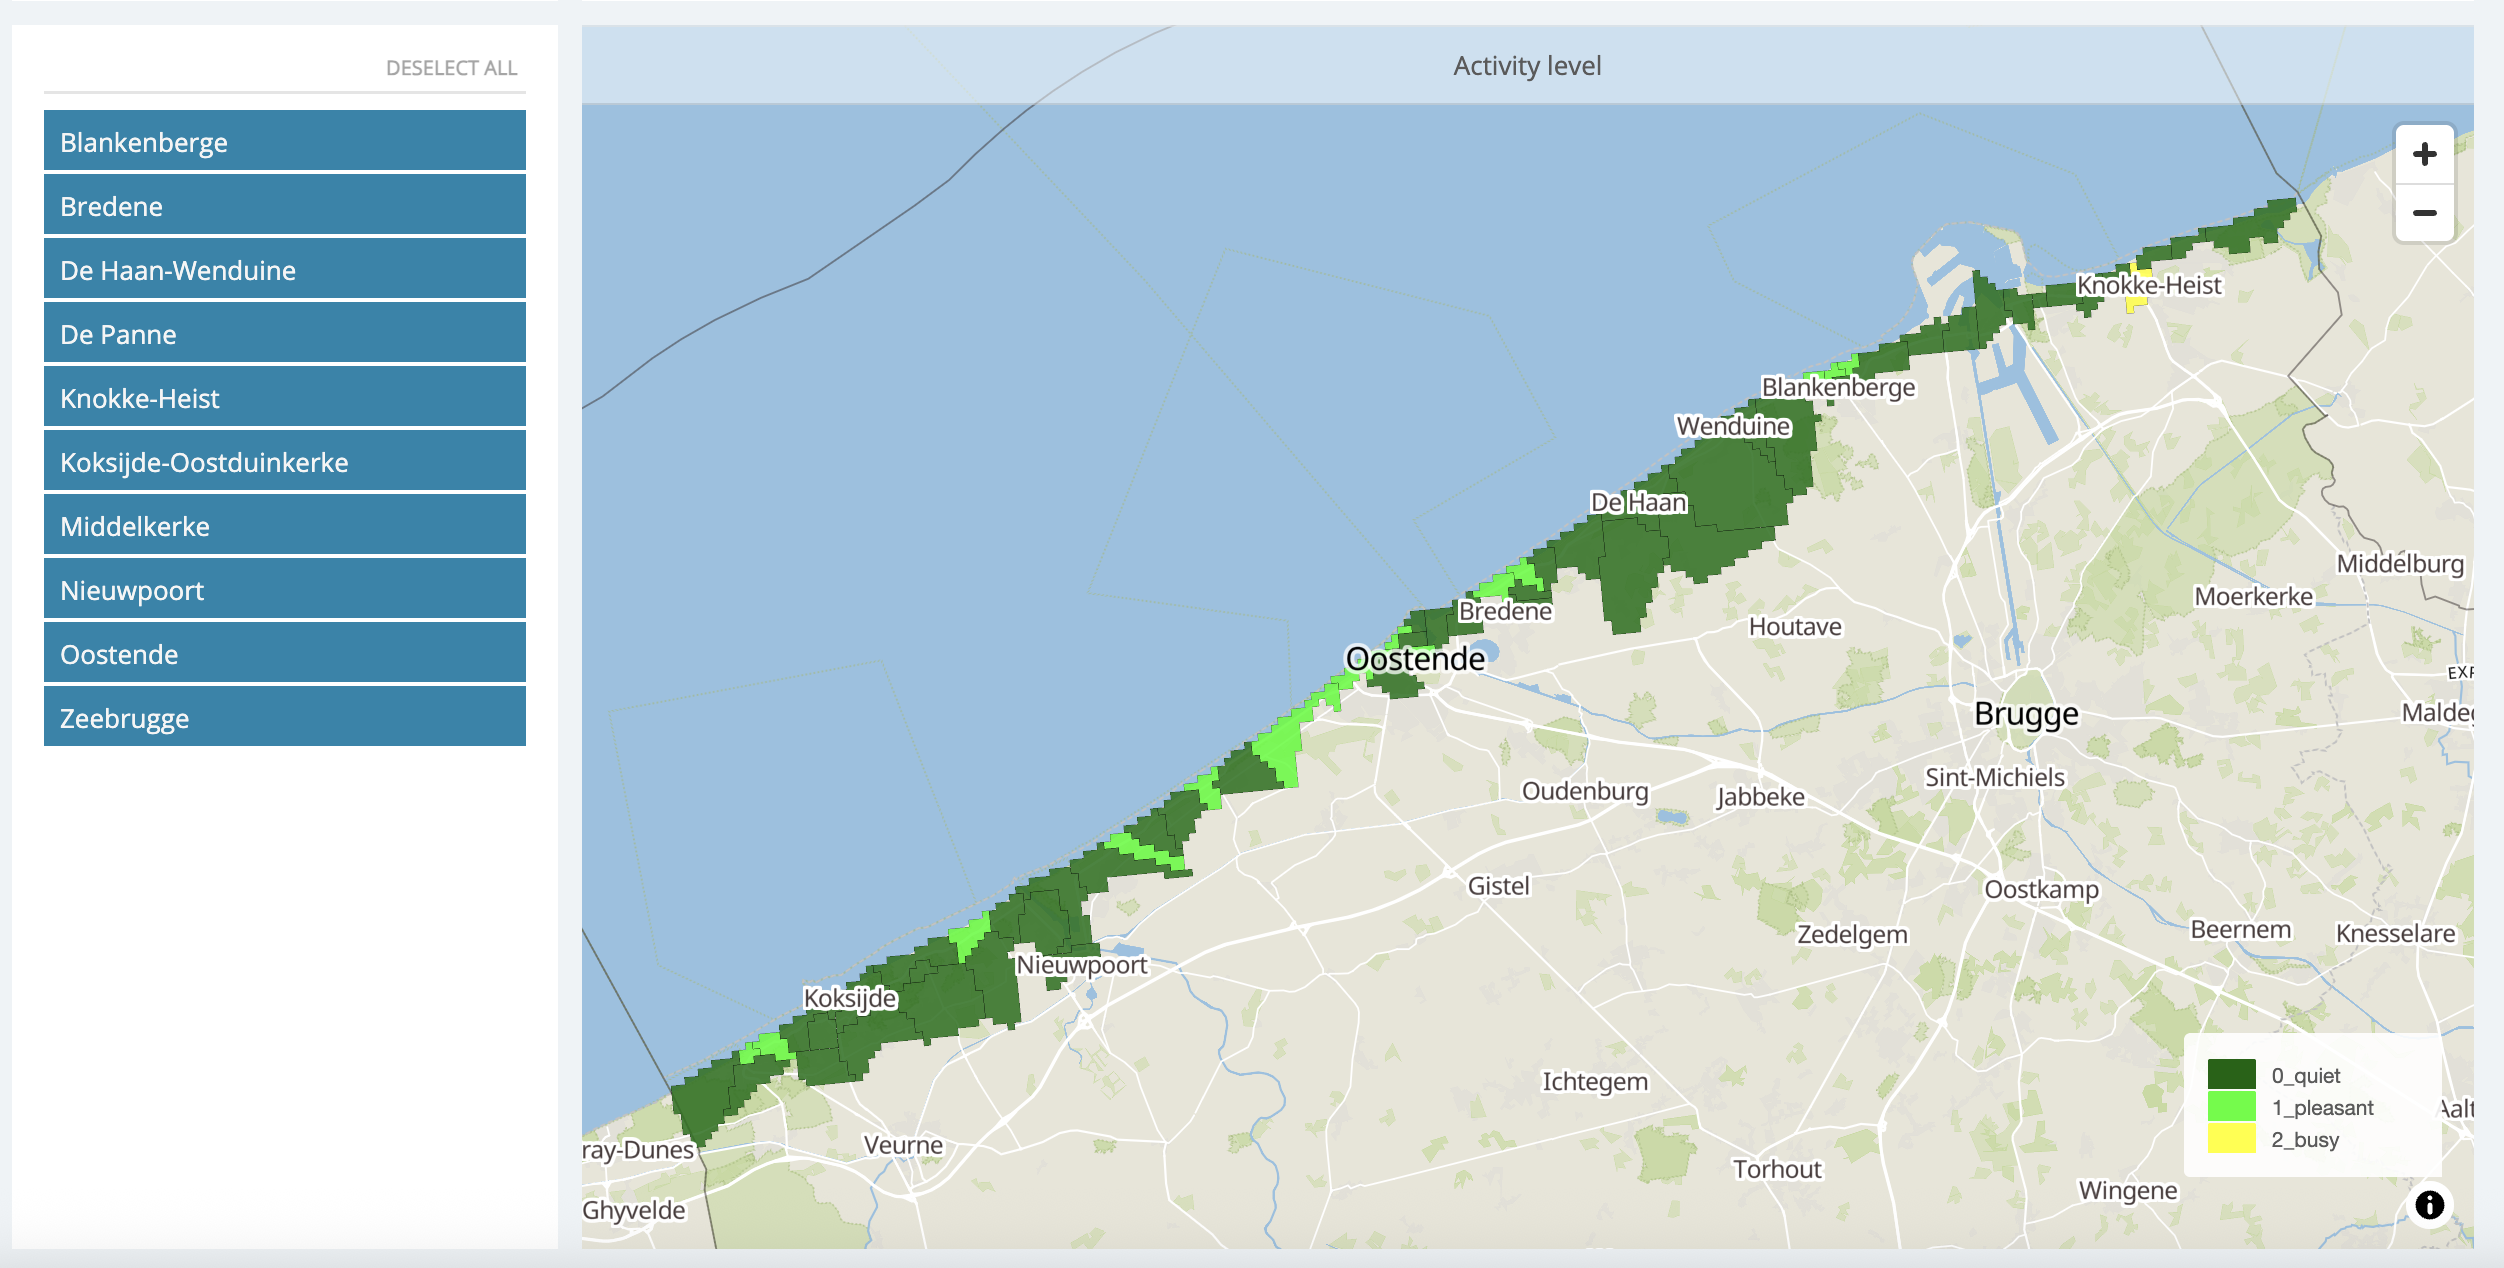
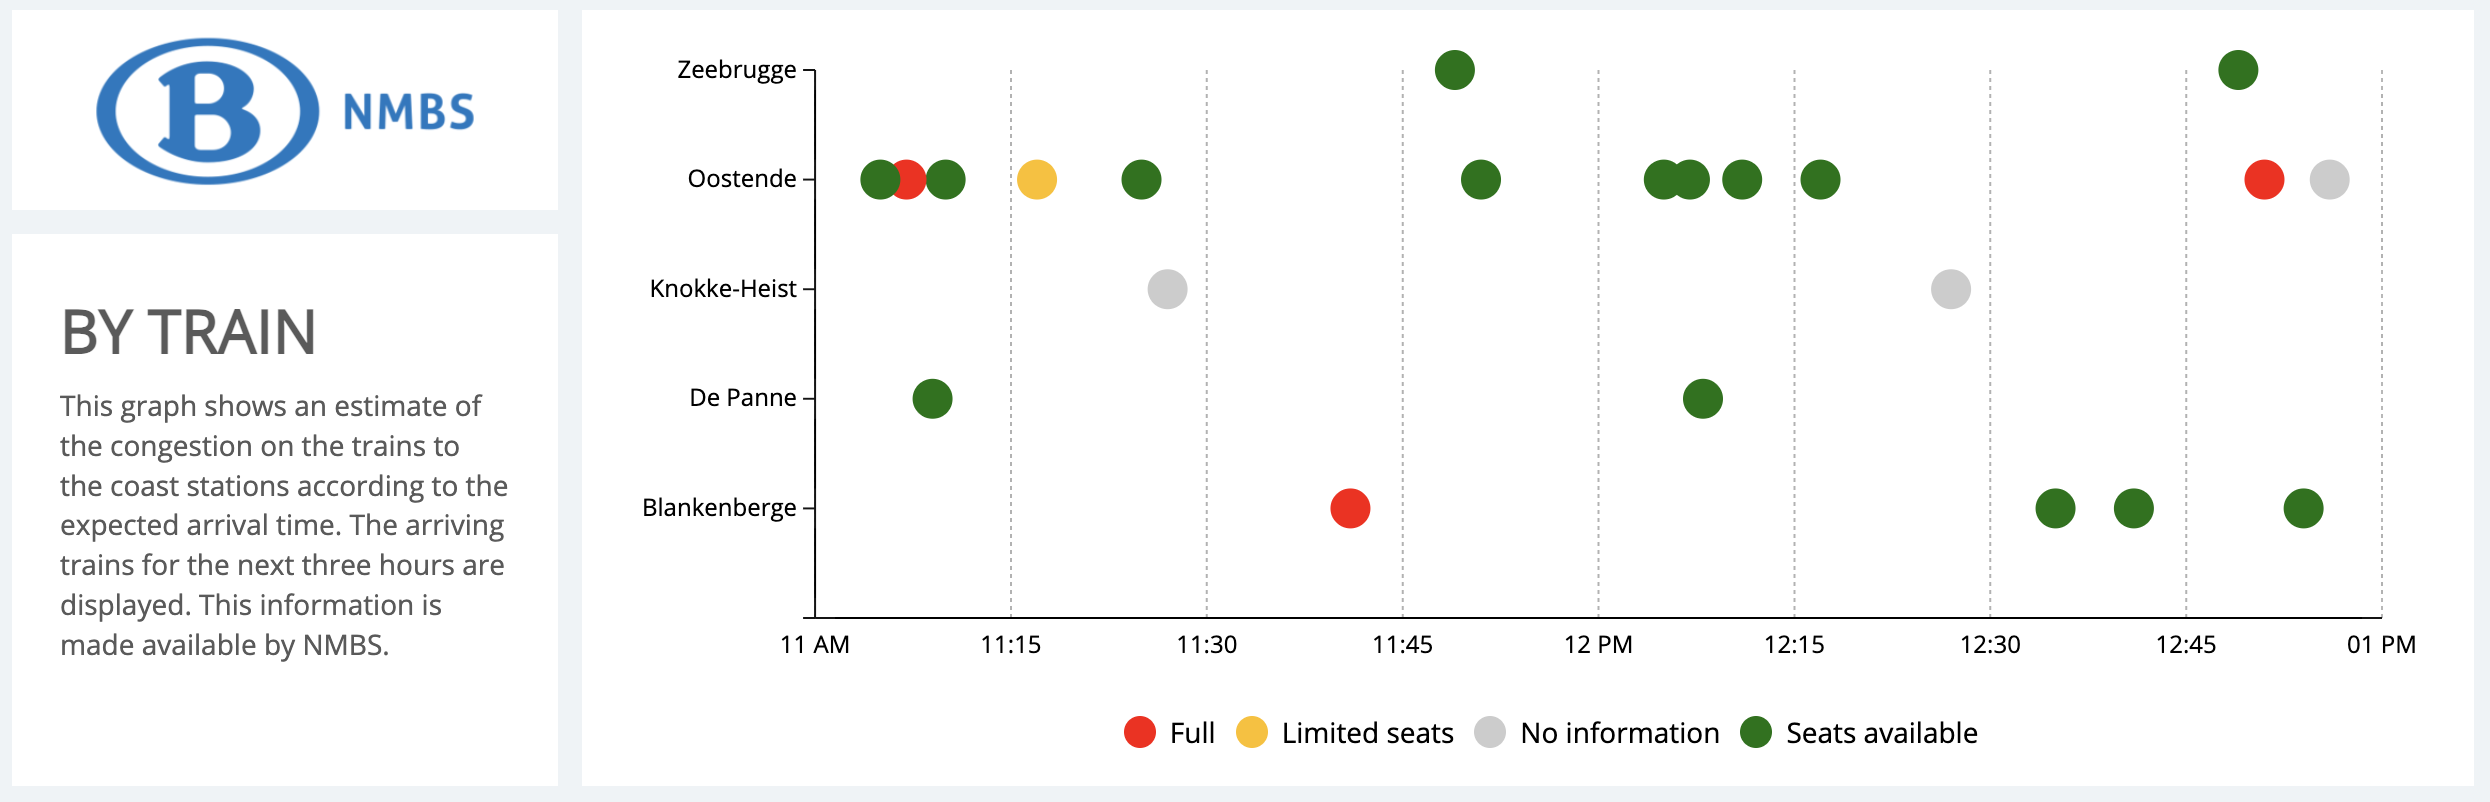
Using anonymized mobile network data from Proximus, Westtoer gets more insights on how many people are visiting the coast right now. They display all of that location data in interactive, color-coded Luzmo dashboards, available online and updated every 15 minutes.
Tourists, locals and policymakers can use the crowd barometer to find out:
Visitors can check the crowds in their favorite coastal area on a simple, interactive map:
Darline Vandaele, Team Manager at Westtoer's Knowledge Center, explains why they needed a simple interface:
“We weren’t just interested in recording the real-time density, but also hoped to gain insights at the zonal level across all our managed sites. It was essential for the graphic interface to be accessible to policymakers and tourists. The color-coded dashboards did the job perfectly.”
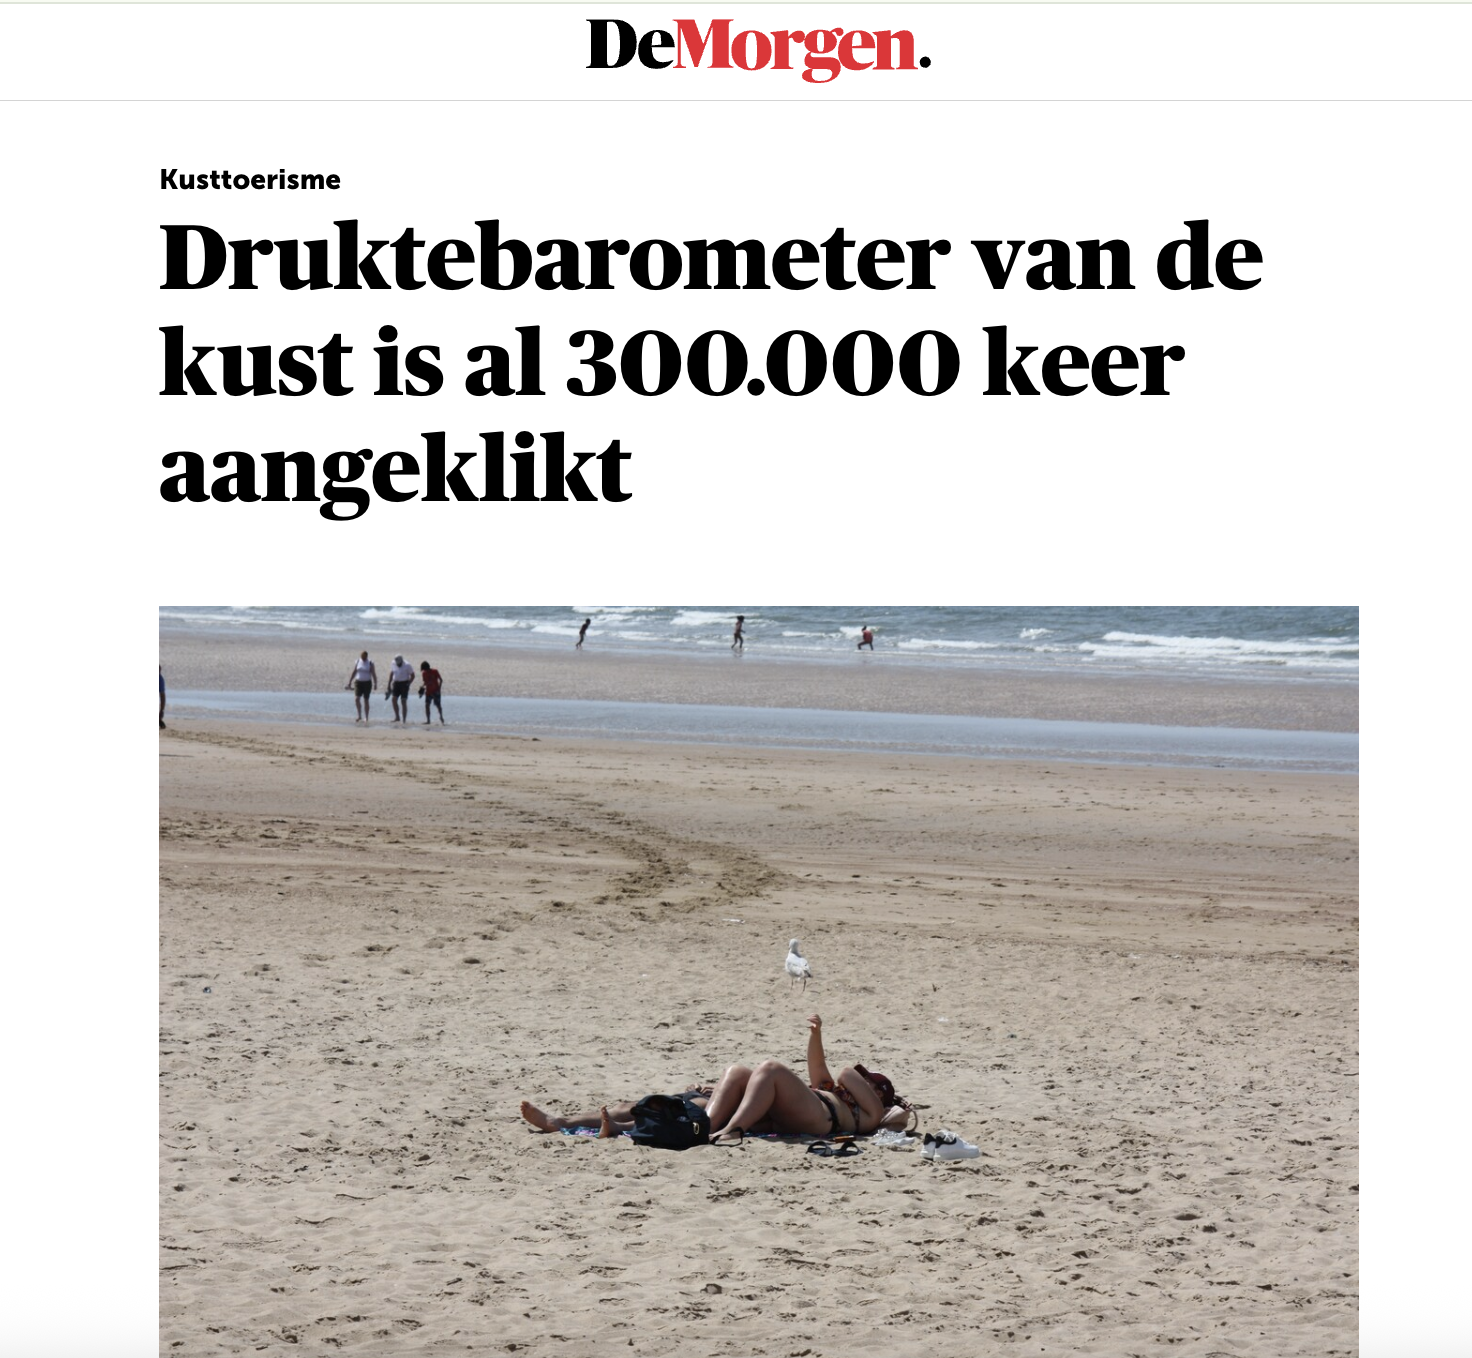
The barometer was originally launched during the COVID-19 pandemic, when overcrowding at beaches and parks posed major health risks. By the end of the summer in 2020, over 1.9 million users had consulted the dashboards, peaking at up to 80,000 daily visits. And most importantly, people could enjoy their trip safely and stress-free.
The success of the project quickly proved its long-term value. What started as a safety measure became a lasting tool for smarter tourism planning. Proximus' anonymized location data and Luzmo’s flexible dashboards made it possible, offering real-time, intuitive access to live data that anyone could understand and act on.
Want to turn your geolocation data into smart, real-time insights? Luzmo can help! Discuss with our experts how we can help you visualize and share live crowd, traffic, or event data with citizens and decision-makers alike.
Build your first embedded data product now. Talk to our product experts for a guided demo or get your hands dirty with a free 10-day trial.


