From Mockup To Dashboard Prototype In Minutes With AI

Building customer-facing analytics for your SaaS app involves a lot of work. Before you can start development, you need to scope requirements, design a dashboard mockup, gather customer feedback, and validate your offering with interactive prototypes
The entire process can easily take weeks. But with a few handy tools, you can remove bottlenecks and speed up your analytics roadmap.
In this article, you’ll learn how to turn a dashboard mockup into an interactive dashboard in minutes with Instachart! Whether drawn by hand or designed in Figma, our AI-powered dashboard generator turns any image into a working Luzmo dashboard.
Wireframes vs dashboard prototypes
As a product manager, you may wonder if you really need a wireframe or static mockup of your dashboard. It’s tempting to skip straight to interactive prototyping for a few reasons:
- Prototypes are interactive, mockups are not
- Prototypes allow better usability testing and debugging across browsers and platforms
- With a working dashboard prototype, you’ve already done 80% of the work needed to deploy analytics as a functionality in your product
So why not cut out this extra step in the process? For some companies, this might be the right choice. But in other cases, creating a mockup adds many benefits:
- Mockups are much quicker to create than prototypes, which helps with quick design iteration early on.
- You don’t need coding skills to create a mockup, so you can avoid wasting engineering time on building several prototypes that still need to be validated.
- Building a dashboard prototype requires coding skills or specialized tools, while your product designers prefer working with their favorite design tools like Figma or Balsamiq.
Mockups are great for getting key stakeholders aligned on the dashboard UX design. But once your mockup is perfected, rebuilding your design as an interactive dashboard prototype can feel repetitive. However, it doesn’t need to be that way.
From mockup to interactive data visualization in 4 steps
To help you save time during the dashboard design process, we created a nifty tool called Instachart. This AI tool, powered by the exclusive GPT-4-Vision, turns your mockups into interactive dashboards in one click. It’s as easy as bibbidy-bobbidy-boo!
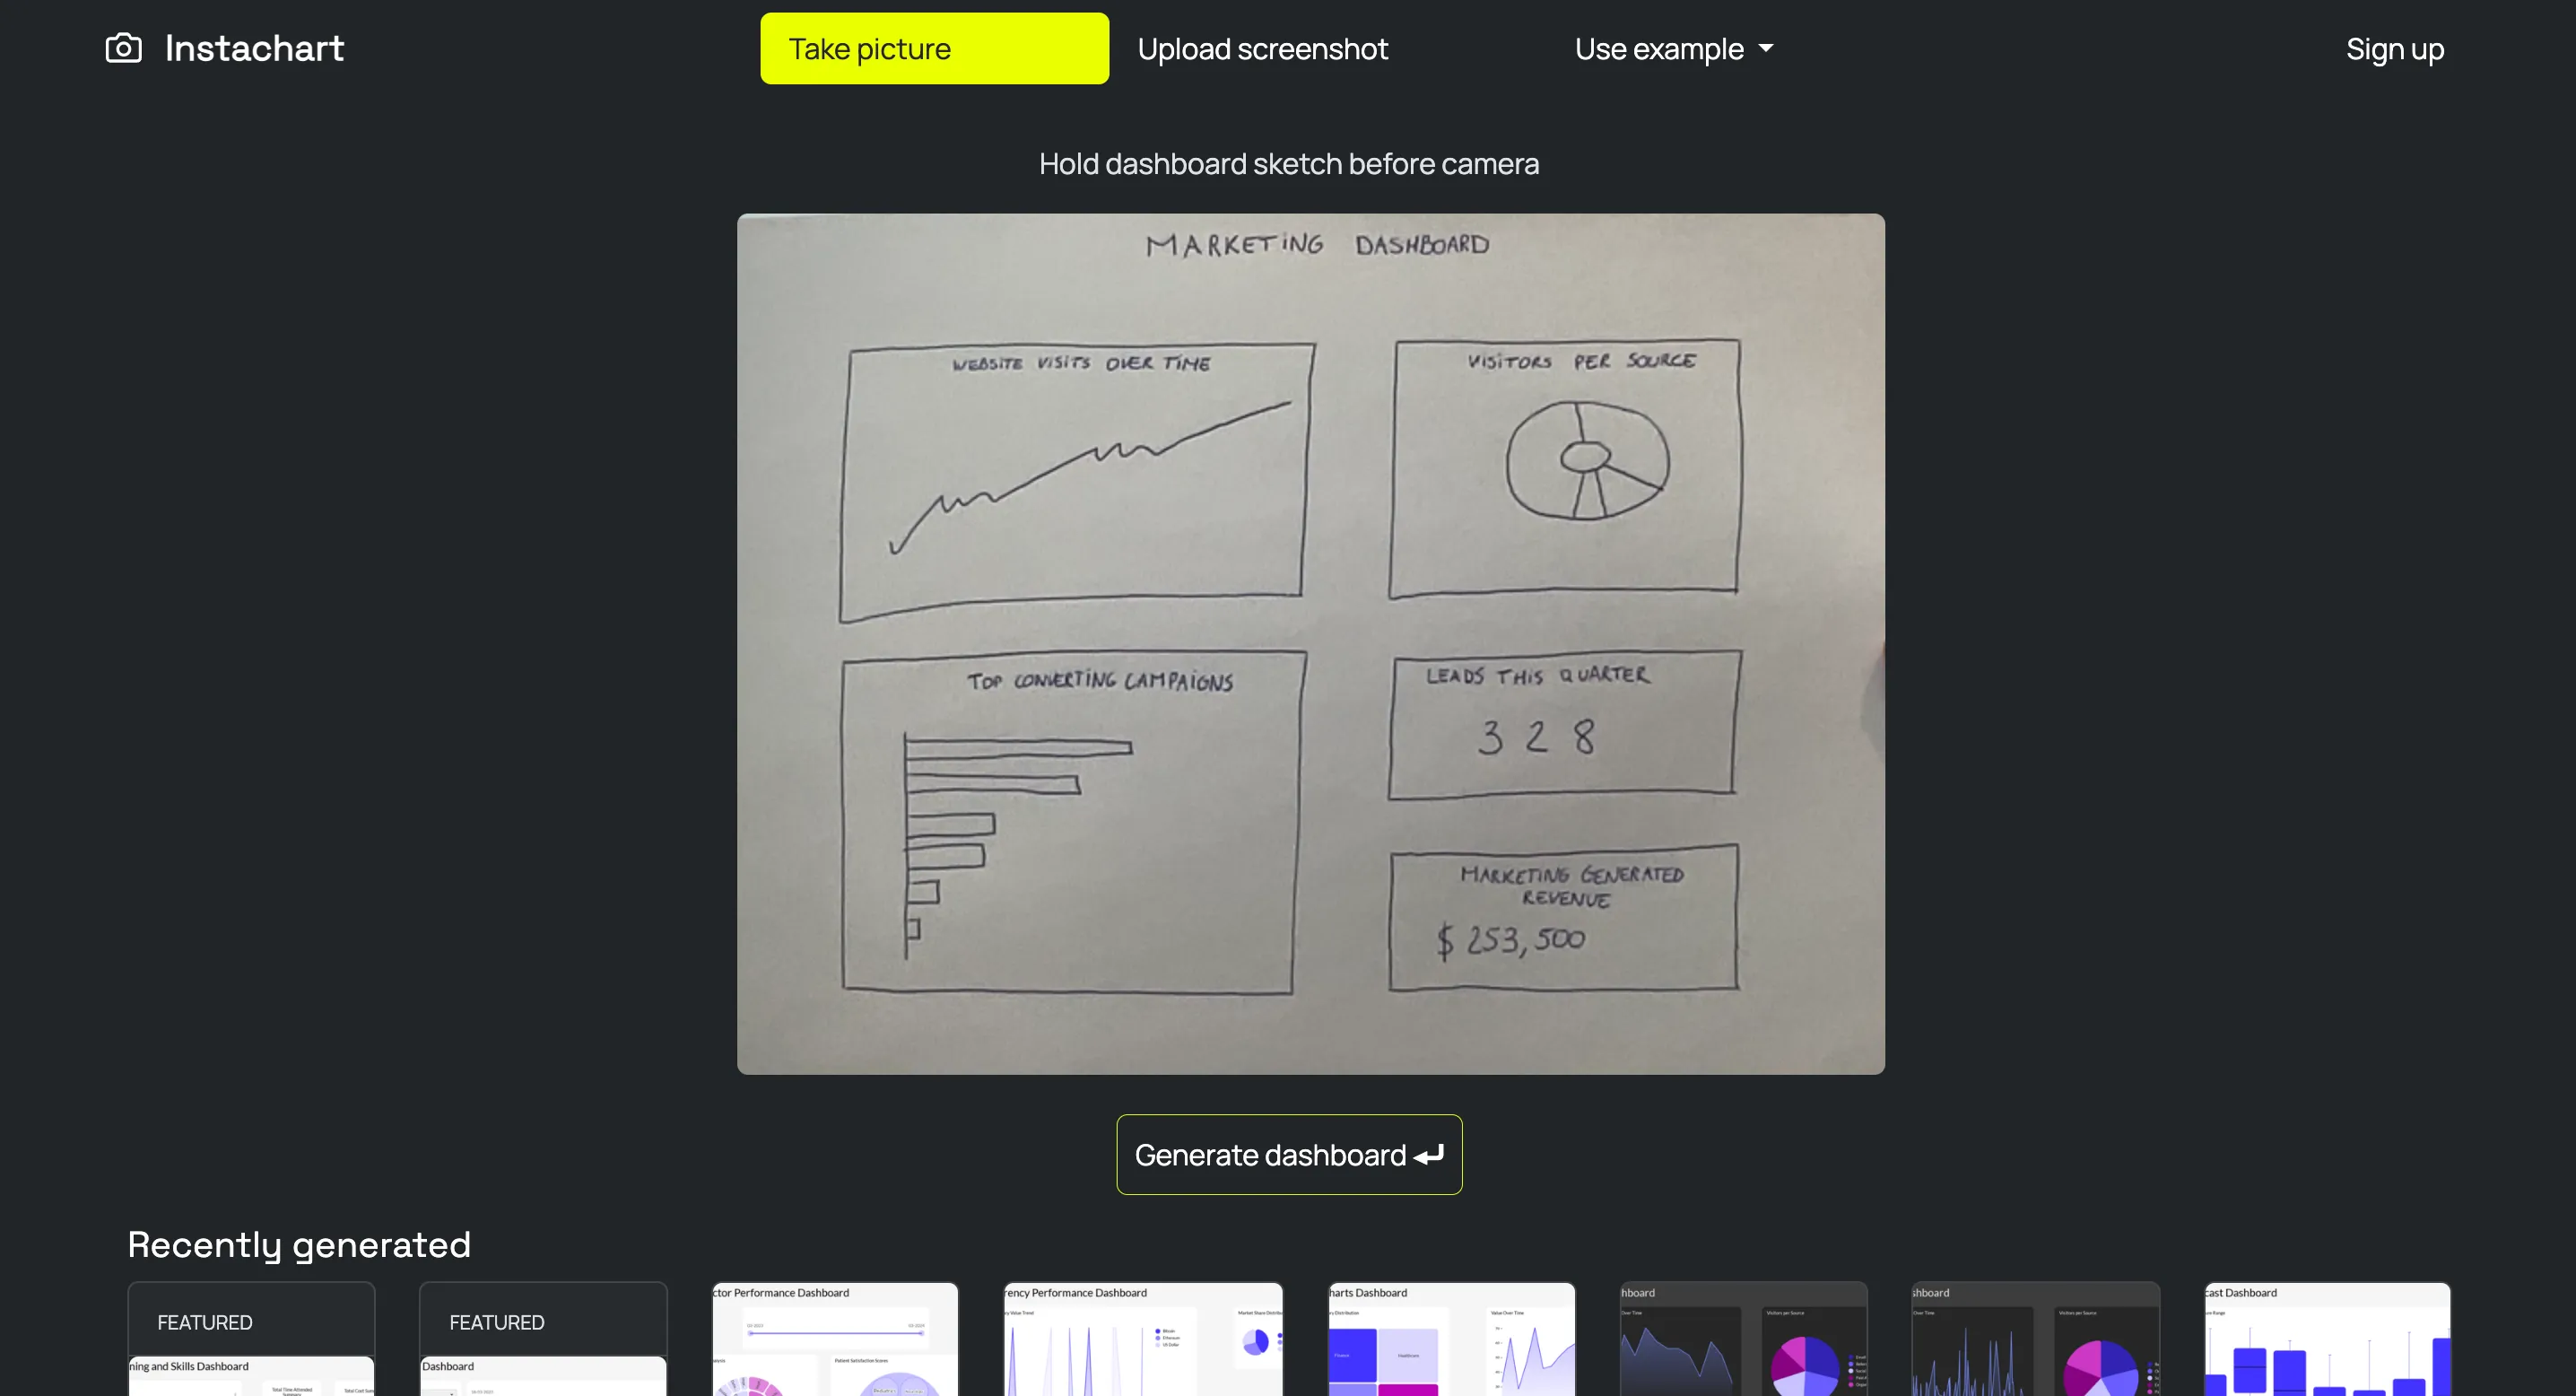
Step 1: Upload your dashboard wireframe or mockup
Create a mockup of your dashboard in whichever way your team members like best. This can be:
- A carefully crafted dashboard UI design in Figma
- A roughly designed wireframe in Balsamiq, Illustrator, or other wireframing tools
- A hand-drawn sketch of a dashboard on a piece of paper
- A picture of a dashboard wireframe drawn on a whiteboard
Our AI tool will generate demo data to match your mockup. Once that’s done, it will start transforming your visual design into an interactive Luzmo dashboard on the spot!
You'll go from this...
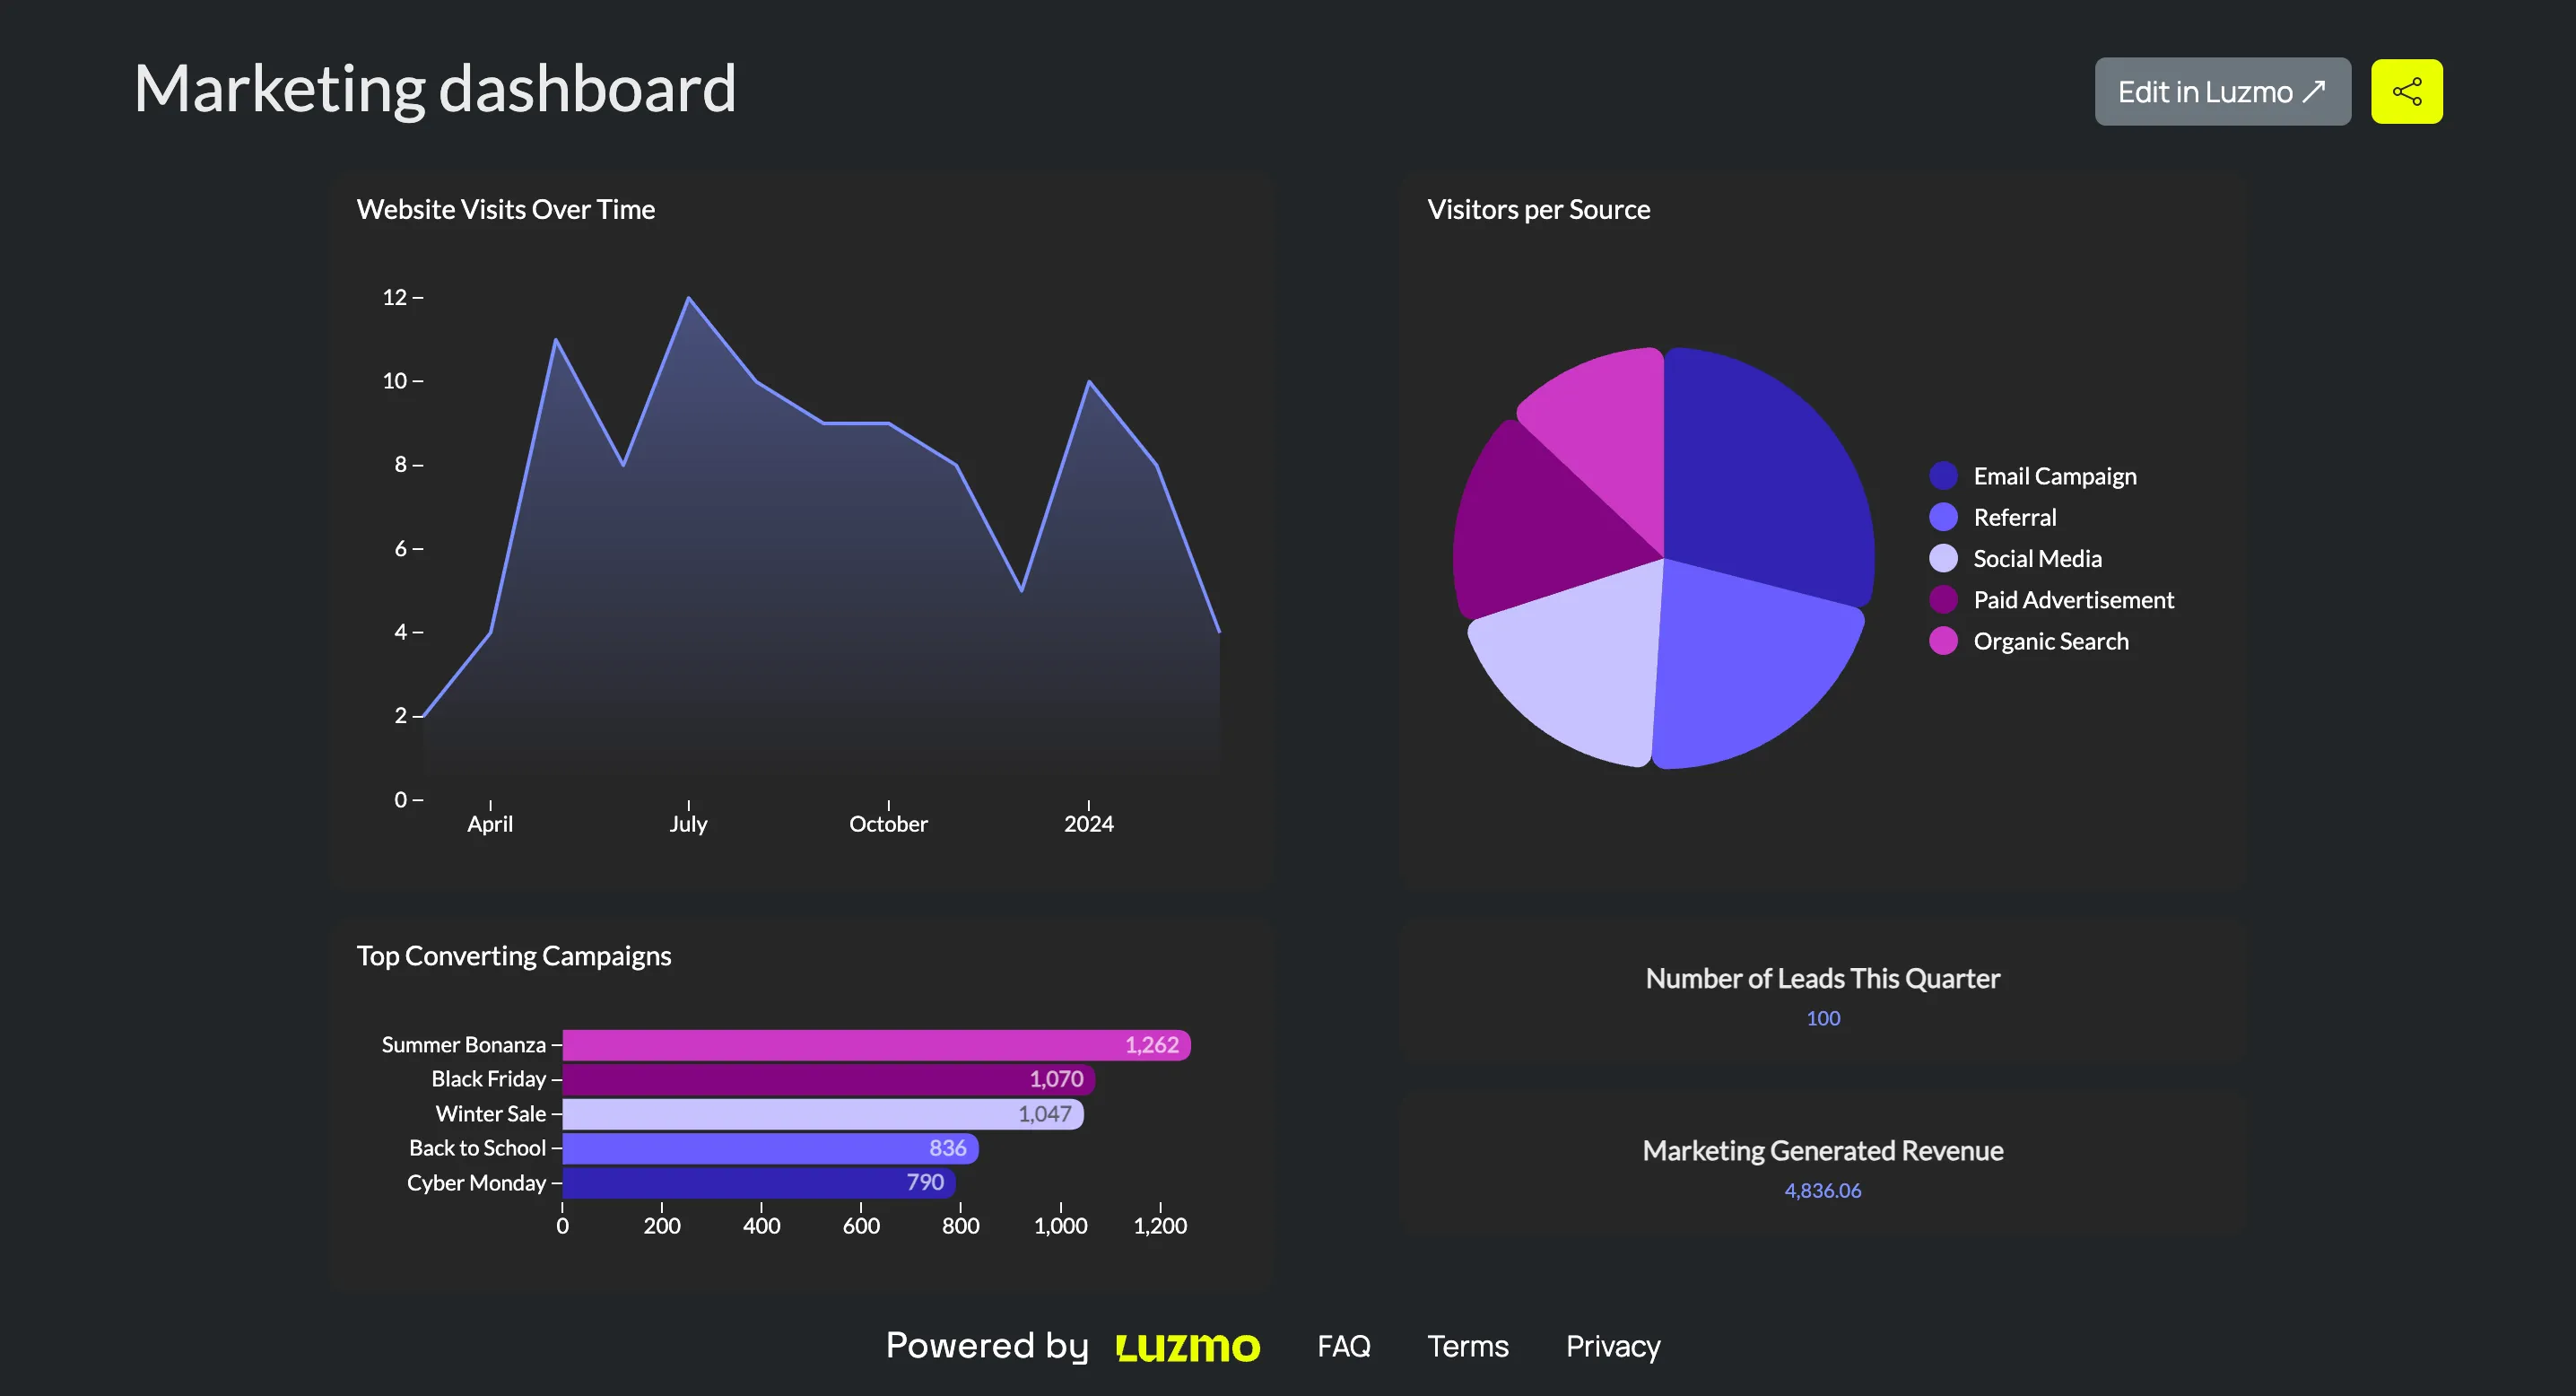
... to this in minutes!
⚠️ Important note: all datasets and dashboards generated by Instachart are public. Consider this before uploading confidential data or information in your mockups. For more info, check out the Instachart FAQ.
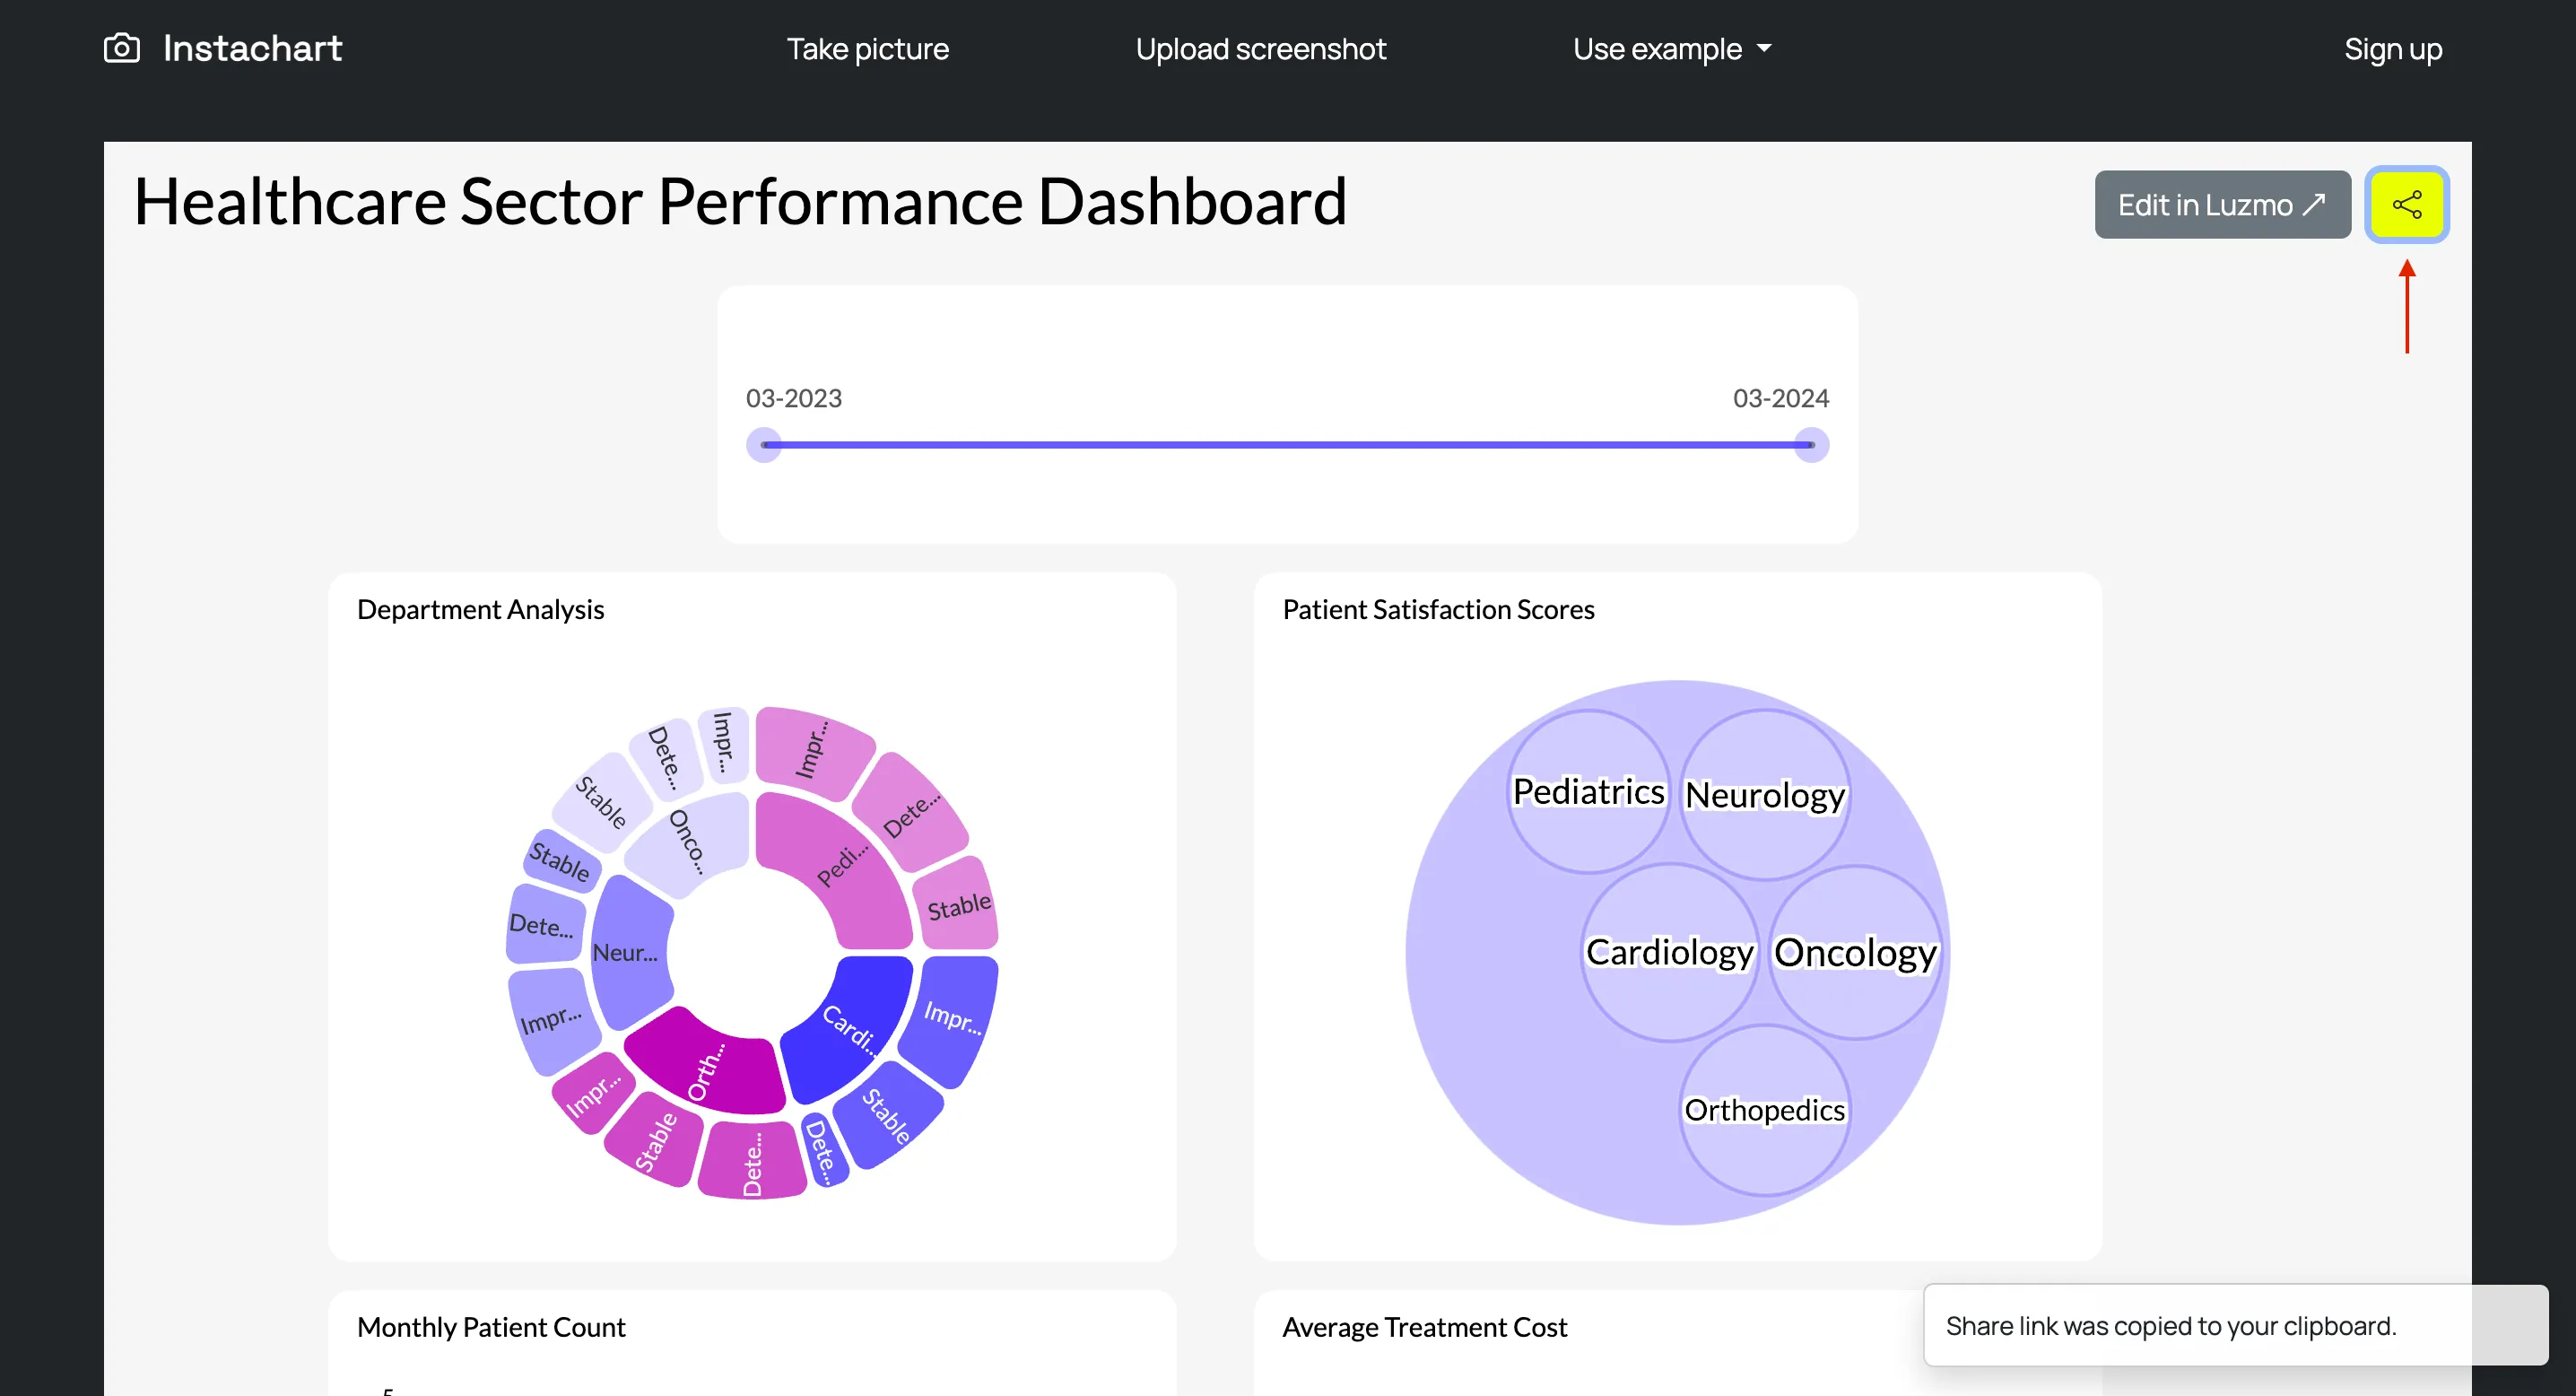
Step 2: Share your dashboard prototype
After a short wait, your freshly generated dashboard will appear! You can now explore the data, filter charts, and engage with the insights on your dummy dashboard. Share it with your team for further validation, or show it to customers to get their feedback.
With one click, you can share a link to the interactive dashboard in Instachart with your colleagues or customers via email, Slack, or whichever communication channel you prefer.
These two steps are all you need to turn a static image into a high-fidelity prototype in Luzmo with zero effort. But if you want to tweak your AI-generated dashboard further, your journey is far from over!
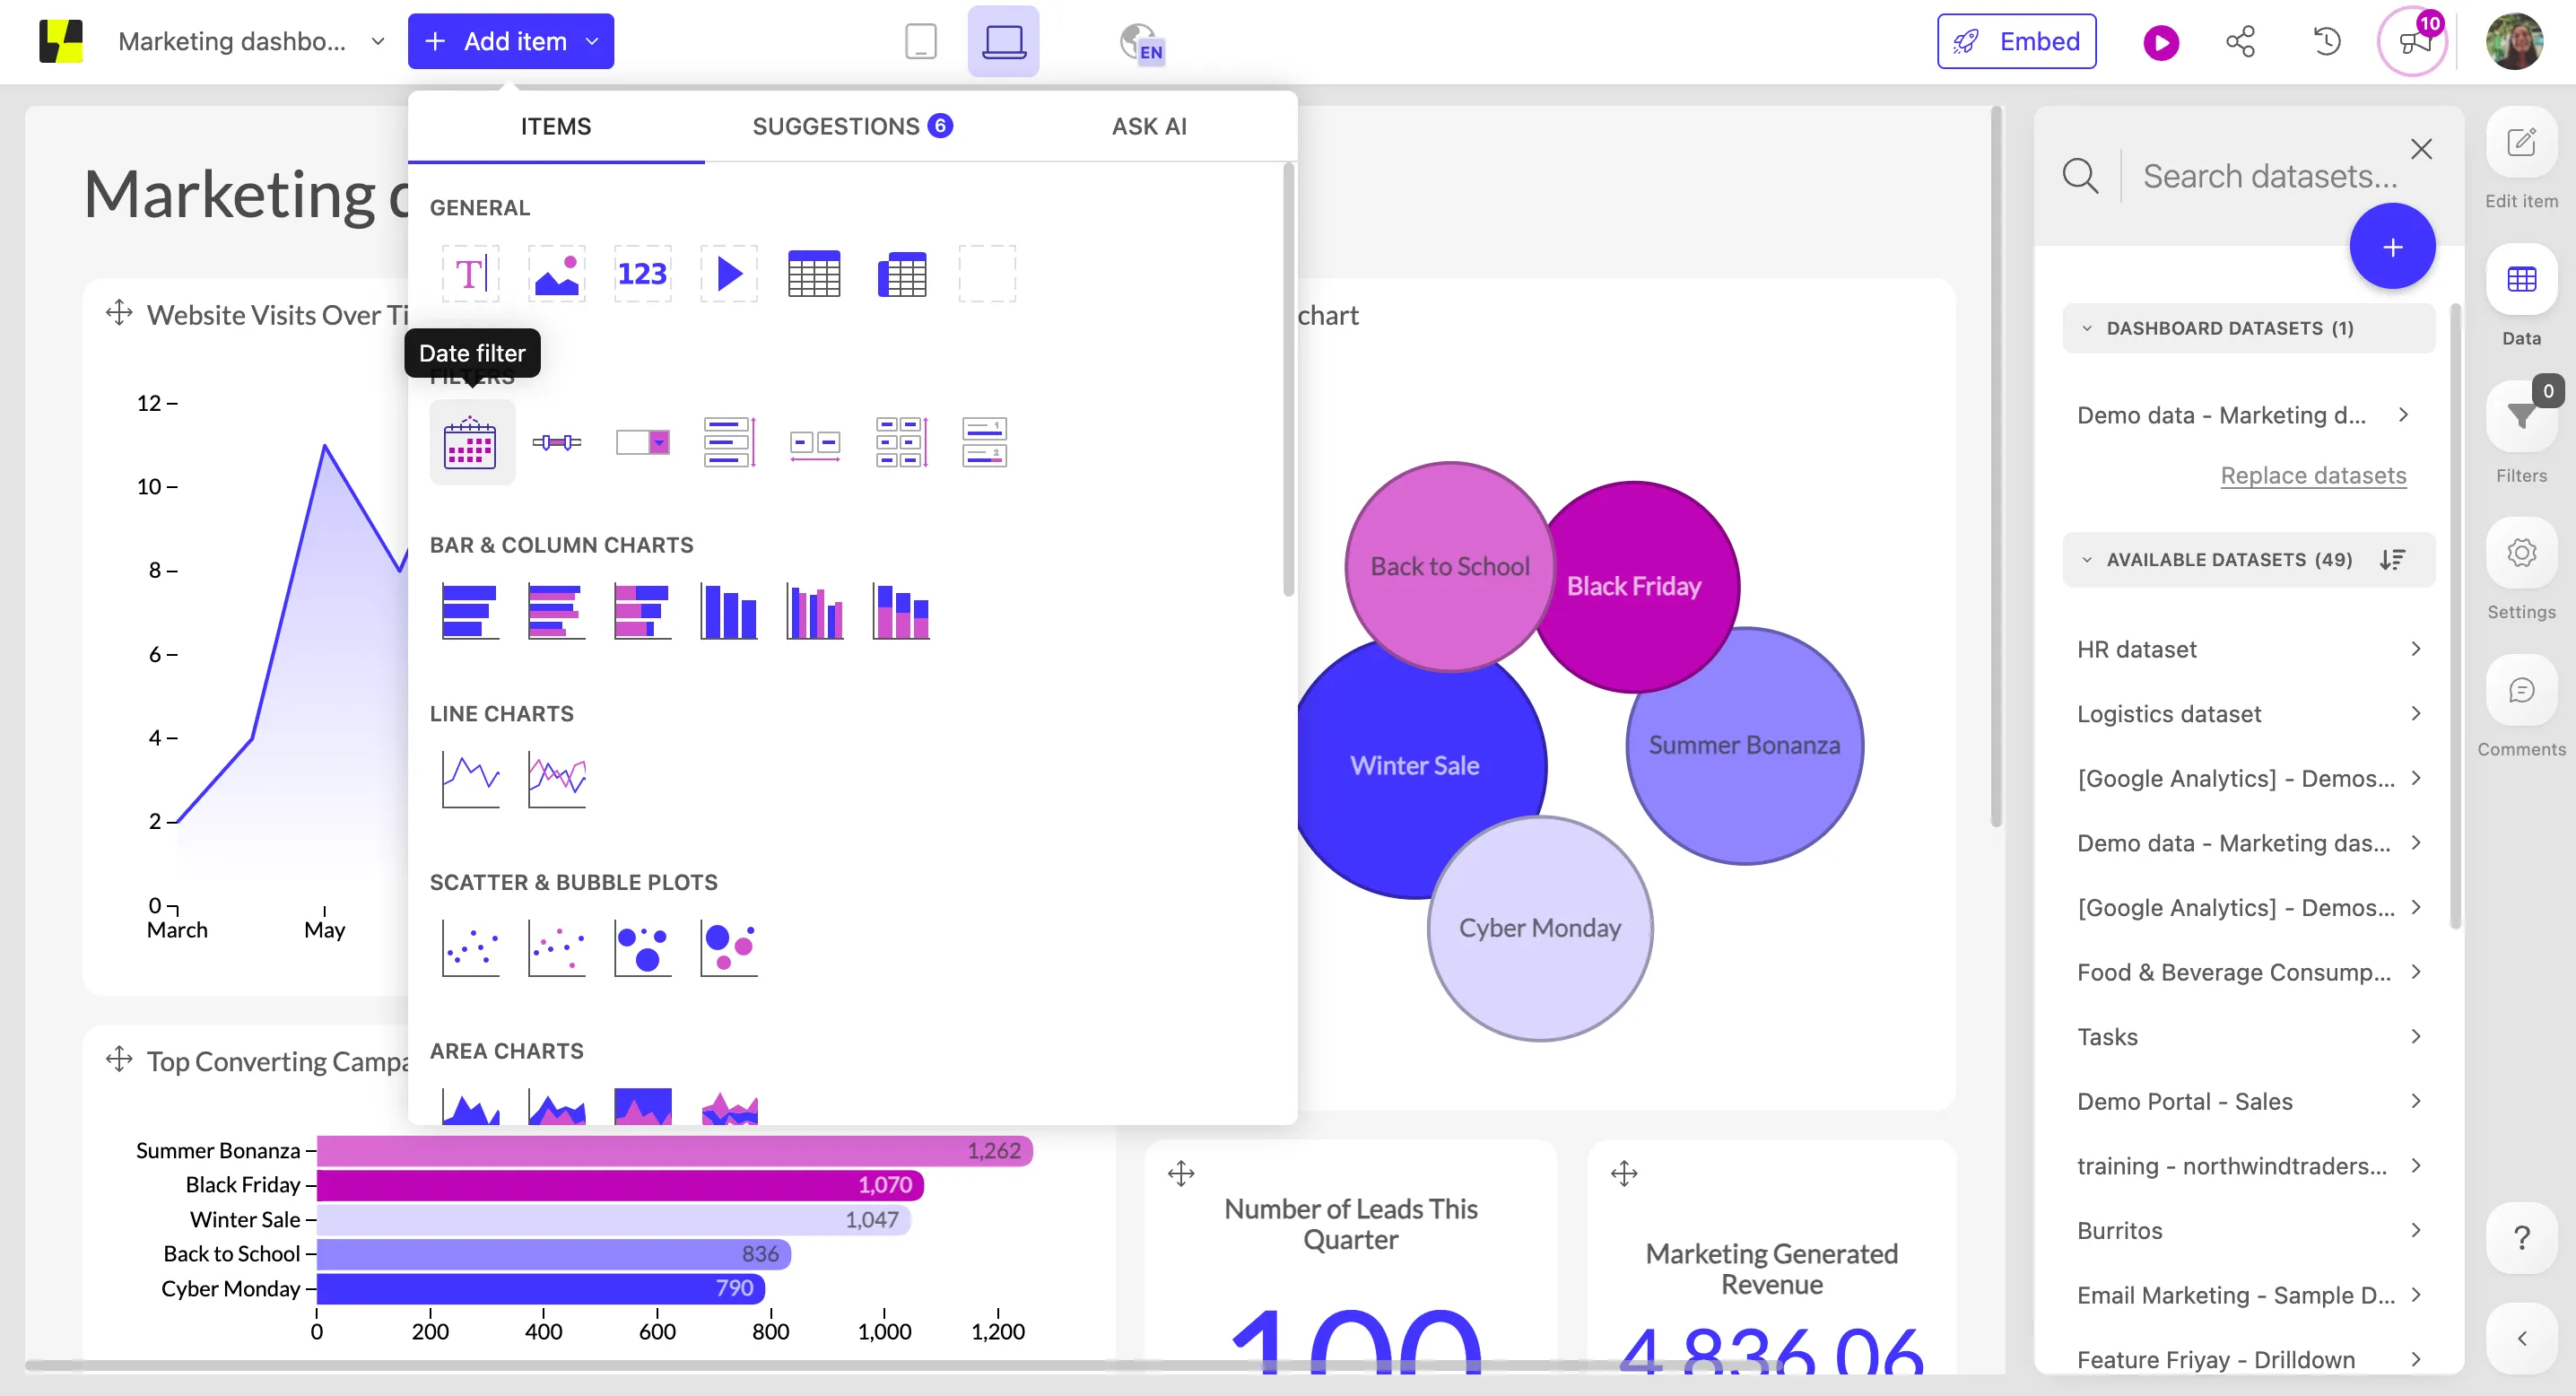
Step 3 (optional): Make edits to the dashboard
If you want to further refine your dashboard prototype, you'll need to sign up for a Luzmo account (free trials available here). Once you're signed in, click the "Edit in Luzmo" button in Instachart to import the dashboard into your Luzmo account.
Now, you can edit everything to your liking: change the colors, chart types, titles, graph sizes, fonts, or add entirely new metrics and KPIs. You can even embed dashboards into your SaaS app or website. Whatever you wish!
With Luzmo’s intuitive drag-and-drop editor, there’s barely a learning curve. Perfecting the final product is just as easy as creating it!
Do you prefer using your own datasets instead of mock data? Connect any data source to Luzmo, and replace the data in your AI-generated dashboard with your private data. Pro tip: if your dataset has a similar structure to the sample dataset, you can use Luzmo’s handy replace data tool to update the data in one click!
Build customer-facing analytics at rocket speed
Gone are the days when your data scientists spent their days tinkering in Tableau or Power BI. AI is going to revolutionize how fast you can build stunning visualizations for your end-users, without writing a single line of code.
With Luzmo’s embedded analytics platform, product teams can add client-facing dashboards to their SaaS product in days, not months. Creating your first mockup is now as easy as uploading a picture, so why not give Instachart a try today?
Curious what else our platform can do? Book a demo with our experts, and see for yourself how easy data-driven decision-making can be for your customers!
Written by

Ship the future of your data
Let us show you what Luzmo can do for your product.

Leave your e-mail and one of our analytics experts will reach out to you