Embedded Analytics vs BI Tools: Where Each Approach Breaks Down
There's no shortage of content comparing embedded analytics to traditional BI. Most of it boils down to a tidy narrative: BI tools are for internal teams, embedded analytics is for customers, pick the right one and you're set.
Reality is messier than that.
Both approaches fail — just in different ways and for different reasons. BI tools are extraordinary at what they were designed for, until you try to shove them into a product. Embedded analytics solves the product problem elegantly, until someone expects it to replace their data team's analytical toolkit. The interesting question isn't which is "better." It's understanding exactly where each approach breaks down, so you can stop fighting the wrong tool and start using the right one.
What BI tools were actually built to do
Before talking about where BI tools struggle, it's worth recognizing what they're genuinely excellent at.
Tools like Power BI, Tableau, Looker, and Qlik were built for internal teams — analysts, finance, operations, leadership — who need to explore data, build reports, and answer questions that weren't anticipated when the dashboard was designed. These are users who've been trained on the tool, who understand data modeling at least at a conceptual level, and who are willing to invest time learning because the tool is central to their job.
In that context, BI tools are remarkably powerful. They offer deep exploration capabilities, massive connector ecosystems, sophisticated data modeling, mature governance and security frameworks, and the ability to handle complex, ad hoc queries across enormous datasets. Microsoft dominates the space for good reason — Power BI's integration with the broader Microsoft ecosystem and aggressive pricing has driven adoption that Gartner describes as market-leading for over 17 consecutive years.
For internal analytics, the BI model works because the users are analysts — or at least analyst-adjacent. They expect a learning curve. They want flexibility. They'll tolerate a tool that takes weeks to set up if it gives them the power to answer any question they can think of.
The trouble starts when someone says: "Our customers need analytics too. Let's just embed this."
Where BI tools break down inside products
The decision to embed a BI tool into a customer-facing product usually seems reasonable. The logic goes: we already have Power BI (or Tableau, or Looker), our team knows it well, and it can technically be embedded via iframes or JavaScript APIs. Why buy another tool?
Here's where it falls apart.
Your customers aren't your analysts. This is the foundational mismatch. BI tools assume a user who wants to explore. Your product's end users — marketers, account managers, small business owners, operations staff — want answers. They're not logging into your product to analyze data. They're logging in to do their job, and they expect the analytics to tell them what matters without requiring training or a data science background.
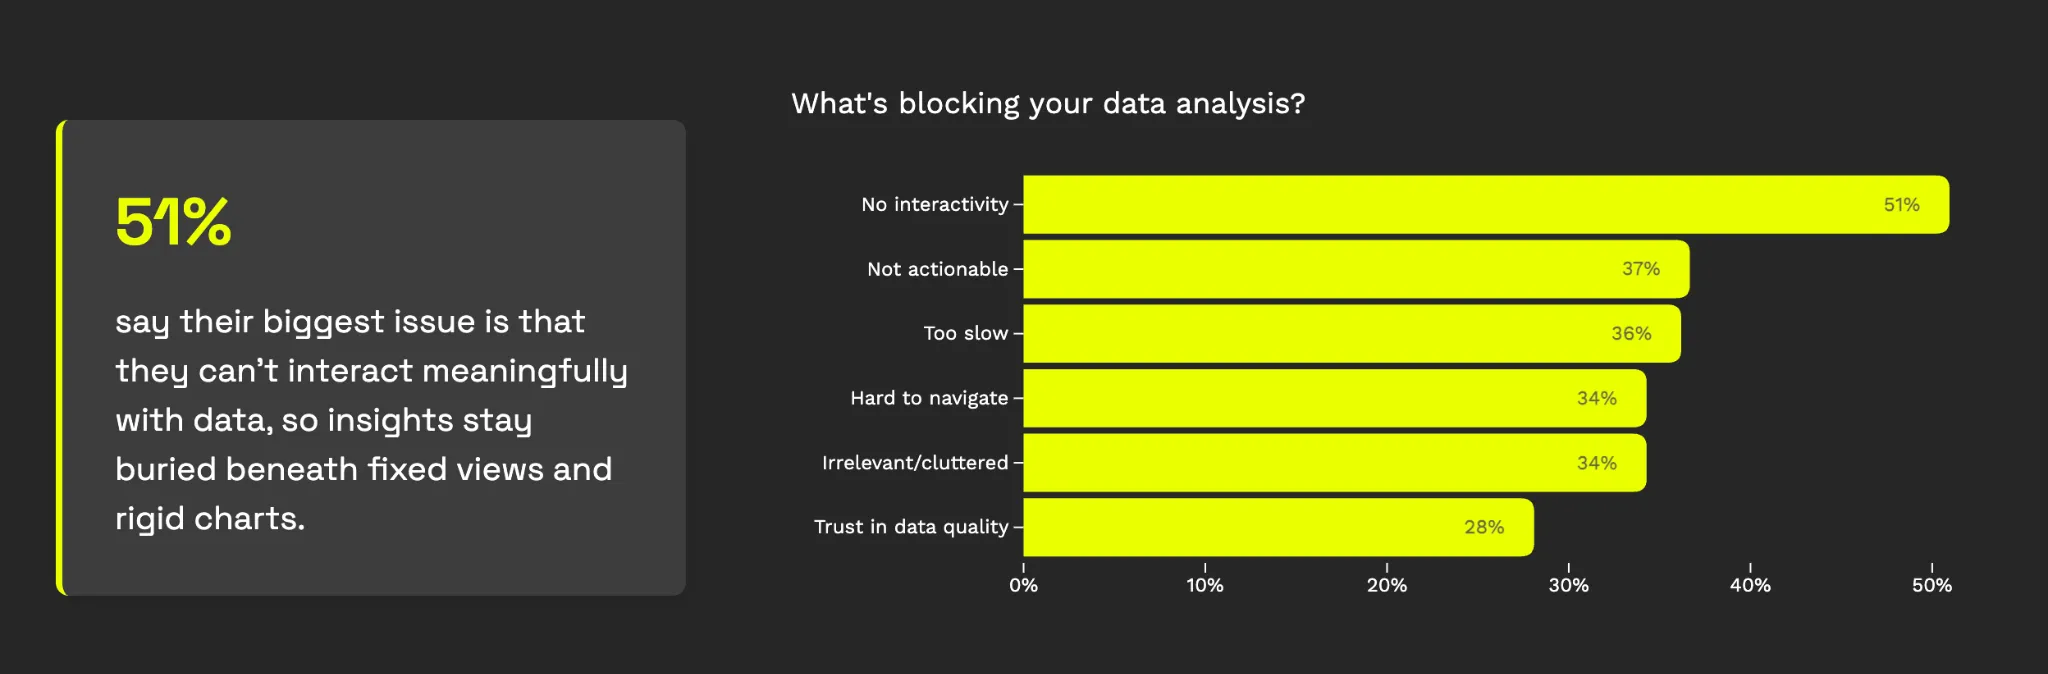
Luzmo's 2025 State of Dashboards research — surveying 200+ SaaS leaders — quantifies this gap: 34% of users spend too much time navigating dashboards searching for insights. Another 34% find them too cluttered with irrelevant information. And 37% say the data presented isn't clear or actionable. These are the symptoms of tools designed for analysts being shown to people who aren't analysts.
The user experience doesn't blend. Traditional BI tools embed through iframes, which means the analytics layer loads as a separate application inside your product. It looks different — different fonts, different spacing, different interaction patterns. Load times balloon because the BI tool is fetching data through its own infrastructure rather than rendering natively. Luzmo's own research into BI tool embedding found that tools like Power BI can take 20+ seconds to load a dashboard in an embedded context. For an internal analyst who keeps a BI tab open all day, that's tolerable. For a product user who clicked into an analytics tab while doing something else, it's a reason to never come back.
Multi-tenancy becomes an engineering project. BI tools were designed for one organization's data. When you embed them into a SaaS product serving hundreds or thousands of customers, each needing to see only their own data, you're fighting the architecture. Row-level security exists in most BI platforms, but configuring it at SaaS scale — with dynamic tenant isolation, SSO integration, and per-customer access controls — typically requires significant custom engineering on top of the tool. What was supposed to save development time ends up consuming it.
Product teams lose ownership. When analytics lives inside a BI tool, it's usually the BI team or data team that builds and maintains the dashboards. Product managers who want to change a metric, adjust a visualization, or respond to user feedback have to file a ticket and wait. Luzmo's research found that 67% of SaaS teams have low confidence in the value of their in-app analytics, and 41% spend more than four months building dashboards. That timeline makes sense when you realize the product team can't iterate directly — they're dependent on a different team using a different tool.
Costs become unpredictable. BI tool pricing was designed for known internal user counts. When you embed into a product, your "user count" is your customer base — and it grows (hopefully). Power BI Embedded, for instance, charges based on compute capacity rather than users, which sounds flexible until dashboard usage spikes and your Azure bill follows. Tableau's embedded pricing requires a sales conversation and custom quotes. For SaaS companies trying to plan around predictable margins, this model introduces uncomfortable unknowns.
What embedded analytics was built to do
Embedded analytics platforms — and this is the category Luzmo was purpose-built for — start from a fundamentally different premise: the user is not an analyst.
Instead of optimizing for depth and exploration, embedded analytics optimizes for speed and clarity. The goal is to put the right insight in front of the right user at the right moment, inside the workflow they're already in, with zero learning curve.
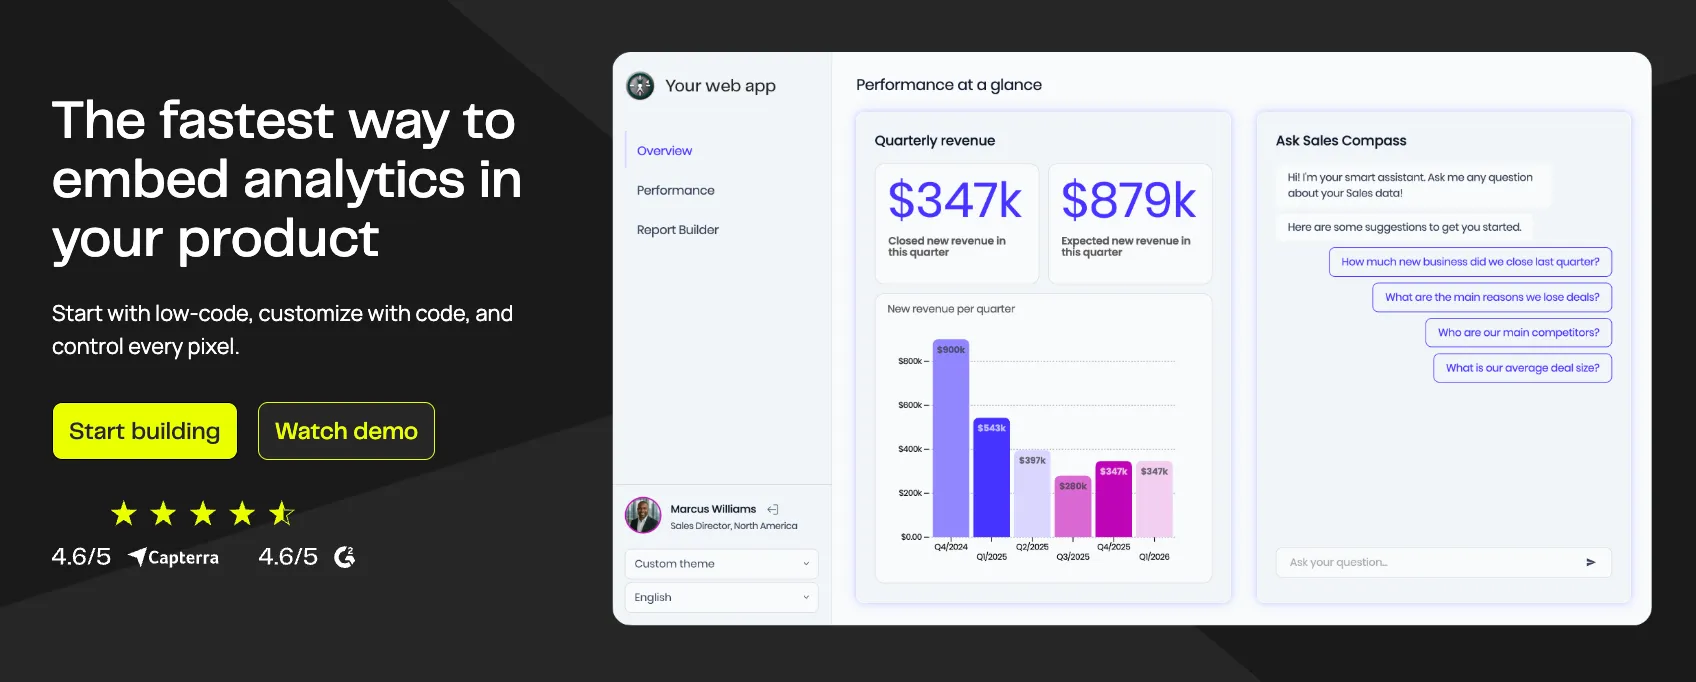
This means native rendering (no iframes), full brand customization down to fonts and spacing, API-first architecture that lets developers integrate analytics as a first-class product feature, and multi-tenancy built into the core rather than bolted on top.
The user experience difference is substantial. Where a BI tool might give a user 15 charts and let them figure out which one matters, a well-implemented embedded analytics experience surfaces 2-3 focused insights tied to specific decisions. Where a BI tool loads in its own frame with its own interaction model, embedded analytics feels like part of the product — because it is.
When this works, the impact on user engagement is real. Luzmo's research found that 50% of users interact with dashboards daily when the experience is well-designed. The gap between the 50% who engage daily and the 43% who bypass dashboards entirely for spreadsheets isn't about data availability — it's about whether the analytics experience was designed for the person using it.
The model also solves the ownership problem. Because embedded analytics platforms are built for product teams — with drag-and-drop builders, visual configuration, and deployment through the product's own codebase — PMs and designers can iterate on analytics without depending on a separate BI team. Changes ship on the product's release cycle, not the data team's backlog.
Where embedded analytics breaks down
If this article only praised embedded analytics, you'd be right to be skeptical. Embedded analytics has real limitations, and pretending otherwise leads to bad decisions.
- It's not a replacement for your internal analytics stack. Your data team still needs tools like Tableau, Looker, or Power BI for deep exploration, complex data modeling, and ad hoc analysis. Embedded analytics platforms are optimized for presenting focused insights to end users — they're not designed for an analyst who needs to write complex queries, build predictive models, or explore data without a predefined structure. If you try to use an embedded analytics platform as your internal BI tool, your data team will be frustrated.
- It depends on clean, modeled data. Most embedded analytics tools assume your data is already structured, cleaned, and ready to visualize. They connect to your data warehouse or database and present what's there. If your underlying data is messy, inconsistent, or poorly modeled, the embedded layer will faithfully visualize that mess. BI tools often include data preparation and transformation capabilities that help bridge this gap; embedded tools generally don't.
- Power users can outgrow it. Some of your customers — particularly enterprise users with their own data teams — may want capabilities that go beyond what embedded analytics provides. They might want SQL access, custom calculated fields, or the ability to build entirely new views from scratch. While self-service features in embedded platforms are improving (Luzmo's own dashboard editor and Luzmo IQ address parts of this), there's a ceiling compared to a full BI tool's flexibility.
- Implementation still requires thoughtfulness. Having the right tool doesn't guarantee the right outcome. Luzmo's research makes this clear: even among products with embedded dashboards, 40% of users say they don't consistently help with decision-making, and 43% still default to spreadsheets. The tool creates the possibility of good analytics — but someone still needs to identify the right metrics, design the right views, and test whether users actually find them useful. Bad embedded analytics is still bad analytics.
The decision framework
Rather than defaulting to one approach or the other, the choice should depend on three questions:
- Who is the user? If they're internal and analytically skilled, BI tools give them the depth they need. If they're customers or external users with no analytics training, embedded analytics is almost certainly the right call. If you're serving both audiences, you likely need both tools — and that's fine.
- What is the user trying to do? If the primary activity is data exploration — testing hypotheses, building custom reports, answering ad hoc questions — that's BI territory. If analytics supports a different primary activity — managing campaigns, tracking shipments, monitoring account health — that's embedded territory. The distinction is whether analytics is the job or a tool that helps with the job.
- Who needs to own the experience? If your data team is the right owner and they have capacity, a BI tool embedded via API might work. But if your product team needs to iterate quickly, respond to user feedback, and ship analytics on the product roadmap's timeline, an embedded analytics platform gives them that control without creating dependencies.
The most common mistake isn't choosing the wrong tool — it's choosing a BI tool because the internal team already uses it, without asking whether customers will have the same experience. Your analysts love Tableau because they've spent years learning it. Your customers will bounce because they haven't.
What this means for your product
The BI-vs-embedded debate often gets framed as a technology choice, but it's really a user experience decision. Both categories include capable technology. The question is: which technology was designed for the person who will actually use it?
For internal teams who analyze data professionally, BI tools remain the right answer — and they're getting better every year, with AI-powered natural language queries and agentic analytics making them more accessible than ever.
For customer-facing analytics inside a SaaS product, the requirements are fundamentally different: native UX, zero learning curve, multi-tenant security, fast load times, and product team ownership. These aren't features you can retrofit onto a BI tool — they're architectural decisions that need to be made from the start.
At Luzmo, that's the foundation we built on.
An embedded analytics platform purpose-built for SaaS, where product teams can ship customer-facing dashboards in days instead of months, analytics feels native to the product rather than bolted on, and users get focused, actionable insights instead of an analyst's workbench. From Luzmo IQ for natural language queries to Agent APIs that make analytics proactive rather than passive, every feature is designed around the same principle: your customers deserve analytics built for them, not repurposed from your internal team's toolkit.
The right answer for most growing SaaS companies isn't either/or. It's using BI tools where they shine — internally — and embedded analytics where it shines — inside your product. The failure mode is trying to make one tool do both jobs.
Luzmo is an embedded analytics platform purpose-built for software products. Build customer-facing dashboards in days, not months, with an API-first approach, real-time data, and AI-powered insights that feel native to your product. Start your free trial →
Written by

Ship the future of your data
Let us show you what Luzmo can do for your product.

Leave your e-mail and one of our analytics experts will reach out to you