Qlik Embedded Analytics: The Beginners' Guide

Choosing a business intelligence tool in 2026 is extremely difficult since there are so many decisions to make. The right data integration capabilities, a variety of visualizations, machine learning, and AI capabilities… These are just some of the many things to look at. And Qlik Sense is one of the most popular choices out there.
But while its analytics capabilities are known as exceptional, how does it perform in an embedded setting? Today, we talk about Qlik embedded analytics and whether or not it’s a good choice for a SaaS product or website.
A bit about Qlik Sense
Qlik Sense is a web-based data analytics platform offered by Qlik and commonly used in enterprise businesses with large data sets. Qlik Sense is known for its associative data model, which allows users to explore data dynamically. In the world of BI, it’s renowned for its real-time analytics and easy user interface, allowing various types of business users to create dashboards and explore data.
Its self-service BI analytics solution, coupled with the cloud collaboration functionality, makes it a superb choice for data analysis and visualization for companies of all sizes.
Qlik for embedded analytics: the basics
Qlik embedded analytics helps you launch intuitive dashboards in a SaaS product or a website. It promises no-code and pro-code workflows and allows your developers to embed and customize dashboards.
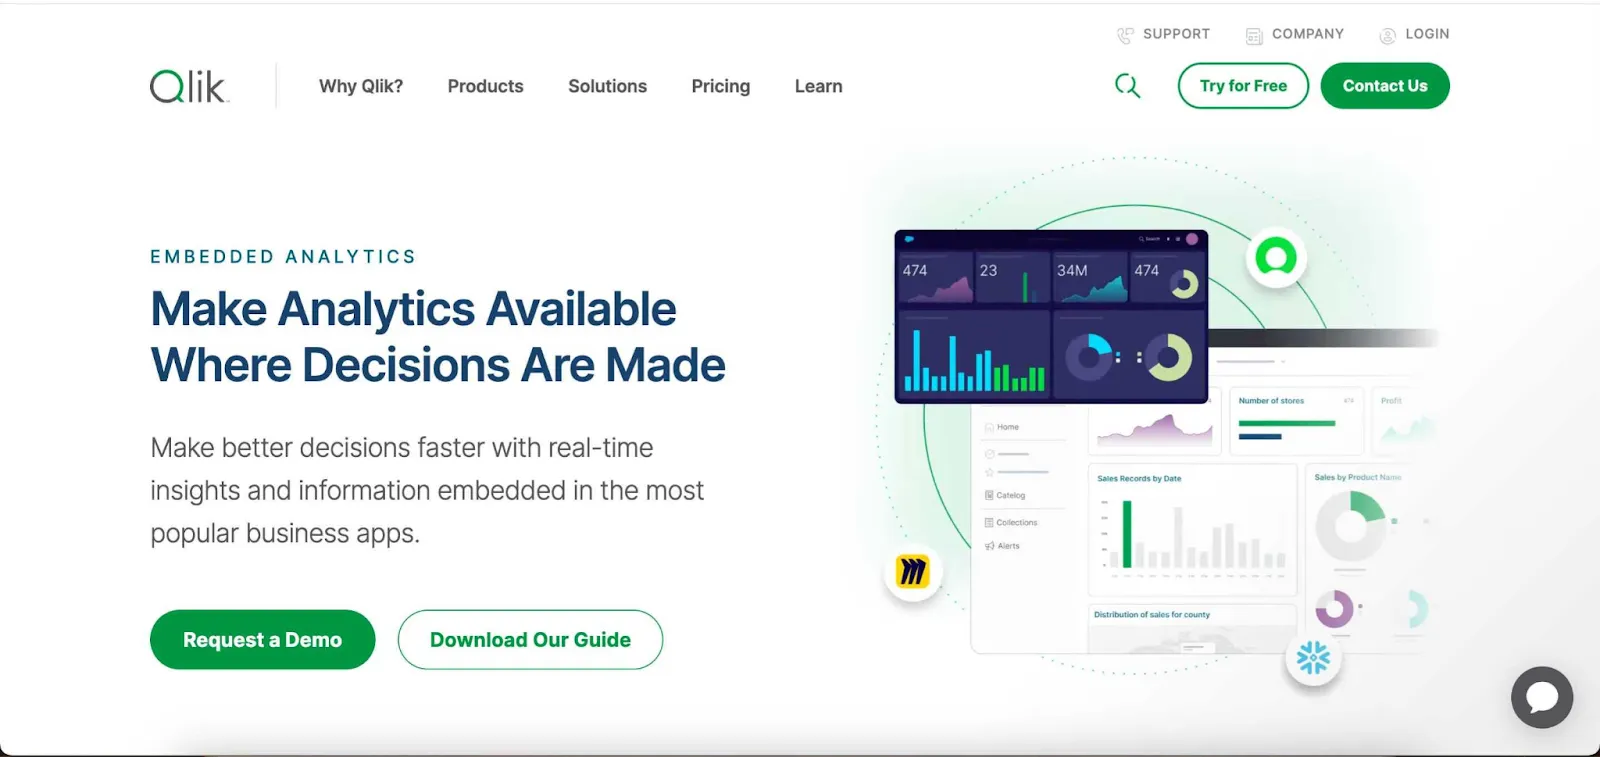
They have templates for embedded dashboards in different industries: supply chain, finance, sales, marketing, and many others.
Similar to ThoughtSpot, it offers AI-powered analytics — including Qlik's AutoML for predictive modeling and Qlik Answers for natural-language, GenAI-style Q&A — alongside its associative engine. And also similarly to ThoughtSpot, user reviews state that to get the most from the AI, you need detailed data preparation first.
In other words, the data first needs to be cleaned, modeled, and prepared for analysis. So, you need capable data scientists on board before handing off the data to a business executive for some AI exploration.
Data connectors and data sources
Connecting your data to a Qlik dashboard is a walk in the park, at least when it comes to the variety of choices. You can use Qlik’s APIs and let your developers build the integration with your app. And if you want to try some built-in integrations, there are lots of options:
- Data warehouses (Databricks, Google Bigquery, MongoDB, and many others)
- CRMs (Salesforce, SugarCRM, Microsoft Dynamics)
- Communication (MailChimp, Slack, Microsoft Teams, SurveyMonkey)
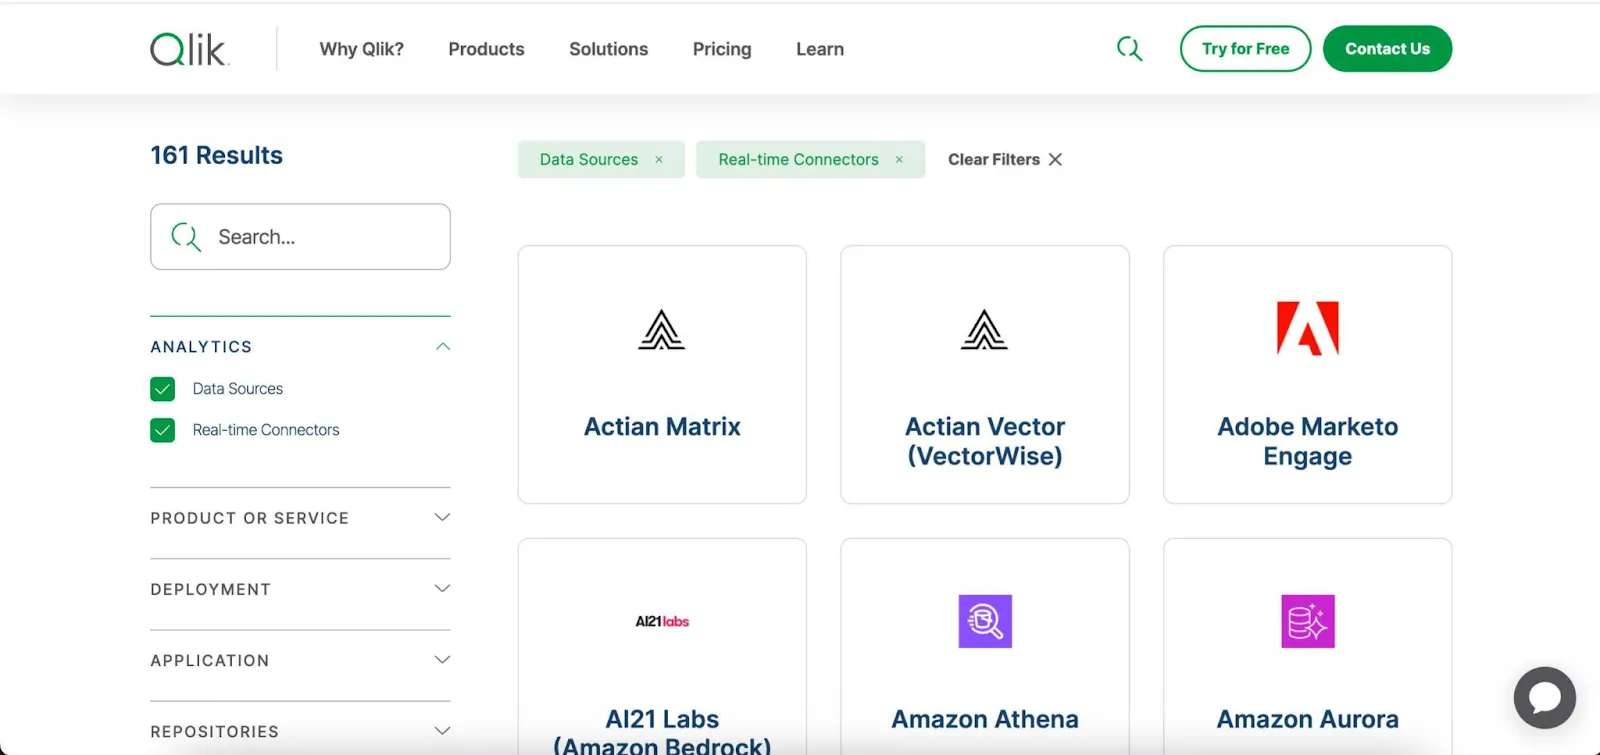
Overall, there are more than 160 different data sources you can connect to your dashboard to allow for more data-driven decisions in your team.
Setting up these data sources to connect to your dashboard requires selecting your data tables and the data you want to import, and then building your data model and joining the tables together. In other words, you’ll need someone who’s an expert in Qlik Cloud Analytics to set up the connectors and workflows.
The end-user experience
The goal of an embedded analytics dashboard is to provide real-time data to end users in various industries and use cases. For the most part, Qlik.com does that well, but users complain about the lack of customization.
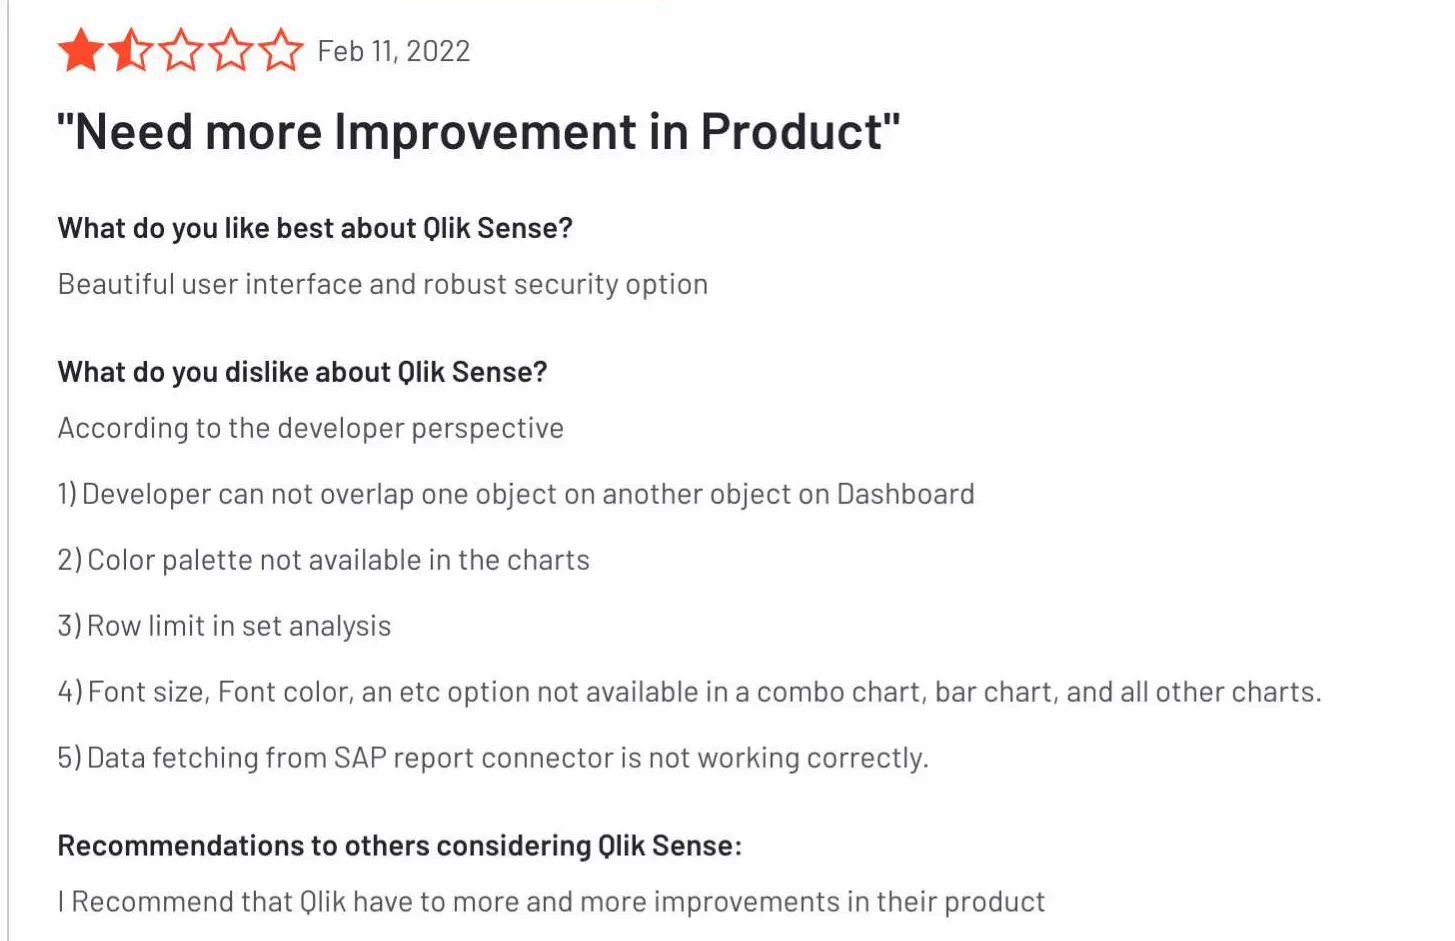
Font size, font color, sizes and shapes of charts, all of this is pretty difficult to change. This not only affects internal reporting applications - whether in the cloud or on-premise - but also your end-users who need self-service analytics.
Qlik embedded analytics pricing
The figures below are Qlik Cloud Analytics public plans (last checked June 2026). Embedded/OEM deployments are quoted separately by Qlik's sales team, so treat these as a starting reference rather than an embedded price.
According to Qlik’s pricing page, the most affordable plans start at around $20 per user per month, with a minimum of 10 users to even get started. The pricing page also states that you can get embedded analytics in this package, but it’s pretty unlikely you’ll get much value since you cannot connect to cloud databases.
The reality is that you have to opt for the Premium plan (around $2,700 per month; confirm the current figure with Qlik) to get access to integrations. This plan gets you 50GB of data annually, 10 full users (who can create dashboards and interact with them), and unlimited basic users (who can view dashboards and reports).
The problem is that for an embedded use case, 50GB can run out very quickly, especially if you have a large user base. You’re forced to go for an Enterprise plan that does not have pricing disclosed on the company website.
We searched far and wide for the exact pricing for Qlik embedded analytics, but there are no clues anywhere online. To find out the specific details for your use case, you have to get in touch with their sales team.
The better alternative to Qlik for embedded analytics
The problem with Qlik is that like Power BI and Tableau, it’s a tool primarily built for business intelligence use internally. To make use of augmented analytics, predictive analytics, and all of the best Qlik features, you’re going to need a Qlik expert on standby. Add this cost to the already high price of the enterprise plan and using Qlik for embedded analytics becomes very expensive and complex.
Luzmo can solve both of these problems at once. Thanks to our API-first approach, you can connect just about any app to your embedded dashboard. A newbie developer can set up, embed and run your dashboard within a few hours - not days or months.
Our pricing is transparent and built for SaaS scalability, starting at €495/month for Starter and €1,995/month for Premium (billed annually, scaling with monthly active users), with Enterprise plans available as you grow. You always know exactly how much you’re going to pay for your internal users, end-users, and data usage.
And the best part is that you can get started completely free. Sign up for your free trial and see how quickly you can get your embedded dashboard up and running on your website!
Written by

Ship the future of your data
Let us show you what Luzmo can do for your product.

Leave your e-mail and one of our analytics experts will reach out to you