What is ETL and How Does it Work? The Definitive Guide to ETL
It’s 2023 and the world runs on data. In order for a business to thrive, it needs to constantly pull in data from various data sources, analyze it, and use it for future decision-making. However, that seems easier said than done.
For a typical business, this means getting that from a dozen different sides, which means it will be messy, unstructured, and all over the place. This is where ETL comes in.
Today, we’re going to explain what ETL is and why it’s important for data-driven businesses.
What is ETL?
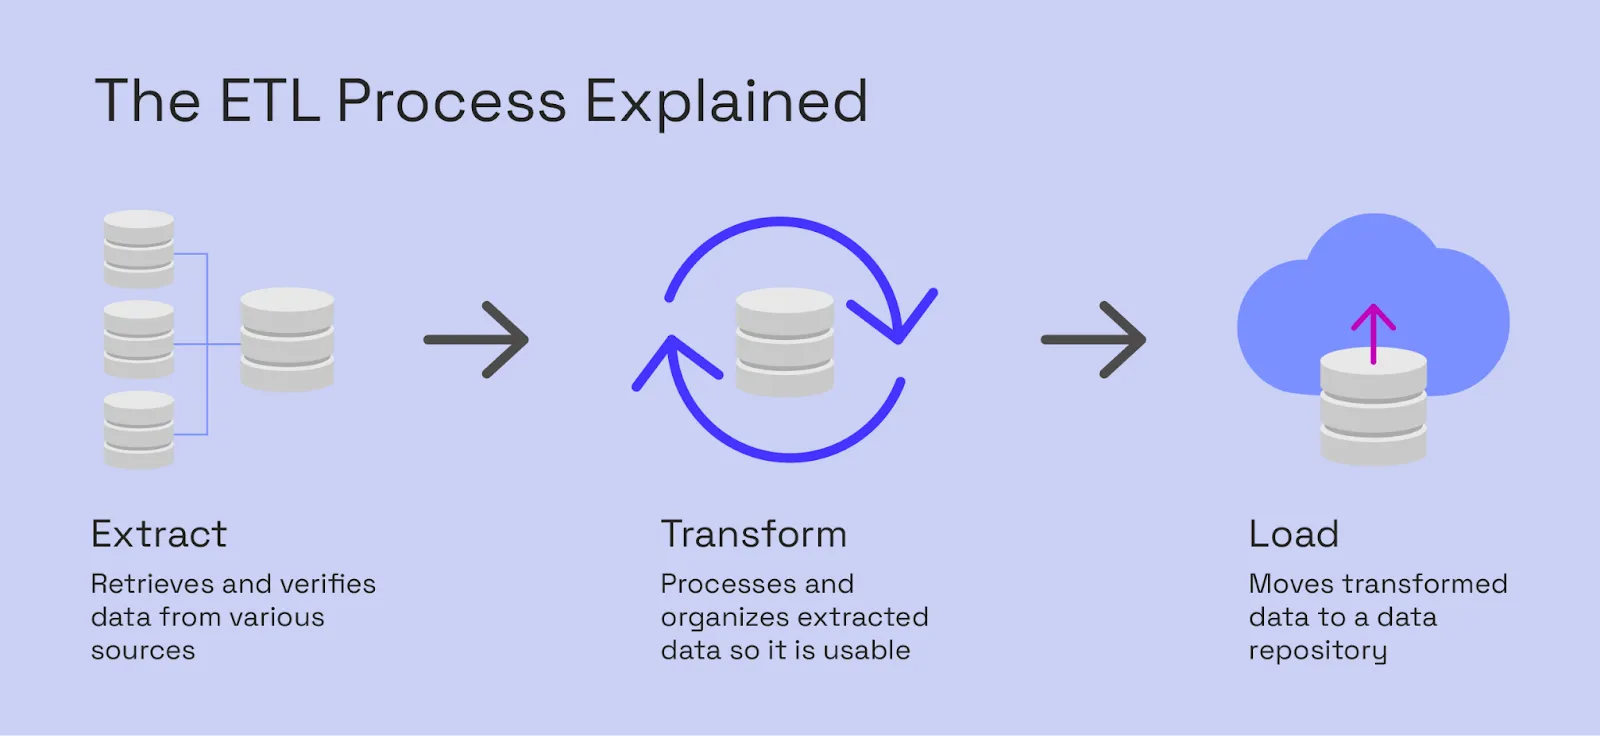
ETL stands for Extract, Transform, and Load. It is the process where data is extracted from a variety of data sources, transformed so that it is uniform, and loaded into a target database for further activities such as visualization.
ETL lets businesses grab data from a large number of data sources (think social media, CRMs, web analytics platforms, and many others) and then clean it up in such a way that it can be used further.
In its natural state, data from these sources is unstructured, contains duplicate entries, has extra fields and it’s just not suitable for any use.
For example, you want to upload the list of leads from your website, CRM, social media, Google ads and all other sources and create a dashboard to get some insights. All of this data is incompatible until it is cleaned up and put in one place.
ETL is necessary for business intelligence as it prepares the data for future use. Doing business intelligence without high quality data is like making a cake with shoddy ingredients. Sure, it may look like a cake, but it won’t be very good once you start to get into it.
PS. There are also data integration methods, such as change data capture (CDC), data virtualization, and data replication. However, they are not as widely used as ETL, the most popular data integration process.
How does the ETL process work?
As the acronym says, there are three stages in the ETL process. Let’s explain them in a way that even a child can understand the concepts behind them.
Extraction
The typical business uses a variety of tools and platforms in their everyday work. For example:
- Data analytics tools (Google Analytics)
- SQL or NoSQL servers
- CRM systems (such as Salesforce or Hubspot) and ERP solutions (see, e.g., NetSuite pricing)
- Sales and marketing apps
- And many other types of sources
If you want to do any kind of analysis or visualization with these tools, you’ll find that challenging. This is why the data needs to be extracted from the source to a staging area.
First of all, the data from all of these source systems is in different formats. Second, even if the data was all perfectly formatted, your business intelligence or data visualization platform won’t have direct data integration with all of these sources.
The data extraction can be done manually (if you have a team of data scientists and engineers on board) or you can develop your own in-house process for it. However, this requires a lot of time and money. In many cases, an ETL tool is faster, cheaper, and more effective.
Transformation
Data quality is essential for great business intelligence insights. After the extraction stage, you’ll find that the raw data is usually a mess. It comes in different formats, with different fields, missing pieces and more. Transformation means taking unstructured data and turning into clean, uniform data that can be used further for data analysis.

The transformation process entails things such as:
- Deduplication (removing duplicate entries)
- Data cleansing (proper validation and removing unnecessary data points so that the data matches the schema of the final destination)
- Sorting (according to values)
- Standardization (ensuring all data has the same fields and values)
- Verification (removing all data that does not meet certain criteria)
Transformation is arguably the most important part of the ETL process. With the source data coming from different sources and formats, this stage ensures that you get an accurate, reliable, output.
Loading
In the last stage of the ETL process, the transformed data is loaded into a new target system. Usually, this system is in data storage systems in the cloud, such as a data lake or a data warehouse, both supporting large volumes of data.
There are two types of loading: full and incremental loading, with the only difference being in the workflow. In the full data loading process scenario, you can load data all at once, while incremental entails that the data is loaded in increments, as the name suggests.
Why use an ETL tool for business intelligence?
If you’ve never used ETL before, you may feel like all of this is awfully complex. However, modern businesses heavily rely on ETL, for a variety of use cases.
- The quality of data. Once you extract data and transform it, the quality significantly improves compared to raw data directly from the source. This translates to better business intelligence and more accurate visualizations.
- The optimization of resources. With ETL, you can get accurate insights from your data sets and for example, find patterns in your data. This can help you optimize the way you spend, operate, hire and run your business.
- Improved reporting. With different types of data aggregated in one place, you’ll improve reports either for your own business or for the end-users of your SaaS app.
- Process automation. You’ll no longer require manual work in order to handle your data management and data pipeline processes. No more writing code or mapping out data from each source to a cloud data warehouse.
- More safety for your users. Thanks to modern data governance rules, ETLs allow your data to be more secure, which can earn you additional trust from your customers. Most modern ETLs are compliant with SOC2, HIPAA, GDPR, and other legislations.
- The speed. If you want scalability, ETL is the way to go, because it can easily handle millions of rows of data from various sources without a halt.
- The improved historical context. Since you can combine legacy data with new data from the cloud, you get a historical overview of your key data and metrics.
ETL vs ELT
In recent years, a new and updated process is becoming more popular, called ELT or extract, load, transform. A keen observer might say that the only difference is in the order of the letters and stages in the process. However, it’s a bit more complicated.
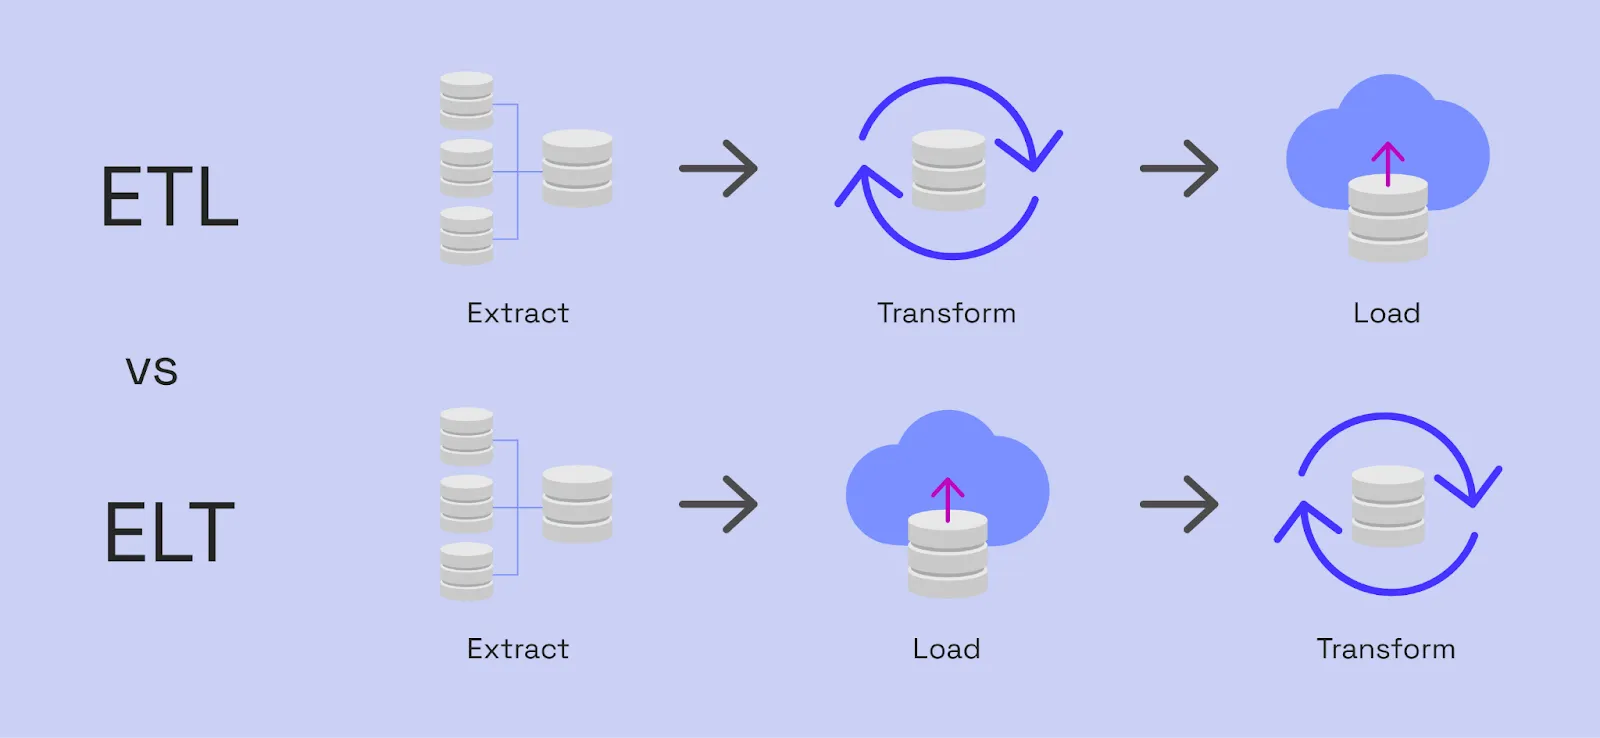
In an ELT process, all raw source data is directly loaded into the destination, which then takes care of the necessary transforming.
Extract - the data is extracted from cloud data sources
Load - the data is loaded into a cloud storage (data repository, warehouse, lake, etc.)
Transform - the data is transformed and ready for further use
The advantage of ELT processes is that your raw data is consistently accessible in the destination for further processing, which avoids having to adapt sometimes complex ETL pipelines when the transformation requirements change in the future.
Top ETL tools for business intelligence
The ETL market is booming and there are dozens of tools you can choose from. Finding the best one can be very difficult, with the wide range of features, complex pricing and difficulty of implementation.
We talk to a large number of customers who use ETL or ELT tools to prepare their data for visualization. We ask each one about their preferred ETL solution and here are some of the top contenders.
Fivetran: an automated data platform with over 300 supported data sources. You only get billed for the data you use. It features 99.9% uptime and 24/7 support, making it ideal for enterprise businesses with real-time data access needs.
Panoply: features 205+ data sources and allows data visualization too. However, many users prefer Luzmo for this part of the process, and we actually explained why in a blog post a while ago. Fair and transparent pricing. Easy way to aggregate and analyze data.
Airbyte: an excellent open source ETL tool with a large number of connectors. If there is no available connector, you can build your own by using their API. Both cloud and self-hosted, on-premise options are available.
Stitch: fast, reliable and easy to use: these are three words you can describe Stich with. This is another open source platform ideal for businesses that have little experience with data science and don’t have a team of data engineers on standby.
Why not do ETL directly in your business intelligence tool?
Our (potential) customers often ask why Luzmo doesn’t feature data modelling and data transformation processes such as ETL. After all, we deal with data visualization, so offering ETL would be a nice way to have all the tools in one place. Well, not exactly.
It is our opinion that tools such as Tableau that offer ETL and data visualization in one place make a lot of compromises. Because everything is in a single app, the ETL capabilities are often significantly weaker compared to a dedicated ETL tool. This reflects on the quality of your data, and then your visualizations suffer too.
ETL tools such as, Fivetran, Airbyte, and many others exist for a reason. They allow cleaner data, faster operation, and more accurate visualizations thanks to machine learning and data processing capabilities.
Our recommended setup is to have ETL between your operational systems and your data visualization tool. For example:
- So not: PostgreSQL / CRM data / Google Analytics data / …→ Luzmo
- But: PostgreSQL / CRM / Google Analytics data → ETL tools: Fivetran / Stitch / … → Data Warehouse → Luzmo
This allows you to put less of a strain on your operational database, which massively helps with avoiding downtimes or having queries that take ages to load.
It also gives you the freedom to choose a capable tool for data visualization that has all the bells and whistles you may need for business intelligence. You’re not forced to take any shortcuts or make compromises with bloated and overly expensive tools such as Tableau.
Wrapping up
In business intelligence, preparation is everything. A good ETL process ensures your data is clean and properly formatted and as a result, you get better BI insights and data visualizations. Choosing an ETL tool is an important choice not just for your data processes, but also for the decision-making in your entire business.
And once you’ve found your ideal ETL tool, you need to visualize that data for the best insights. We can help! With Luzmo, you can create an embedded analytics dashboard in just a few hours - and without a dedicated team of developers and engineers.
Sign up today and build your first dashboard for free!
Written by

Ship the future of your data
Let us show you what Luzmo can do for your product.

Leave your e-mail and one of our analytics experts will reach out to you