Create AI-powered dashboards with GPT3.5 and Luzmo

Language learning models like Mistral, Gemini, GPT-3 and GPT-4 are extremely valuable for many use cases. With natural language processing tools (NLP), you can easily generate, translate or summare text. And of course, you can ask it questions in your language of choice.
Language models, however, are designed to generate text. Not images, diagrams or other visual content that requires artistic composition. Like, for example, an analytics dashboard. So, how can you use language learning models (LLM) to build powerful analytics applications? Should you even consider using it at all?
The short answer is yes. Because AI models like GPT contain so much domain knowledge and context, there are smart ways to leverage this powerful technology, even for machine-to-machine communication.
In this article, we will walk you through a demo of how to create AI-powered dashboards using GPT-3.5 and Luzmo (formerly Cumul.io). You’ll also get some tips on how to adjust or build similar scripts for your specific analytics use case!
What has changed since this tutorial was written: the state of AI dashboards in 2026
This tutorial was originally written using GPT-3.5 and the Luzmo API to auto-generate dashboards from a dataset. The core approach — using a language model to identify what to visualize, then using the Luzmo SDK to build it — remains valid. What has changed significantly is the baseline expectation for what AI-powered dashboard tooling should do out of the box.
In 2023, AI-generated dashboards were genuinely novel. A script that could take a CSV and produce a working dashboard with suggested visualizations was impressive enough to share as a tutorial. In 2026, that capability is closer to a baseline feature. The differentiation has moved to what happens after the initial dashboard is generated: can end users query it in natural language? Does the system proactively surface anomalies? Can the AI explain what it is showing and why?
Luzmo's own AI capabilities have evolved considerably since this tutorial was written. Luzmo IQ provides conversational analytics for end users directly within embedded dashboards — users type a question and receive a chart in response, without any GPT integration code required from the product team. The Agent APIs introduced in early 2026 go further, enabling automated dataset discovery, formula generation, and continuous insight delivery as part of the analytics workflow.
The tutorial below remains a useful reference for teams that want to build custom AI analytics pipelines with full control over the model and the prompt logic. For teams that want AI-powered dashboards without building the integration themselves, Luzmo AI provides this as a native embedded feature that ships in days rather than requiring a custom implementation.
What is an AI dashboard?
AI dashboards are a collection of interactive widgets, such as charts and graphs, generated automatically by artificial intelligence tools. Just like any business dashboard, AI dashboards help you make better, informed decisions.
One of the biggest differences with regular dashboards, however, is the user experience. With AI dashboards, you no longer have to decide upfront which data points you want to analyze. Instead, you can simply ask AI which data is interesting to visualize, streamlining the entire data analysis process.
Compared to traditional data visualization tools like Tableau or Microsoft Power BI, AI-powered dashboard tools can provide a user-friendly alternative to data-driven decision-making.
Platforms like Luzmo Studio make it easier to build and manage these AI-powered dashboards without complex setup. Luzmo IQ can automatically surface patterns, trends, and anomalies in datasets, while Luzmo AI allows users to ask questions about their data in natural language and instantly generate charts or dashboard insights.
Why use OpenAI for AI dashboard design?
From our experience of working with +250 SaaS customers who create dashboards day in day out, we learned that one of the main challenges is to decide what to visualize on a dashboard. Which information is interesting to your business or to your product users?
There are different ways to uncover that business knowledge.
- Get inspiration from template dashboards
- Do market research with a market research tool
- Hire a domain expert
Or, you can save yourself loads of time, and use artificial intelligence. GPT can inject all the contextual information you need into your process of figuring out what to visualize, based on what it knows through language processing.
What we’re building: an “insights miner” to create AI-powered dashboards
In this article, you’ll walk through a demo that auto-generates dashboards using GPT-3 and Luzmo’s embedded analytics platform. To follow along, simply clone our GPT dashboard generation repo on GitHub.
Not a developer, but still want to benefit from AI-generated dashboards? You can also create AI-powered charts and dashboards straight from Luzmo’s no-code interface! Start a free 10-day trial here to create charts through simple prompts, or explore recommended charts for your dataset.
Moving forward with the coding tutorial, the goal of our script is to create an automated dashboard based on any dataset you already have available. OpenAI will function as an “insights miner” to tell you what’s interesting to visualize, and how to visualize it. We’ll then return its output to Luzmo’s API to automatically create AI-powered dashboards on top of it.
Why do it in code if you can also do it from the user interface? The advantage of using Luzmo’s API-first platform is that you could use any AI technology of your choice! We’re using OpenAI’s GPT-3.5, but you could just as easily replace it with GPT-4 or Gemini, simply by letting the two APIs communicate.
The demo in this article is just a simple example of the possibilities this opens up to build strong applications with AI.
Below, we’ll walk through the code in detail. Want to get started immediately? Watch this short video, and get your project up and running in just a few minutes!
Tutorial: Automate interactive data visualizations using AI
🚨 Our embedded analytics platform, formerly called Cumul.io, is now Luzmo! You can read all about our rebranding here. To avoid confusion: the GitHub repos and code snippets used in this tutorial may have references to Cumul.io. But fear not! Any code that you'll leverage in this tutorial is still fully functional. So simply follow along, and if you'd happen to run into any issues, you can reach us at support@luzmo.com.
In short, this tutorial will discuss a script that automatically generates an AI dashboard in three simple steps.
- Retrieve a new dataset
- Feed OpenAI with a prompt that asks for the 6 most interesting visualizations based on your dataset, and returns it in the format of a JSON file
- Parse the output as JSON and automatically build AI-powered dashboards in Luzmo using the dashboard builder SDK
Now that you know what the end result will be, let’s walk through the demo in more detail.
Before you can get started, you will need:
- An OpenAI account (you can create a free account and API key - you may need to purchase some credits, but you likely won’t need more than a few bucks)
- A Luzmo account (you can start a free 10-day trial)
- Our GitHub repo: GPT dashboard generation
For this demo, we’re using the Airlines Customer Satisfaction dataset from Kaggle.
1. Retrieving your datasets
Before you can start retrieving any datasets, you’ll make a connection with the OpenAI and Luzmo (Cumul.io) APIs, and connect the two of them together.
The code snippet below will do exactly that.
If you haven’t worked with Luzmo and/or OpenAI before, you’ll also need to create an API key for both platforms. For more information, check out the relevant developer docs.
Now that you’ve set up a connection, you’ll run the following snippet to retrieve your datasets. This code retrieves every new dataset in your Luzmo account since the last time you ran it. It will initialize with all your existing sets on the first run only, so only sets added while running the code will be considered.
Now, you’ve retrieved the dataset name, id, and all the columns included in each dataset. Once you start this script, it will keep listening to new datasets as you add them to your account.
You can modify this code to your liking. For example, you could edit the script and only retrieve one specific dataset.
2. Write the Open AI prompt
First, you’ll perform an API call to OpenAI in order to input a prompt into the system, just like you would type a prompt in ChatGPT.
This snippet includes a couple of parameters to shape our request, for example:
- Model: we are using the DaVinci model (GPT-3.5), but you can also use GPT-4 or the latest GPT-4o
- Temperature: how creative OpenAI can be with the prompt
- Max tokens: how long you want your prompt to be
- Prompt: the actual prompt we will be using
The code for the prompt will eventually look like this.
Now, let’s discuss the code for this prompt in more detail.
Generating a useful prompt is the biggest challenge here, since GPT-3 is a language model, and we want to generate a piece of structured data that our API can understand.
The clue here is to do two things.
- Enter the structure of your data model into the text prompt
- Ask OpenAI to generate the output in a JSON format
The technology has a fairly good understanding of what JSON looks like in terms of its text model. This improves our chances of having an output our API can work with.
If you were to enter the prompt directly into the OpenAI playground, it would look like this.
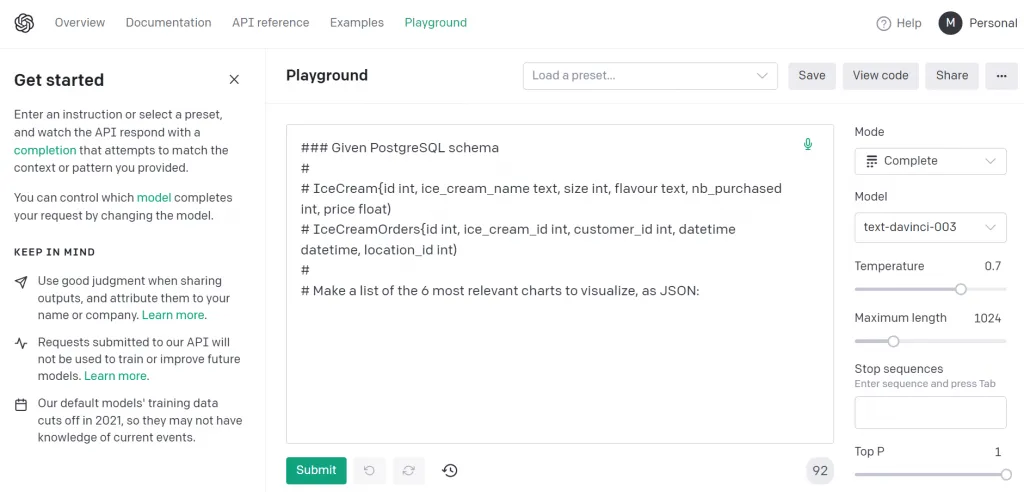
With this prompt, chances are already realistic you’ll get valid JSON in response. However, keep in mind that GPT-3 is a language model. It doesn’t know what valid JSON is, and will simply generate something similar to JSON. That means it will generate different JSON every time you run this script.
So how do we make sure OpenAI generates JSON in our desired format?
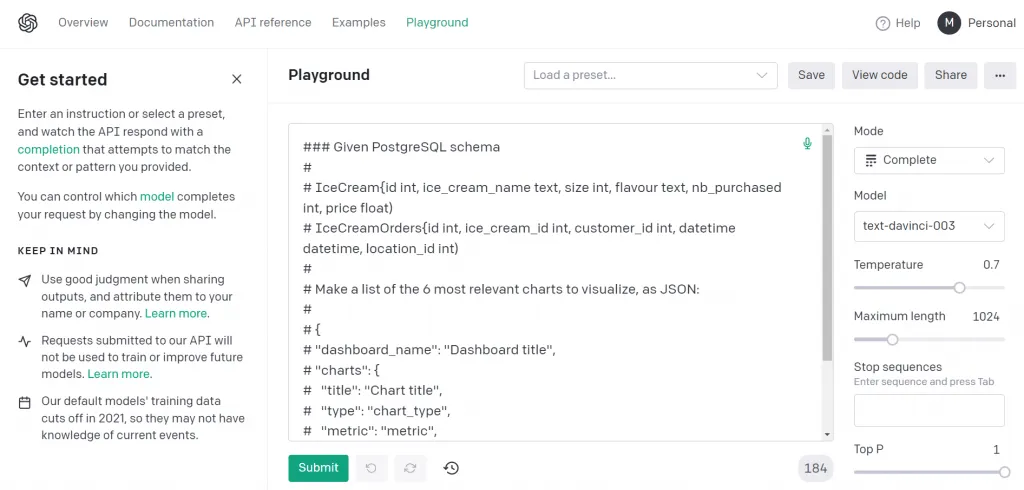
If you’ve worked with ChatGPT or OpenAI before, you know your output gets better as you refine your prompt with more context. So to solve this challenge, we will add the structure of our JSON file to the prompt.
The prompt now looks like this.
This prompt is an example of a one-shot approach vs. the zero-shot approach we tried first.
You can now send the prompt to OpenAI.
3. Create an AI dashboard in Luzmo
When the response comes back from OpenAI, you can try to parse the output as JSON.
- If the JSON is invalid, you’ll need to run the prompt again.
- If the JSON is valid, you can now create an automated dashboard on top of it.
You may need to play around with the script and run it few times before ending up with a valid JSON. Below is the code to parse the JSON.
💡Pro tip: We recommend logging your API calls. By logging all prompts and responses, you can debug more easily afterward. You can do this by adding the following snippet of code.
When you’ve parsed the JSON successfully, you can use Luzmo’s dashboard builder SDK. This SDK is useful because it builds dashboards through function calls, so you can easily generate AI-powered dashboards via code based on a JSON file.
The code snippet below will do the following actions.
- Create a new dashboard in Luzmo
- Set a name and description for your dashboard
- Set a theme to make it look nice
- Compose charts
- Find the metric and dimension in the data model
- Set the aggregation for the metric
- Generate the dashboard
💡Note: In our initial prompt, we did not include which chart types are available in Luzmo. We’ve added a function to this code that will find the best chart match, based on the type of chart OpenAI has chosen. You can also choose to suggest the available chart types in your prompt instead… and hope GPT will follow your lead!
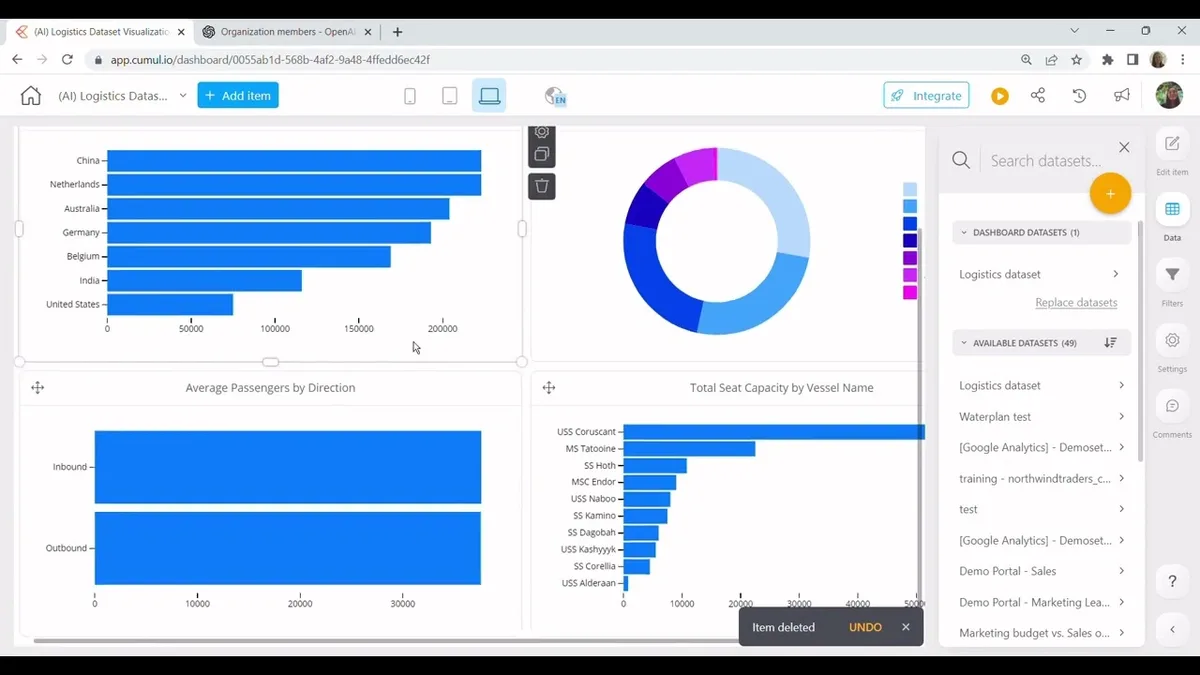
And that’s it! You’ve now successfully created an AI-powered dashboard from scratch using only a dataset, OpenAI and Luzmo. Below, we've embedded one of our resulting dashboards, but we encourage you to try it yourself!
More recommendations to expand this project
The script explained in this tutorial is simply an example of what is possible when you connect our two APIs. Once you know how it works, a wealth of options become available. Here are a few recommendations of how you could expand on the code.
Personalization
You can play around with the prompt to personalize the resulting AI-powered dashboards. For example, ask for the 6 most relevant charts for an airline support rep vs an airline executive member.
Visual variation
Tell the prompt you want to use a mix of data visualizations. You can also add a fixed template in the composition layer of your code, which defines where to place certain chart types, interactive filters etc. in your dashboard. It will make data visualization with AI even more powerful!
Model
We built this example on the Da Vinci model, but you can also use other models like GPT-4 or GPT-4o. Or, in case you are already using other AI models for your product, like Gemini Ultra or Mistral, you can streamline your workflows and hook up literally any AI API of your choice.
Embeddings
In this example, we’ve used a one-shot approach. You can also use embeddings to add a lot more contextual information, like information about dashboards you already have, or adding anonymized dashboard structures. With this input, OpenAI can work with training data to generate better, more complete dashboards.
Beyond GPT-3.5: using Luzmo's Agent APIs for production AI dashboard generation
The GPT-3.5 integration in this tutorial works by prompting an LLM to suggest visualizations, then passing the suggestions to Luzmo's API to create charts. It is a functional approach, but it has limitations that matter at production scale: prompt reliability varies, the model has no knowledge of your specific data schema, and every dashboard generation requires a round-trip to an external API.
Luzmo's Agent APIs, released in early 2026, address these limitations for teams building AI analytics into their products. Rather than prompting a generic LLM with a dataset description, the Agent APIs work with your actual Luzmo data model — they understand your column names, data types, and relationships because they are connected to your configured data layer, not inferring from a text description.
The key endpoints in the Agent API suite are: Find Relevant Datasets and Columns (natural language dataset discovery), Create AI Visualizations (generates charts from a plain English question against your actual data model), Create Formulas (adds calculated metrics on demand), and Luzmo IQ Message (drives the conversational analytics interface that end users interact with). These can be used individually for specific automation tasks or combined into a fully agentic analytics workflow.
For product teams who want to go beyond the tutorial approach and build production-grade AI analytics, the Agent APIs provide the building blocks without requiring a separate LLM integration. Documentation is available in the Luzmo developer docs, and the Luzmo AI overview covers the full AI capability stack from natural language querying to proactive insight generation.
When to use the API approach vs. Luzmo's native AI features
This tutorial demonstrates the API-first approach to AI-generated dashboards, which gives maximum control over the model, the prompt logic, and the output format. Before choosing this path, it is worth being clear about when it is the right choice and when Luzmo's native AI features are a better fit.
The API approach is the right choice when you need to integrate a specific LLM that Luzmo does not natively support, when your analytics use case requires custom prompt engineering for domain-specific terminology, when you want to automate dashboard generation as part of a broader data pipeline (for example, auto-generating dashboards when a new customer account is provisioned), or when you are building a custom analytics interface that goes beyond standard dashboard layouts.
Luzmo's native AI features — Luzmo IQ for conversational querying and the Agent APIs for automated analytics workflows — are the better starting point when you want AI-powered analytics in your product without building a custom integration. They are connected to your data model directly, handle multi-tenant data isolation automatically, and require no LLM API key management or prompt engineering on your side.
For most product teams, the practical sequence is: start with Luzmo AI's native capabilities to validate the analytics experience, then extend with custom API integrations for specific use cases that the native features do not cover. Building the custom integration first is the longer path to a working product.
More resources to get started
Want to get started using OpenAI and Luzmo? We’ve assembled a list of resources that will help you.
- GitHub repo for this project
Luzmo Documentation
OpenAI Developer documentation
FAQ
All your questions answered.
What is an AI dashboard?
An AI dashboard is a dashboard where charts, insights, or data visualizations are generated or enhanced using artificial intelligence. Instead of manually selecting metrics or building visualizations, users can rely on AI models to analyze datasets and recommend or generate relevant charts automatically.
How are AI dashboards different from traditional dashboards?
Traditional dashboards require users or analysts to decide in advance which metrics and charts to display. AI dashboards use machine learning or language models to analyze data and suggest or generate visualizations automatically, making the data exploration process faster and more intuitive.
Can AI dashboards replace data analysts?
Not entirely. AI dashboards can automate parts of data exploration and visualization, but organizations still need analysts or data engineers to prepare datasets, validate models, and ensure that insights are interpreted correctly.
Written by

Ship the future of your data
Let us show you what Luzmo can do for your product.

Leave your e-mail and one of our analytics experts will reach out to you