5 Ways to Use ChatGPT for Data Visualization (+ Best GPTs To Use)
Today, you no longer need to be a data scientist to build useful reporting dashboards. With plenty of drag-and-drop BI tools to choose from, anyone can build interactive data visualizations.
But there’s more to data visualization than simply creating beautiful charts and graphs. For example:
- Which data is useful to visualize?
- Is your data in the right format to be visualized?
- How can your data visualizations help you forecast future challenges and opportunities?
These are all difficult challenges you could run into when creating data visualizations. And users feel the pain: a Luzmo survey of 200+ SaaS leaders found that only 60% of users say dashboards help them make better decisions, while 40% rate their dashboards 3 out of 5 or lower.
With static charts falling short, it’s no surprise that new generative AI tools like ChatGPT (now powered by GPT-5) are stepping in to make these tasks faster and smarter.
Which data visualization tasks can you use ChatGPT for?
1. Suggest which data to visualize
Have you ever worked with complex datasets containing hundreds of columns - in a database or even in Excel spreadsheets? Then you’ll know the pain of deciding which data to visualize. Analyzing data relationships and correlations is difficult and time-consuming. With so many options, it can be overwhelming to decide which combinations of data make sense after data analysis.
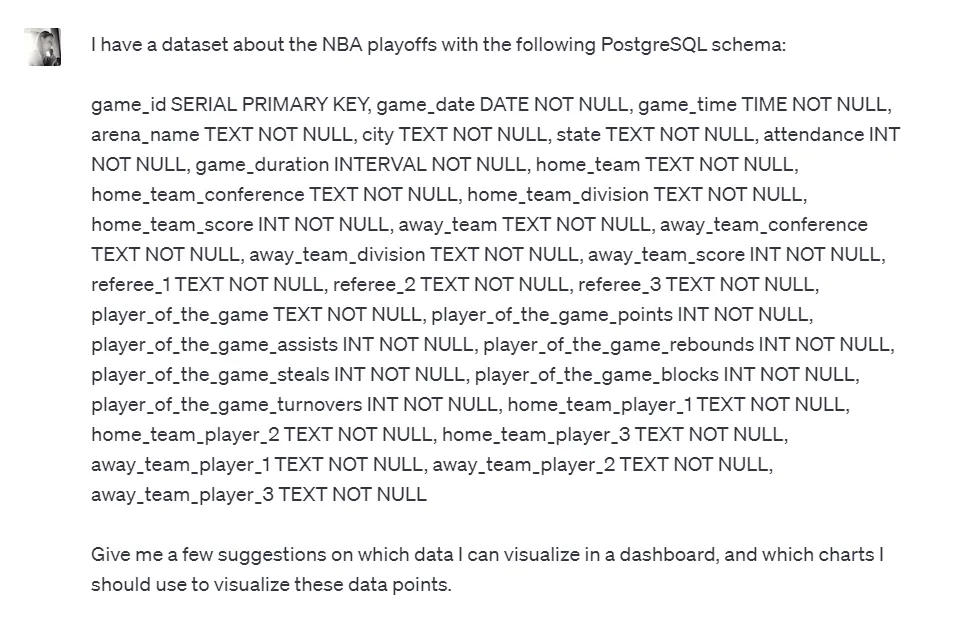
With the help of language learning models and machine learning, organizations save countless hours in the process. For example, let’s say we have a dataset about the NBA playoffs. We can ask ChatGPT to make some suggestions.
- Which data to visualize
- Which chart types to use for our data visualizations (e.g. bar chart, graph, pie chart, scatter plots and others)
Below is an example of a prompt you could use. Simply tell ChatGPT what your dataset looks like, and ask for some suggestions. You don’t need any coding skills or advanced knowledge of HTML to get this done.
Here’s an example of the output you could receive from this powerful tool, in real-time.
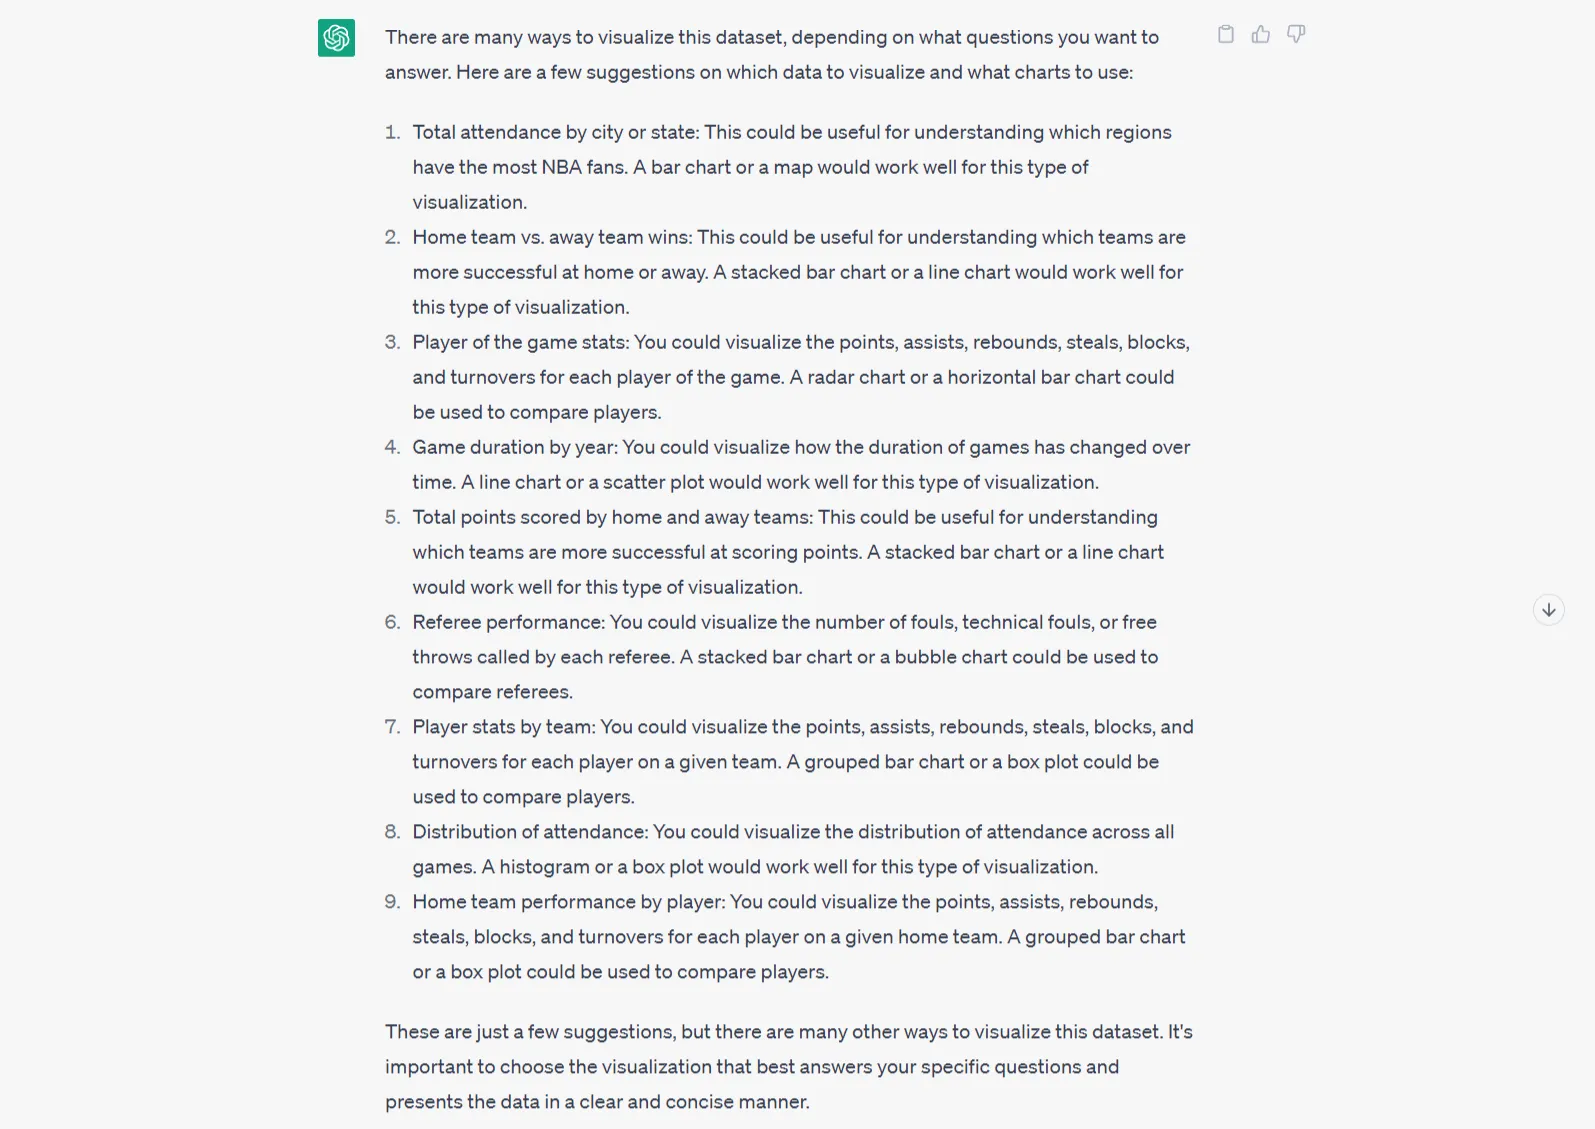
Even if the output isn’t perfect yet, it’s a great way to move past the blank page. It’ll get you going, and you can refine along the way.
P.S.: If you’re a developer and want to fully automate this process, you can hook up OpenAI to your BI tool of choice and create data visualizations immediately with AI. This AI-powered dashboard tutorial is a great example you can spin up quickly!
2. Create charts using natural language
GPT-4 is being used as a basis for many chatbots and other generative AI applications. But what about generative BI? Wouldn’t it be great if you could just ask your BI tool a question in plain English, and get a chart in return?
If you ask ChatGPT directly, you’ll get a snippet of Python code or a SQL query in return, so you can build the visualization yourself. However, there’s an easier way.
At Luzmo, we’ve integrated GPT’s language model into our embedded analytics platform to fully automate this process. With the AI chart generator, you can create charts using nothing but words. Connect your database, ask a question and with the help of OpenAI’s natural language processing and Luzmo, you can generate interactive charts in minutes.
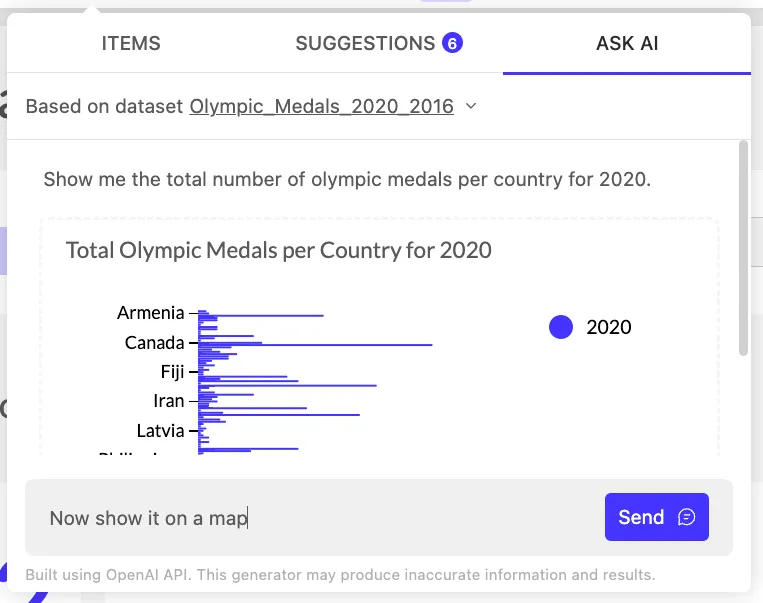
Luzmo acts as a code interpreter and turns your instructions into commands. As an output, you get an interactive chart and immediate data insights. The best part is that you can start using it right away on a free 10-day trial!
P.S.: If you prefer drawing over typing, check out Instachart. This crafty data viz tool turns any dashboard sketch, screenshot or Figma mockup into a functioning dashboard using GPT-4-vision. Ideal for implementing a proof of concept! As you start accumulating a high volume of these design mockups and screenshots, familiarizing yourself with the practical digital asset management definition can help you understand how to properly organize and store these visual files.
👉 One of the main frustrations with traditional BI dashboards is lack of interactivity. In fact, 51% of users say they can’t interact meaningfully with their dashboards, leaving insights buried under fixed charts. That’s why natural language charting with GPTs and tools like Luzmo is such a game changer. It gives users freedom to query data in their own words and explore results instantly.
3. Enrich your data for smarter data visualizations
Besides using ChatGPT for the actual data visualization, you can also use it to enrich your data. If your data sources contain limited information, you may want to add more data to generate smarter, richer insights. Below are just a few examples of columns you may want to add to your dataset.
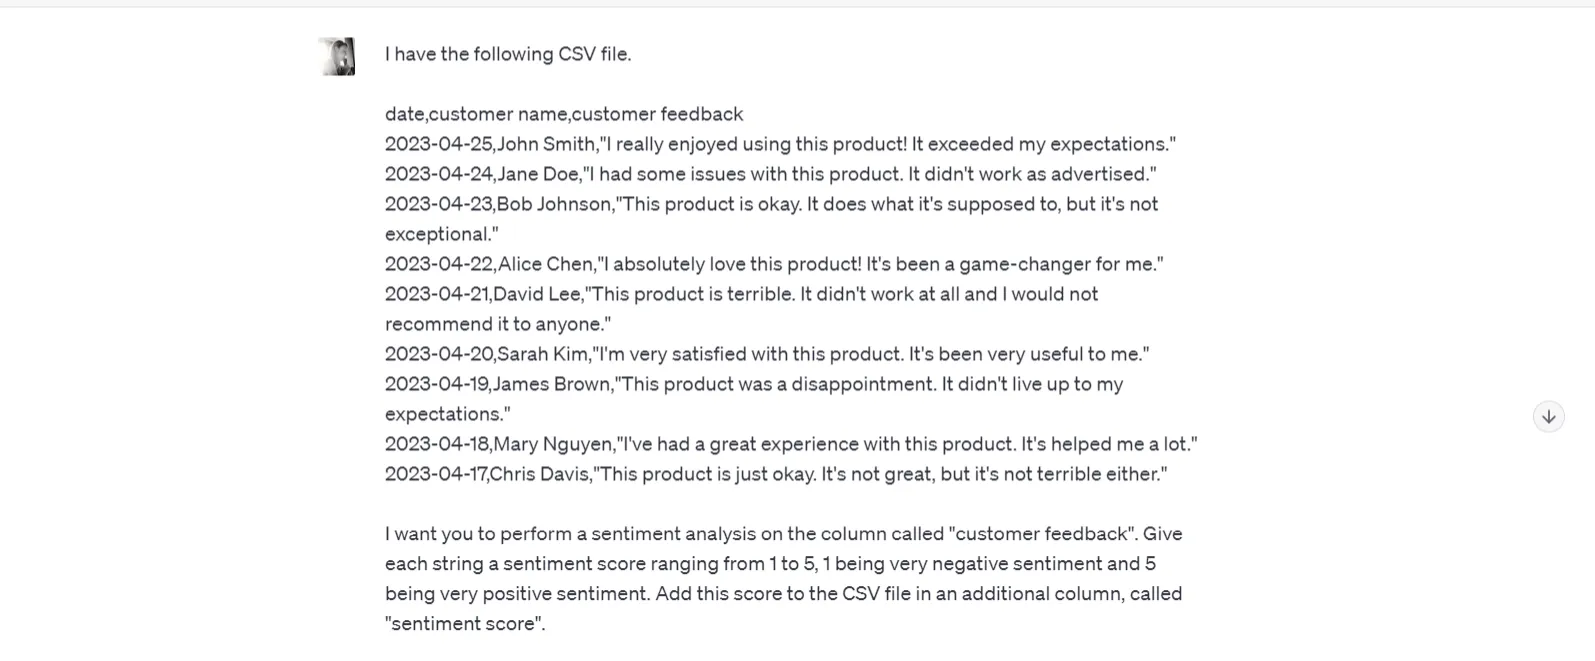
- Sentiment analysis of text strings, like customer feedback or online reviews
- Coordinates of a location or city in your dataset
- Demographic information (if publicly available)
- Latest conversion rates between foreign currencies
- Aggregate calculations
- …
ChatGPT can help data science teams uncover useful scripts to add these enrichments to your dataset. For example, the prompt below asks ChatGPT to rate the sentiment of customer feedback.
The result is a Python code sample with instructions to get started. With this output, any developer can apply this process at scale to analyze millions of feedback snippets.
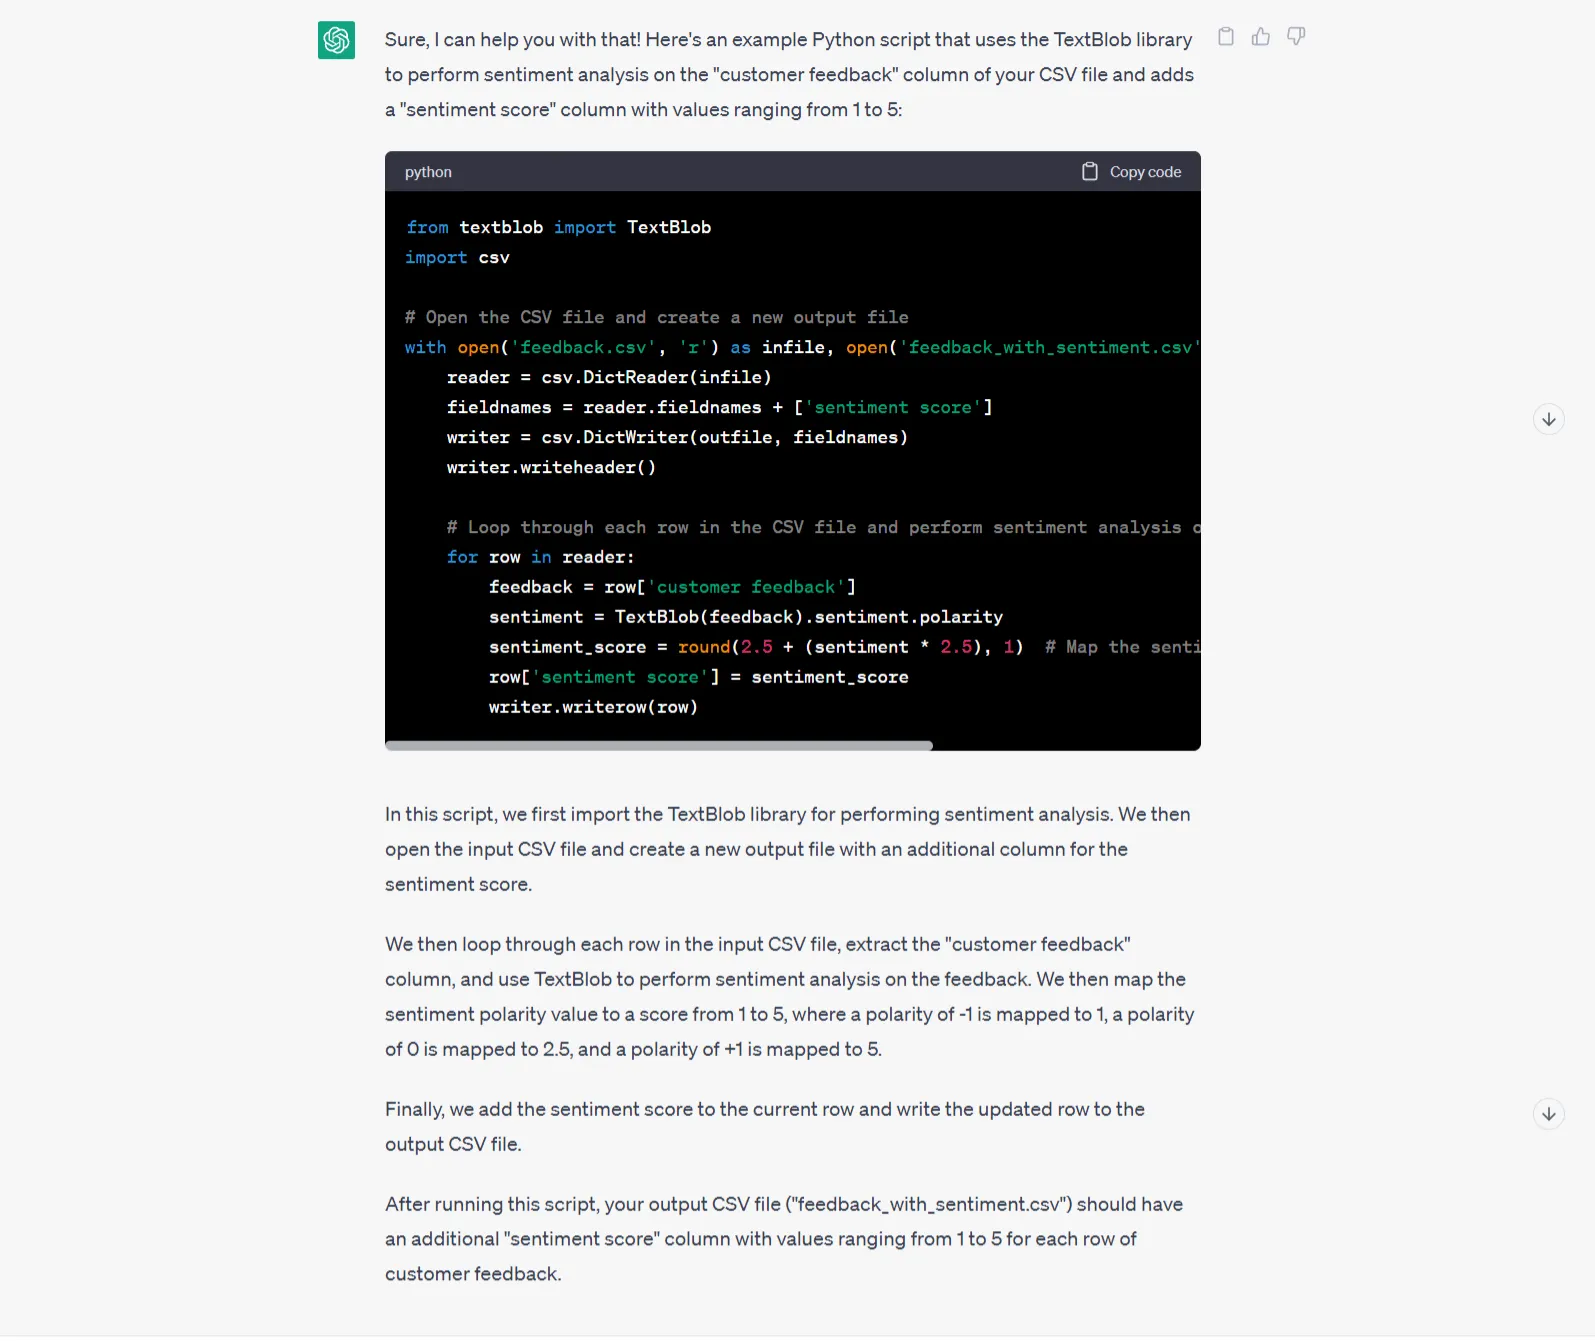
Developers and data scientists can save hours of browsing Stackoverflow by using ChatGPT. And even non-technical staff can benefit! As a marketer who had never worked with Python before, I was able to generate a set of coordinates for a mock-up dataset in Python in less than 15 minutes. ChatGPT walked me through every step!
4. Using AI for predictive data analytics
Visualizing historical data is crucial to learn from your past efforts. But if you only act on past learnings, you may risk running behind your competitors. Instead, what if you could predict risks and opportunities before they happen, and guide your decision-making with solid evidence?
More and more organizations are starting to leverage predictive analytics to make better decisions based on forecasts. However, predictive analytics is a specialized field requiring deep expertise.
But with language learning models like GPT-4, the jump to start experimenting with predictive analytics has become smaller for developers. You can train GPT on your historical data, and start building AI-assisted data visualizations.
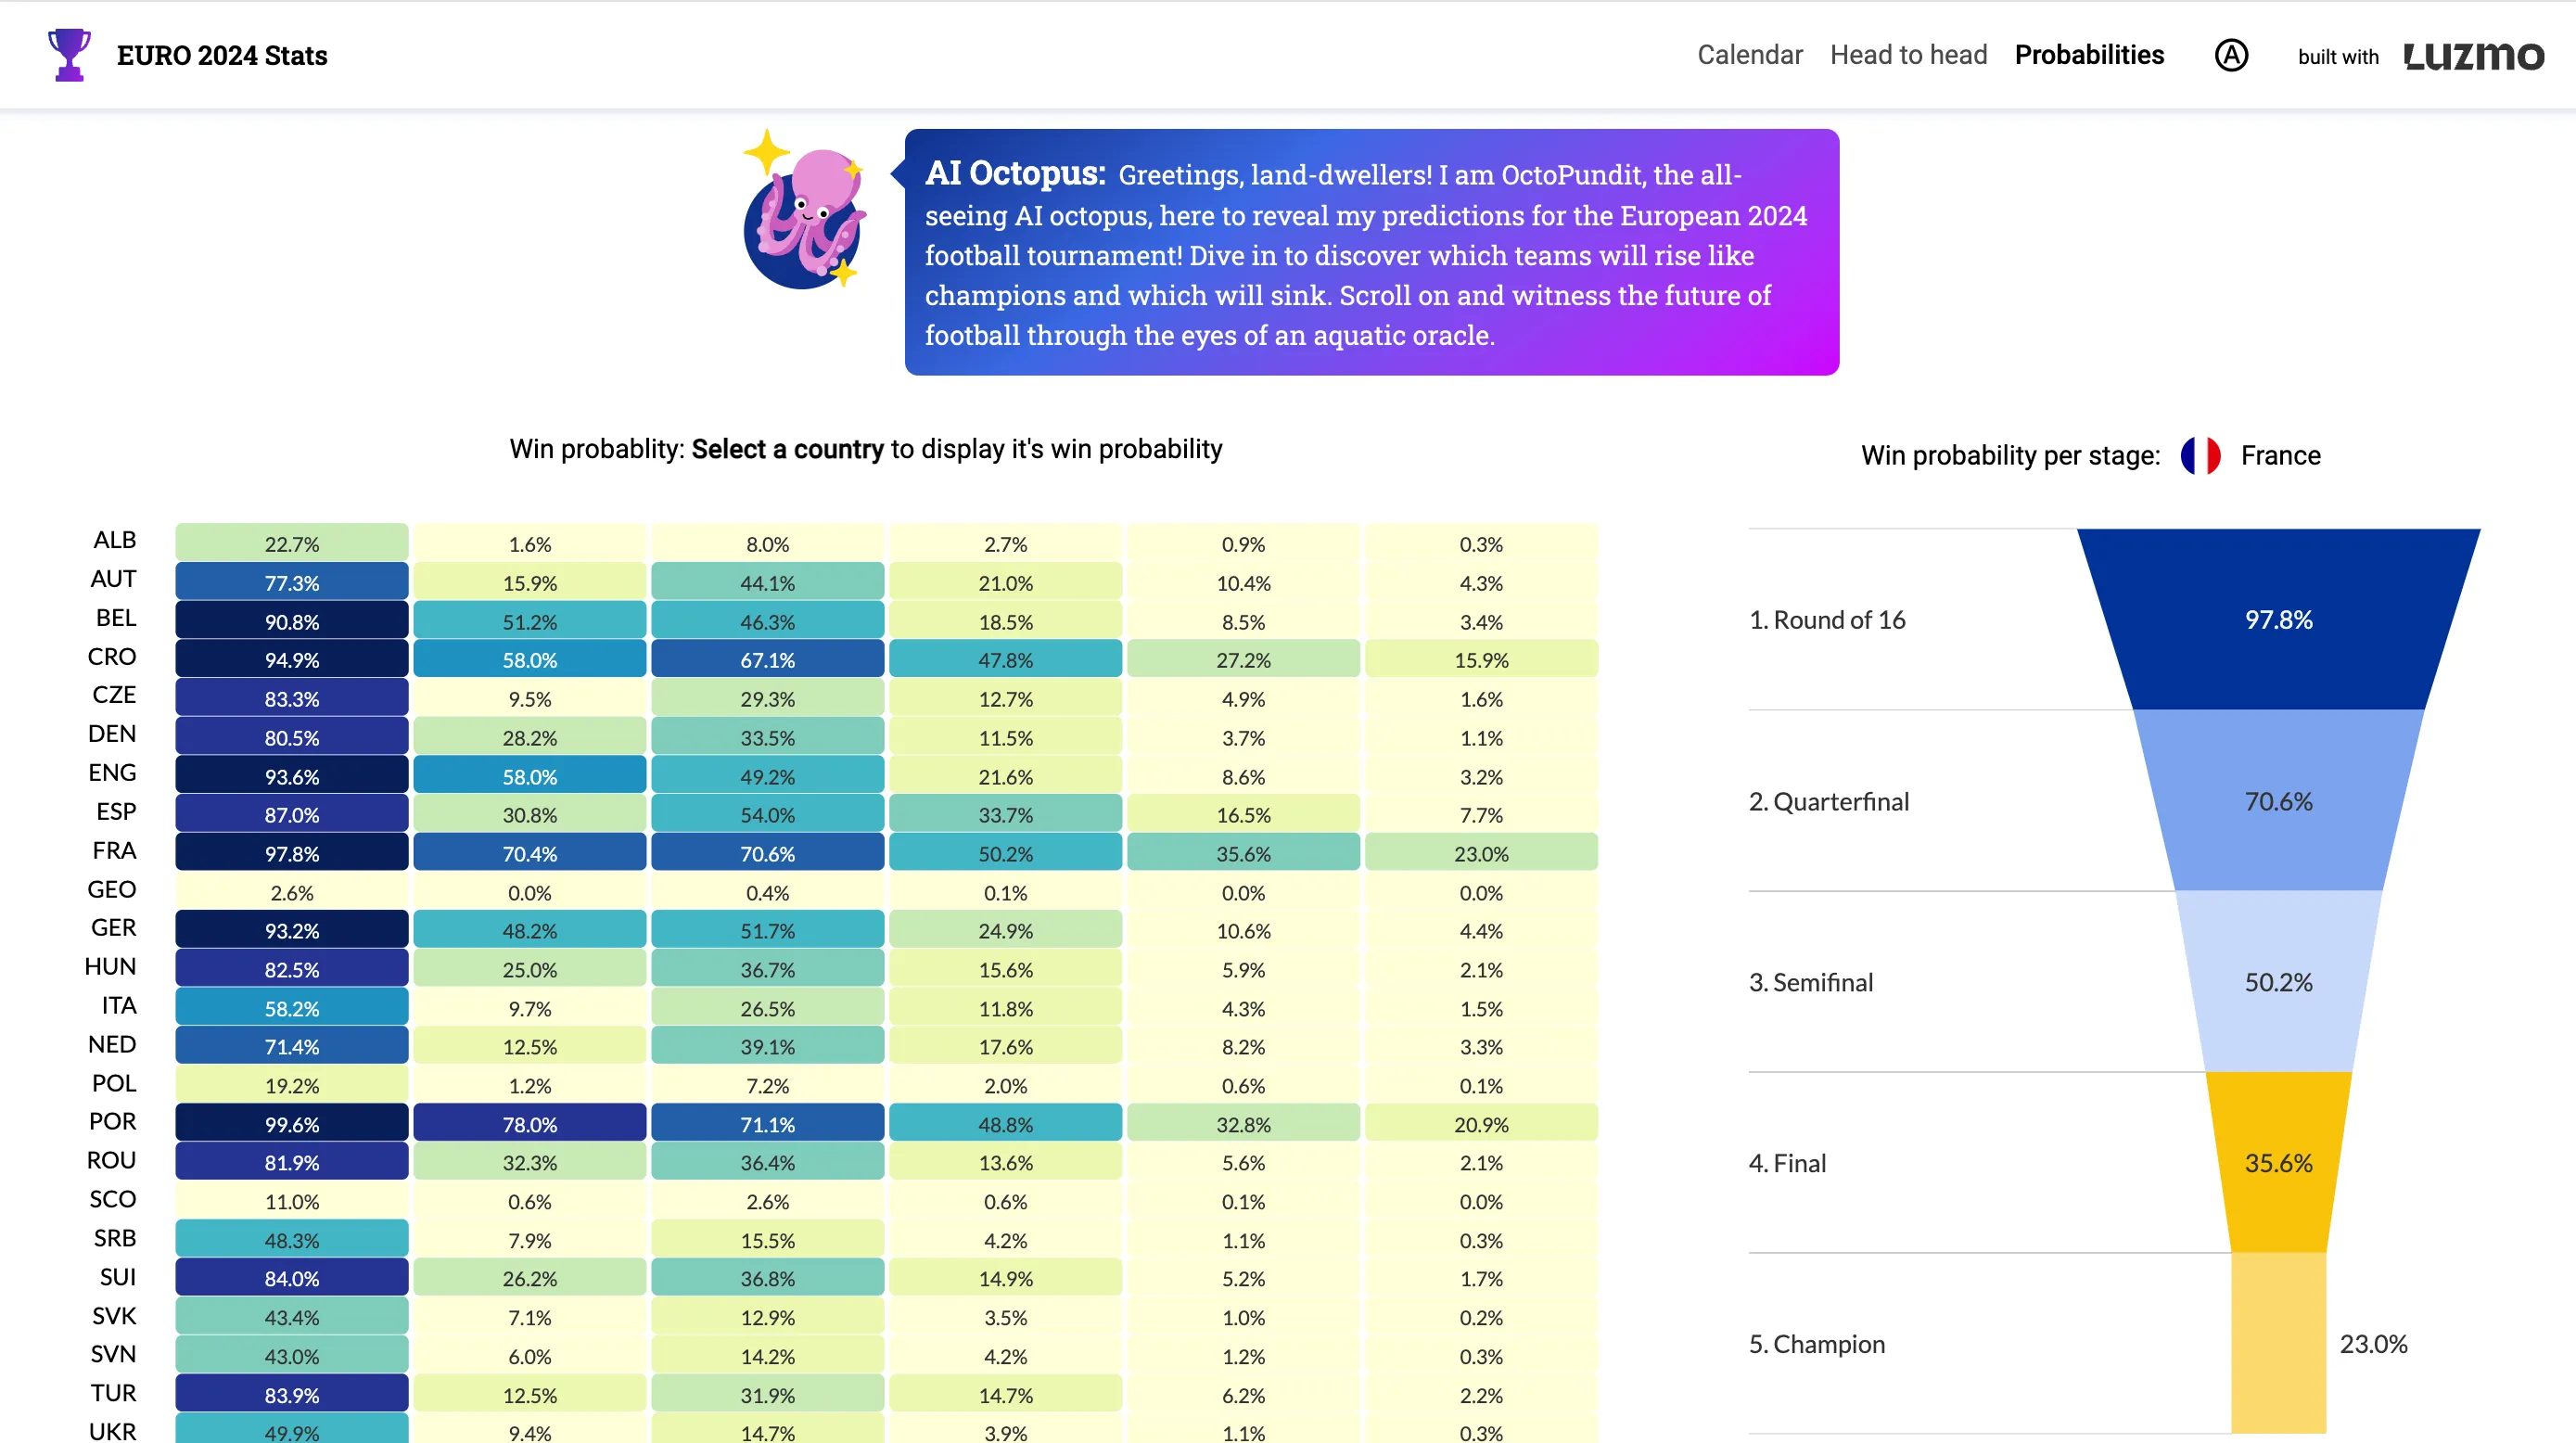
For example, at Luzmo, we recently built an AI pundit that predicts the winning odds and scores of all upcoming soccer games in the European Championship. We visualized the predicted winning odds in Luzmo, and the entire process took us just a few days.
👉 AI isn’t just hype either. Data shows that 78% of SaaS teams say AI has already transformed their work for the better, and . Predictive analytics powered by GPT-5 fits right into this trend, turning historical data into proactive insights you can actually act on.
5. Data cleaning and data modeling with ChatGPT
Garbage in = garbage out. Nothing is more true for data visualization. If your data is unstructured and your data model isn’t optimized, building meaningful data visualizations will be tricky. Although data cleaning and modeling is less exciting than creating pretty charts, it’s an essential step you can’t overlook.
Luckily, ChatGPT can help with the tedious process of data cleaning and processing, and spot anything that could be wrong with your dataset, such as:
- Identifying outliers in your dataset
- Handling missing information and empty values
- Normalizing your data
- Selecting the right data model for your data
- …
If you want to see some real-life examples of data transformation in ChatGPT, check out our recent webinar for a quick tutorial.
4 custom GPTs to use for data visualization
Although ChatGPT wasn’t built for the purpose of AI data analysis, they recently introduced Custom GPTs that will allow you to analyze and visualize your data directly inside ChatGPT.
To give you a better idea, we’ve included a couple of our favorite custom GPTs for data visualization below!
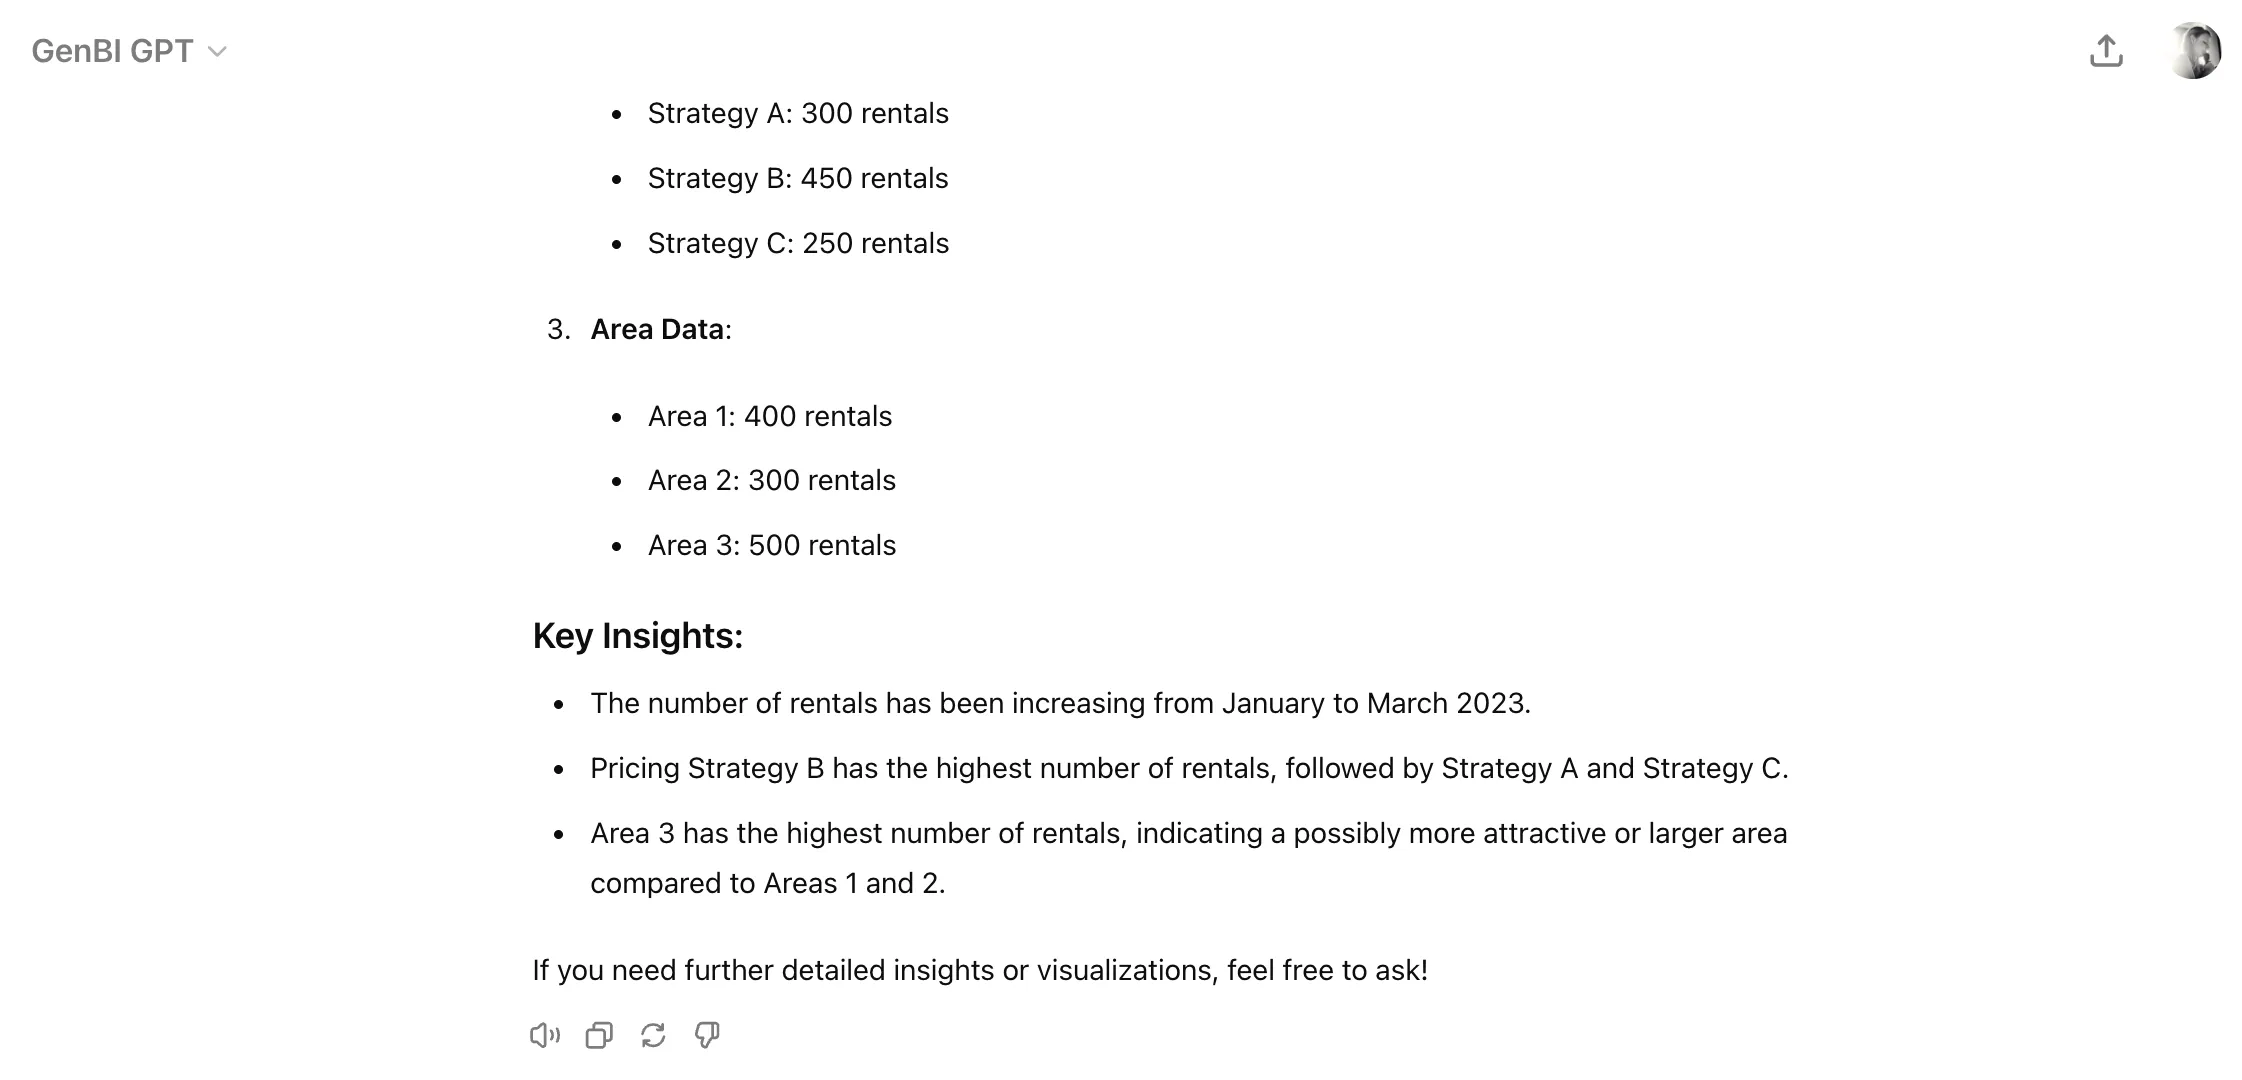
GenBI GPT by Luzmo
Of course, we can’t miss our own GPT on this list. Luzmo’s Generative BI GPT lets you do a variety of data visualization tasks directly inside ChatGPT:
- create interactive dashboards or charts
- analyze data through natural language
- query specific metrics
And you can use different types of input:
- upload a sketch of a dashboard
- upload a PDF with data
- hook up your Luzmo account and query your datasets directly
It’s great for data analysts, or any beginner really. Describe your analytical questions through a chat conversation, and get answers from your data in plain English. The biggest advantage is that you can query live datasets, from any database or data warehouse you’re using. Just hook it up to Luzmo and let the fun begin!
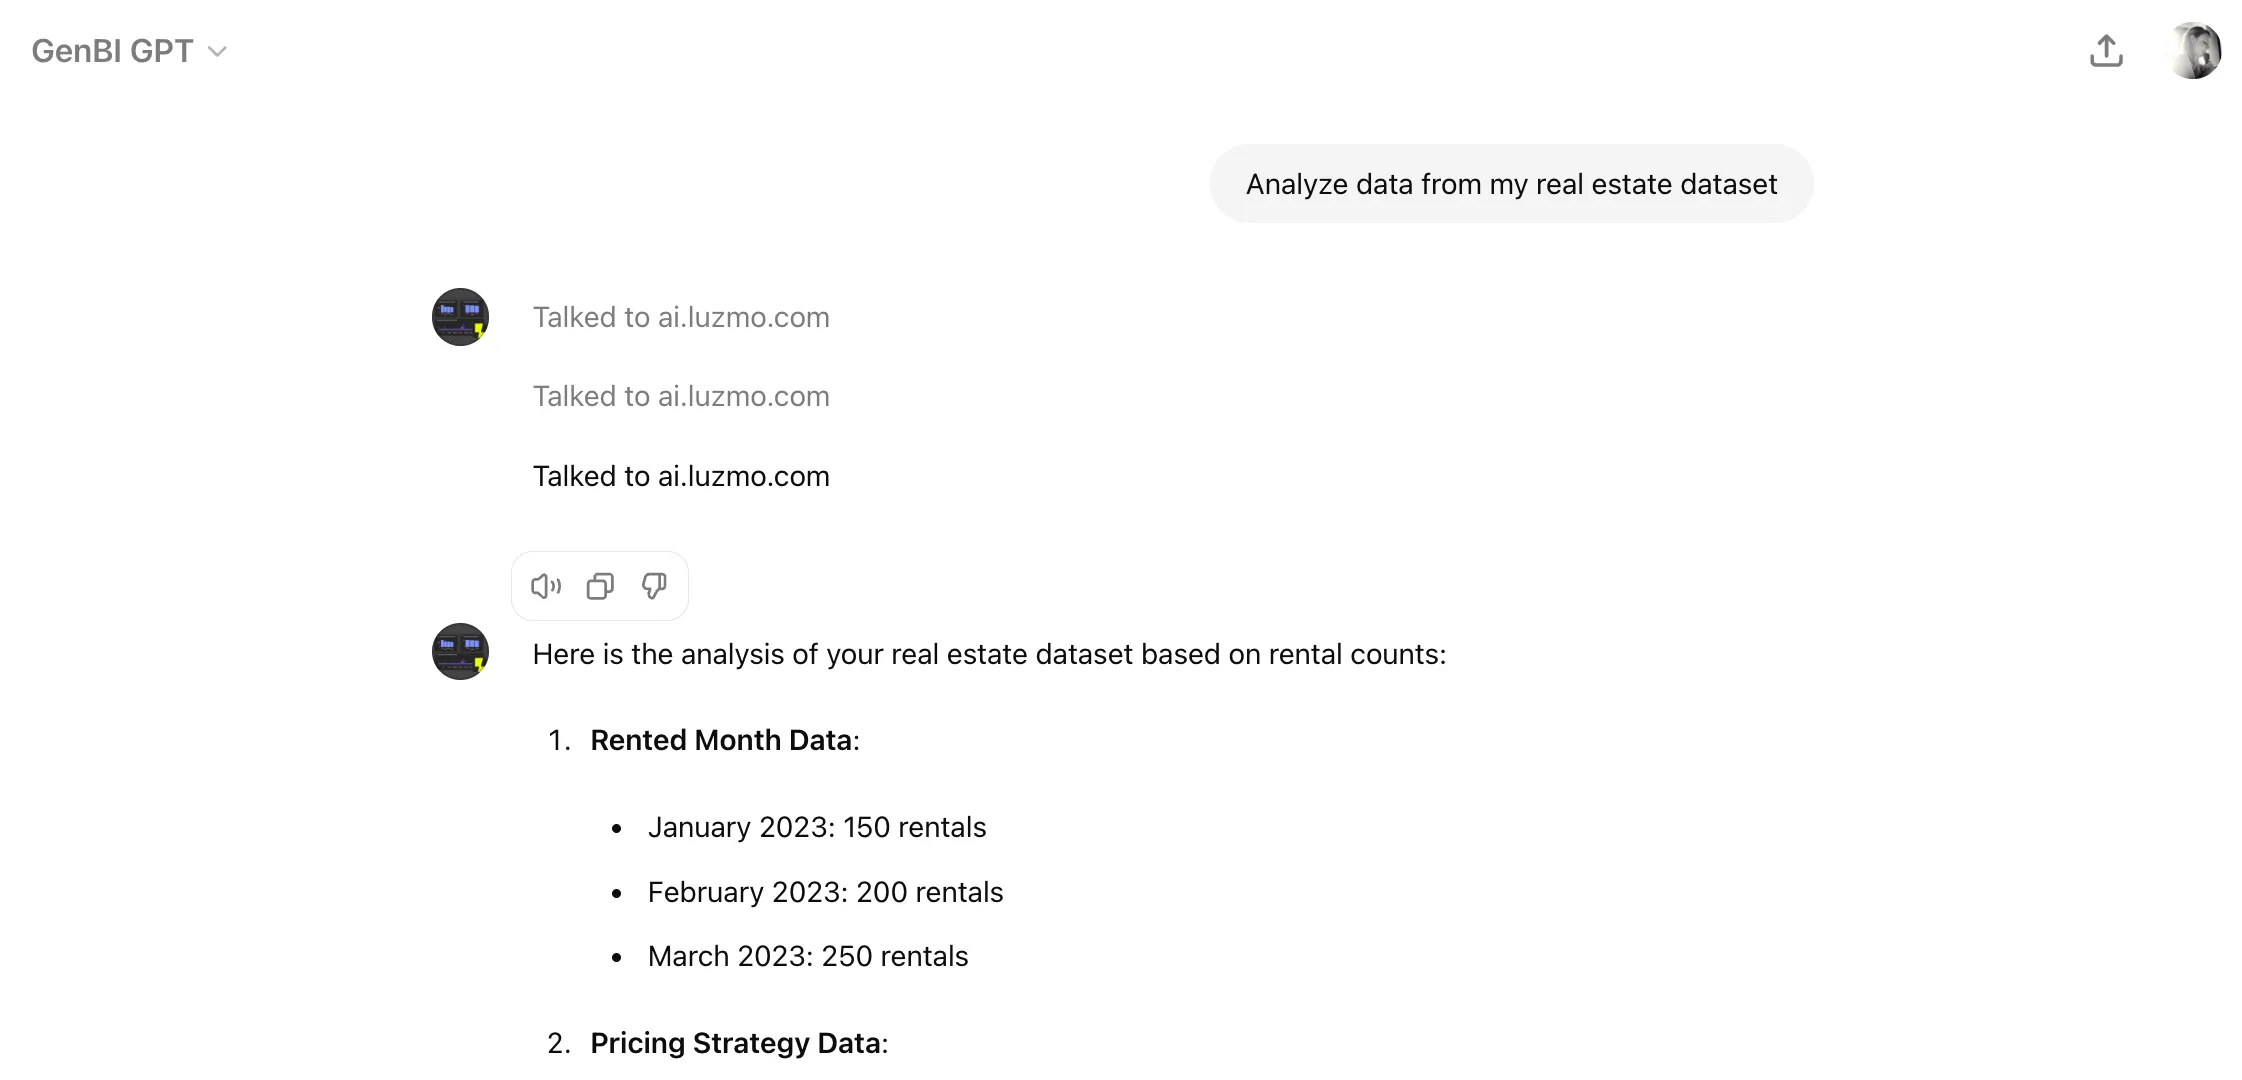
For example, when we tried it out on a real estate dataset in our account, it gave us a nice overview with a summary of the key insights.
Excel Formula AI Generator
We would choose a beautiful line chart or bubble chart over Excel anytime. But sometimes, there’s just no way around Excel when visualizing your data.
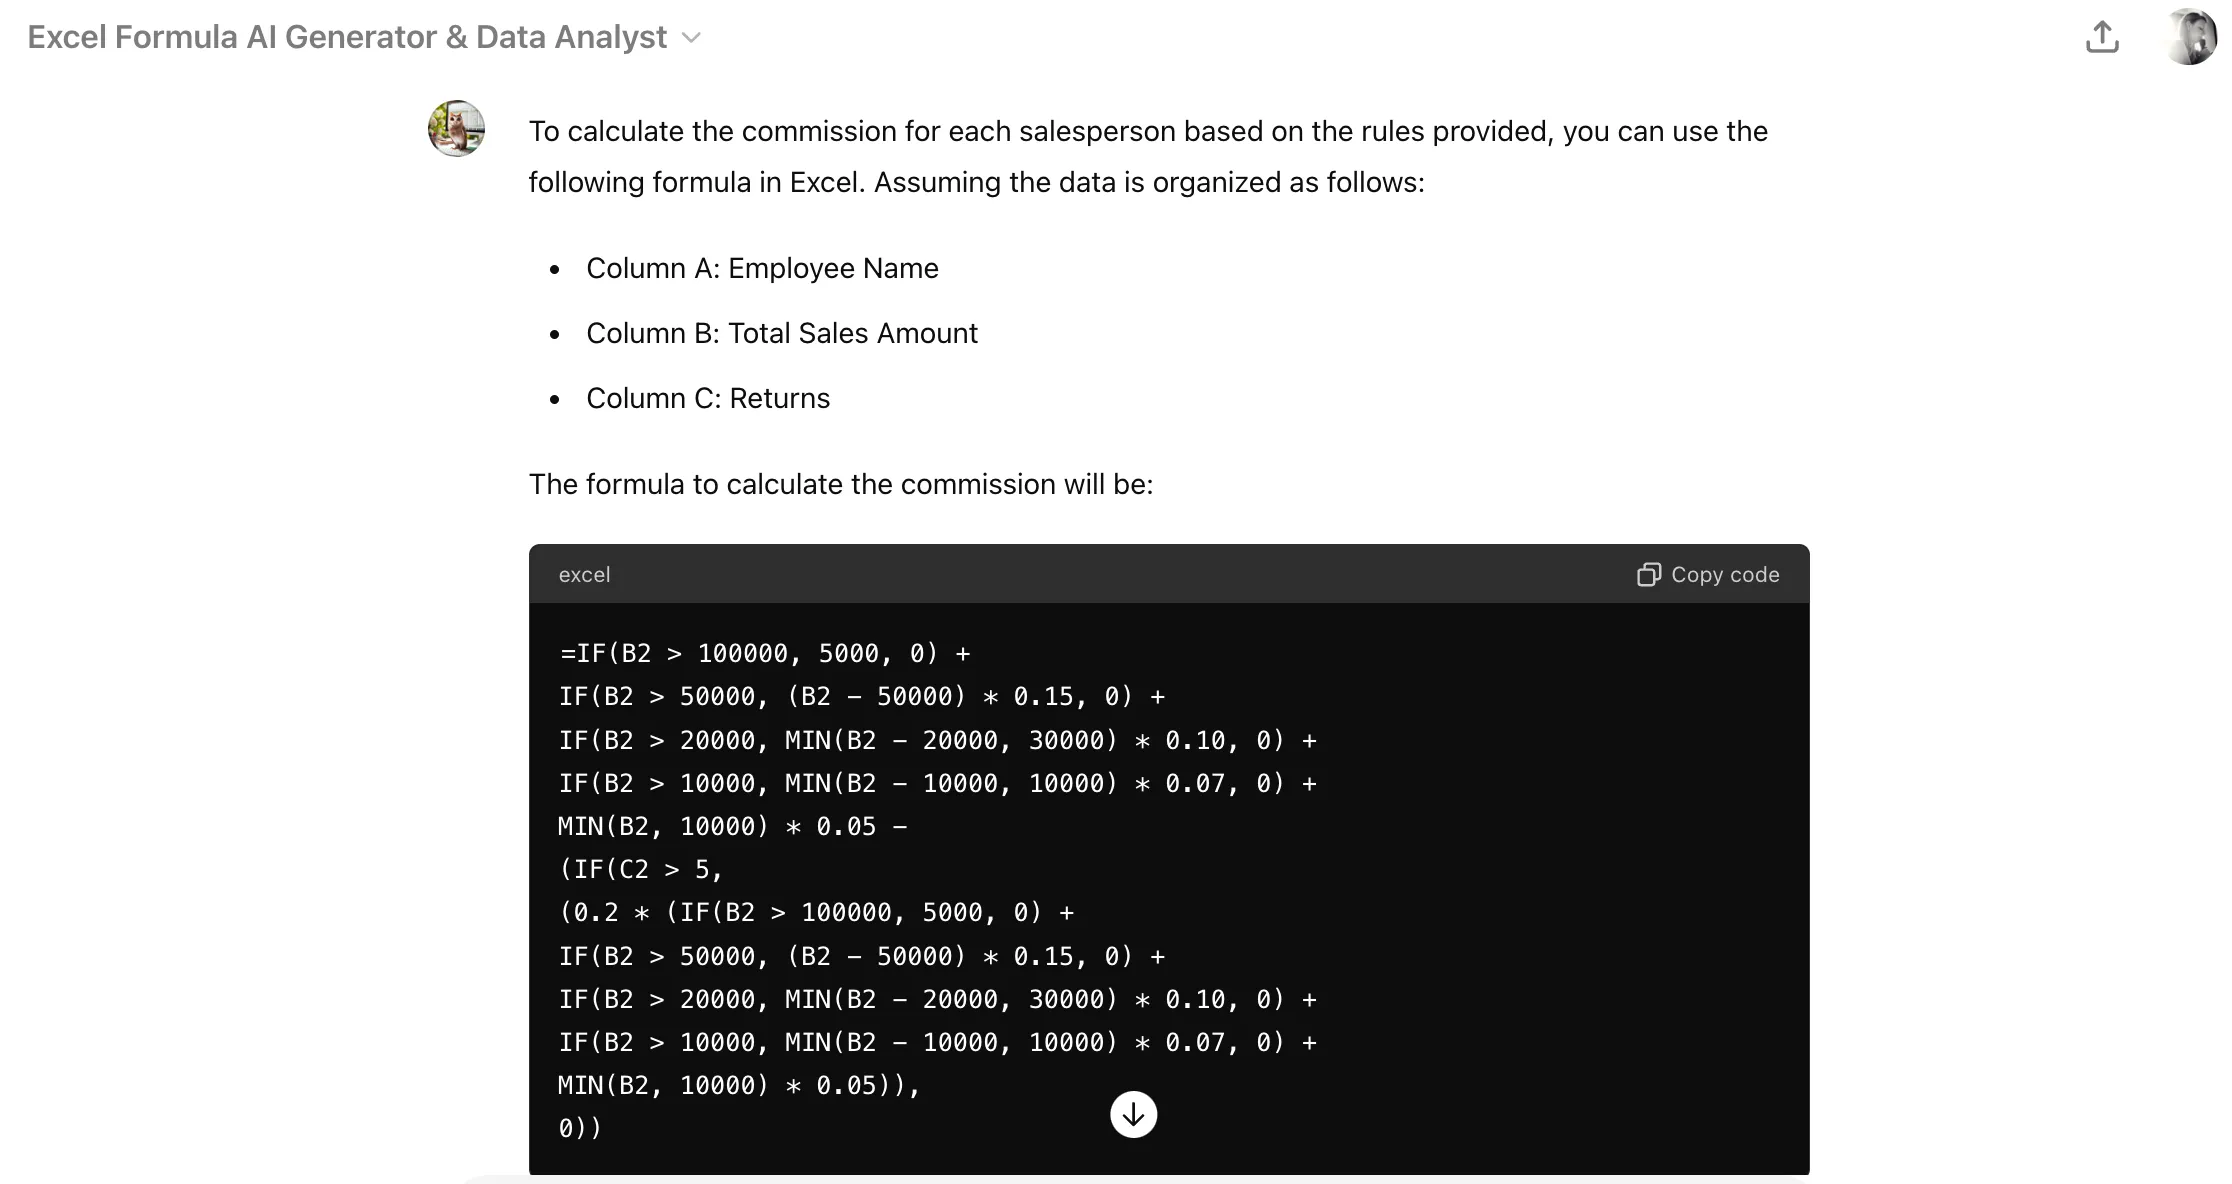
This Excel Formula AI Generator GPT is great for simple data preparation tasks. You can describe any data transformation task, and it will generate a custom formula for you.
We tried out a pretty complex prompt, asking to calculate the commission for each salesperson based on a number of requirements. In just a few seconds, we got the following complex formula as a result.
Data visualization Expert
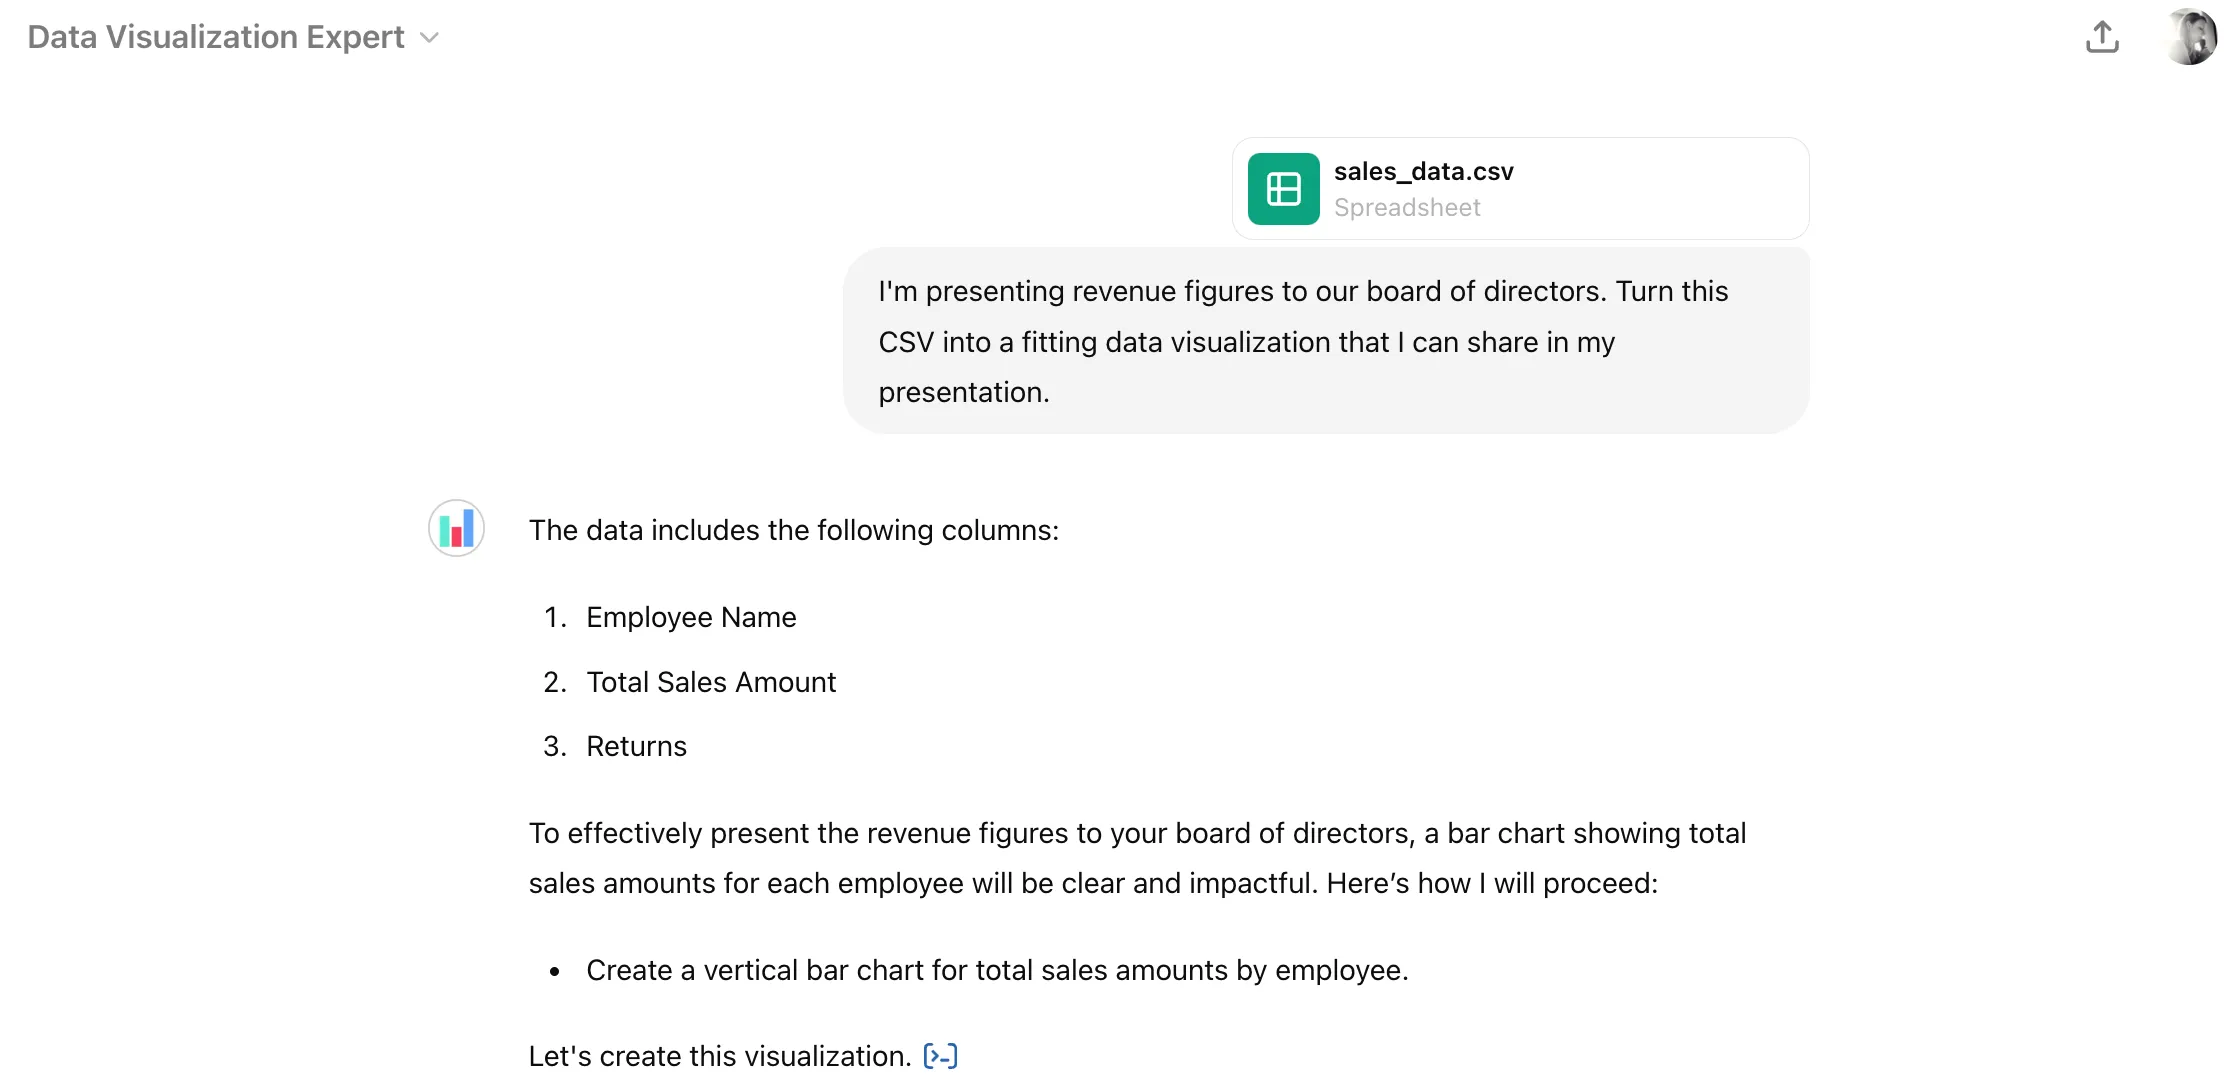
If you want to generate charts in PNG or SVG, the Data Visualization Expert GPT is for you. Upload a CSV with your data, and it will visualize your data for you.
The cool thing about this GPT is that it will help you figure out the best visualization for your specific dataset. If you add more information about your audience, it will also take this into account when generating a chart. Here's a prompt that we tried out.
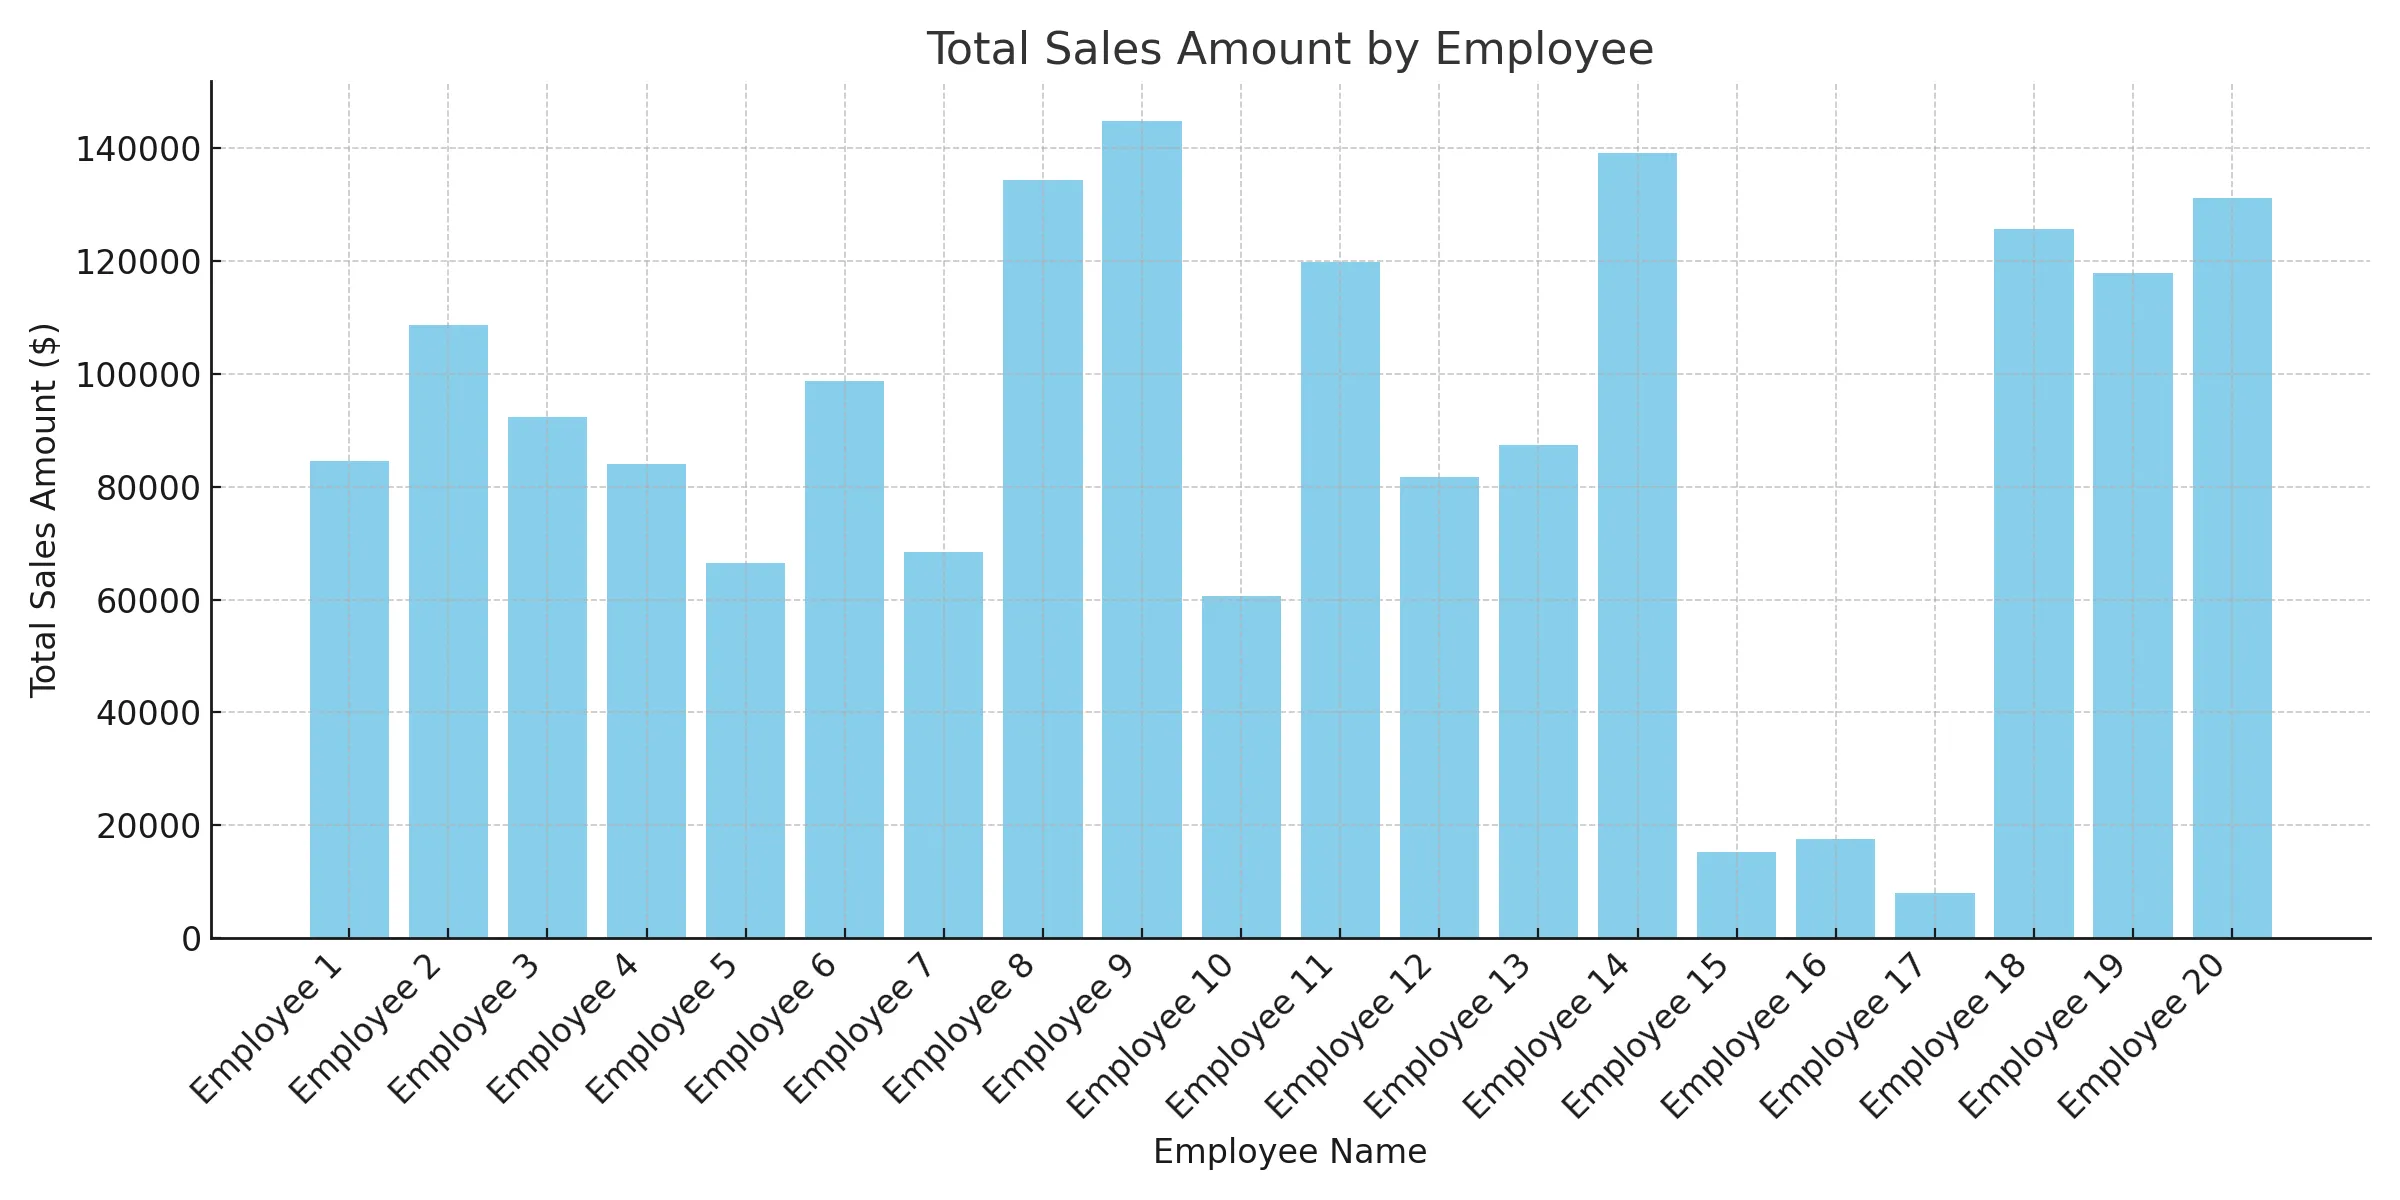
And the resulting PNG visualization we could download straight from ChatGPT. The downside is that it only generates static images, so there's not much interactivity. But it gets the job done if you need to present a slide deck with stats to your manager or board of directors.
P.S.: You may want to iterate on the prompt to make the chart look better. For example, you could add thousand separators or sort employees from high to low.
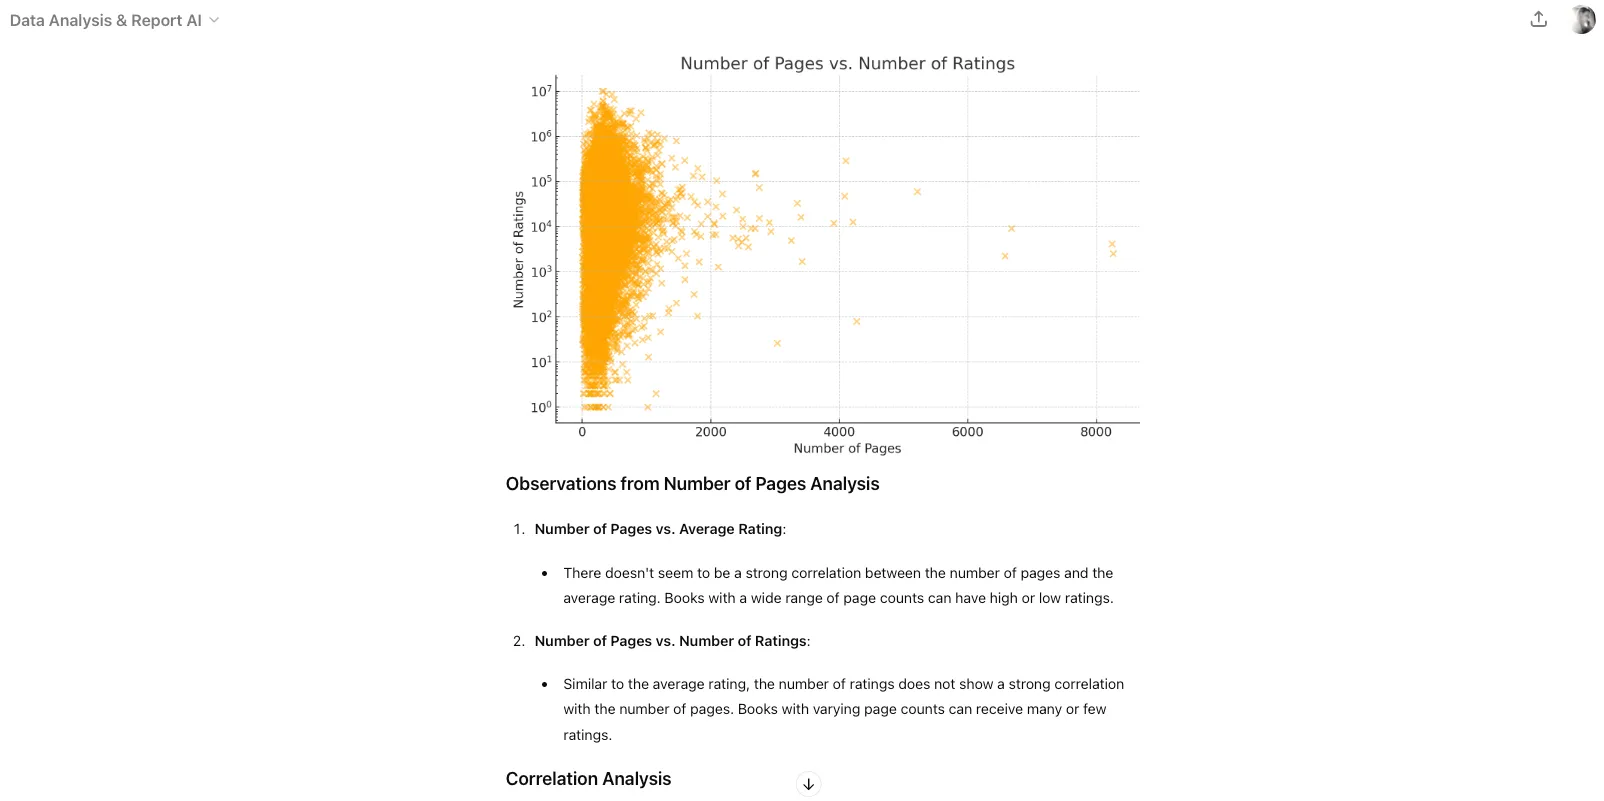
Data analysis & Report AI
The Data Analysis & Report AI GPT is great if you’re looking to do more advanced data analysis. It can identify trends and patterns in your dataset, which is great if you’re dealing with very large datasets.
We tried it out on this sample Goodreads dataset, and learned within 5 minutes that:
- fiction, fantasy and romance are the most common genres
- non-fiction and fantasy have slightly higher average ratings
- the length of a book doesn’t influence ratings
- and many other things!
It suggests some next action steps as well, which is a nice bonus! The only downside is that you can’t connect live data. You’ll have to upload a file, or input tabular data directly.
Is AI data visualization the future?
Traditional BI tools like Power BI and Tableau used to be the way to go for data visualization. Today, however, the way we analyze data has changed. Nearly everyone uses data to make decisions, and we expect insights to be offered on a platter, within our daily workflows.
With ChatGPT, you can now do many data visualization tasks that you’d previously need a data scientist for. And with custom GPTs for data visualization, we expect even more people will start analyzing their data directly in ChatGPT.
If you want to combine the best of both worlds, and mix artificial intelligence with stunning interactive visualizations, look no further than Luzmo. Create charts and dashboards using plain English - or even pictures! - inside Luzmo or directly via ChatGPT.
And the best thing is, you can embed these visualizations straight into your software application, for all your customers to use!
Sign up for a free trial today and try out our AI-powered analytics platform today!
Written by

Ship the future of your data
Let us show you what Luzmo can do for your product.

Leave your e-mail and one of our analytics experts will reach out to you