Bye Data Flattening: How To Eliminate 3 Painful Dashboard Workarounds
For years, building in-app dashboards for your users has come with an unspoken rule: if your data isn’t flat, it’s going to hurt.
Real-world data rarely fits neatly into a single cell. Think of products that belong to multiple categories, users assigned to several roles, or survey questions with multiple responses. You can probably think of a scenario for your app where one field has multiple values.
And yet, embedded analytics tools force you to flatten, join or transform that data before you can even think about visualizing it.
For app builders, that process is time-consuming, error-prone, and worst of all: it strips away so much important nuance to your data. You lose the richness of your data, just to make it fit the limitations of your tools.
But it doesn’t need to be that way. It’s time to ditch the workarounds: learn how to skip straight to insight without the hassle of joins, transformations and flattening.
The culprit behind data flattening: multi-value fields
Why do we need complex operations, like data flattening and joins, in the first place? It happens when your data holds more than one value in a single field – what analysts call multi-value fields or array columns. And they show up in everyday software use cases, like:
- Product categories: iPhones will be labeled as “Smartphone”, but they could also fall beneath other categories, like “Electronics,” or “Holiday Deals.”
- Feedback surveys: questions like “What did you like about the product?” where a user selects multiple reasons: “Ease of use,” “Customer support,” and “Speed.”
- Customer segments: a customer in your CRM can be tagged with “Enterprise,” “Healthcare,” and “Renewal risk.”
These aren’t edge cases. They’re everyday realities in modern SaaS apps. And unless your analytics tool supports them natively, you’re stuck building workarounds just to make that data usable.
Why most embedded analytics tools still can’t do this
There’s a reason native array filtering is rare. Most embedded BI platforms are built on a rigid, relational mindset: one value per cell, one key per join. Supporting arrays requires a full rethink of:
- the data model
- the filtering UX
- the aggregation logic
- and more
It’s hard to build, so most tools punt the problem to you.
Traditional tools like Tableau, Power BI, or Looker don’t support arrays at all without flattening. More modern tools like Hex, Metabase or Superset offer partial solutions, but they still rely heavily on SQL skills or database-side transformations. But an intuitive UI for array-based filtering, grouping, and visualization? That’s nearly impossible to find.
Luzmo changes that.
The embedded analytics platform that gets arrays right
While most embedded BI platforms force you to work around their limitations, Luzmo was built to handle the hard stuff for you, natively. No flattening, no custom SQL, no pipeline gymnastics. Just upload your dataset, and get multi-value fields that work straight out of the box.
Luzmo is the first embedded analytics platform to support native array columns. That means you can build dashboards with array columns (e.g. tags, categories, roles, or segments) without flattening your data or writing a single line of SQL. Your charts just work, even when your data doesn’t fit in a tidy spreadsheet.
Native array columns are generally available for any dataset on PostgreSQL or ClickHouse. Stay tuned, as we will expand this feature to other data sources soon!

How to fix the 3 most hated dashboard workarounds with multi-value fields
1. The drain of data flattening and joins
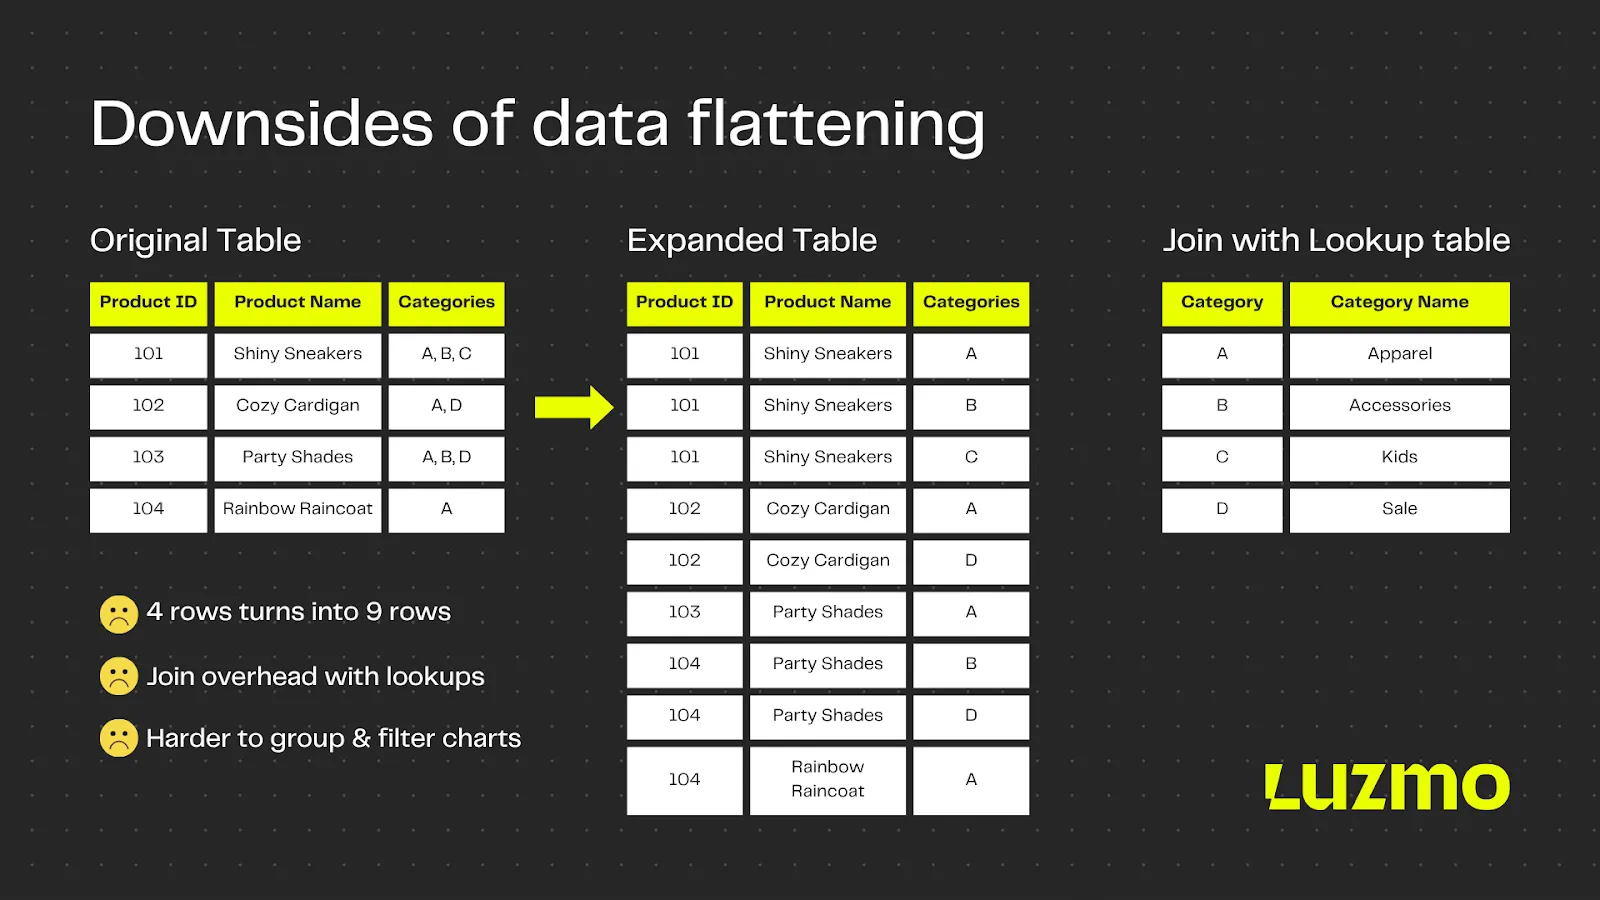
Most data teams handle multi-value fields by creating one row per value. A single product with three categories? That’s now three rows. A user with four roles? Four rows. You build a lookup table, perform a join, and multiply your data volume. And then… you pray your charts don’t break.
Even if it’s easy for an analyst to set up, it’s not a clean solution. Flattening causes data duplication: it inflates row counts, makes KPIs harder to calculate, and often requires extra SQL logic to remove double-counting. Worse, it disconnects the analysis from how the data is actually structured.
Skip data flattening with Luzmo
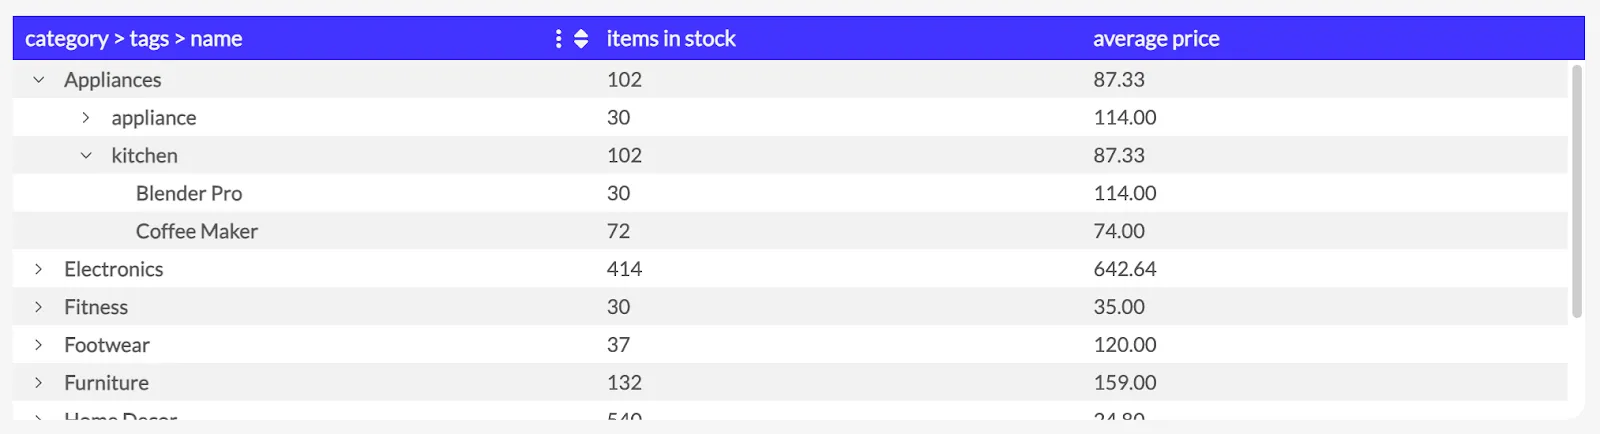
Luzmo supports native array columns for PostgreSQL and ClickHouse. It means you can visualize and filter multi-value fields without flattening. Want to see revenue by product category or tags, even if a product has five? Luzmo understands that relationship and segments it correctly. One row, multiple values, no joins.
2. The pre-processing trap
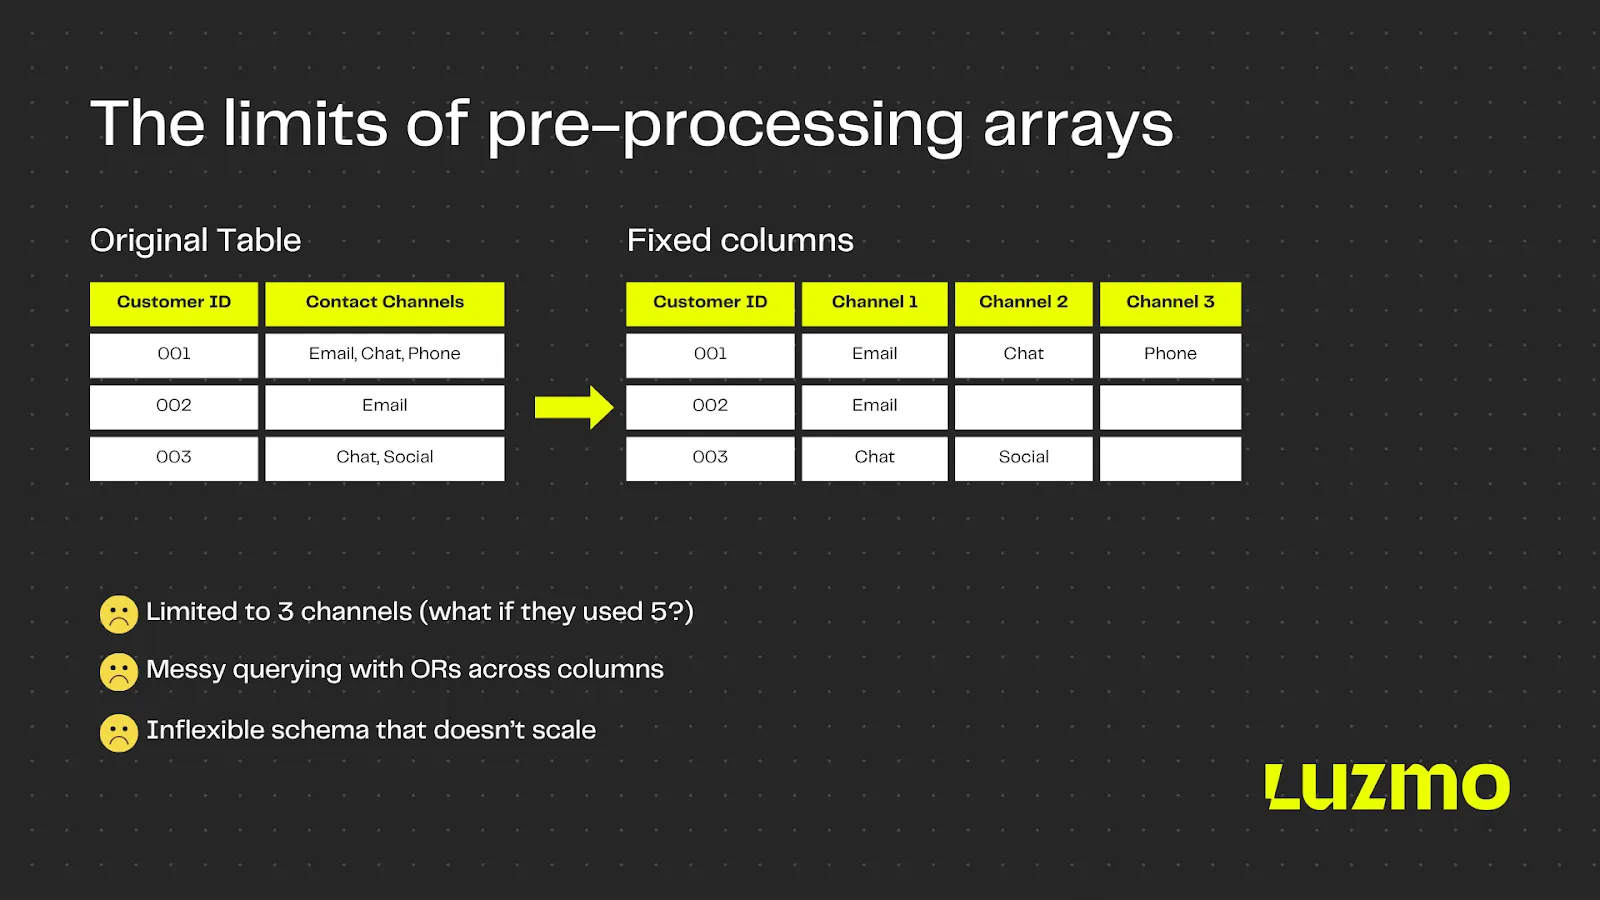
To avoid on-the-fly transformations, data teams often pre-process arrays into delimited text (like “Email, Chat, Phone”) or split them across fixed columns (Channel1, Channel2, Channel3). This makes them barely queryable, and not at all flexible.
The main problem is that pre-processing locks you into a structure. What happens when a new channel like WhatsApp gets added? Or when you want to filter for any customer who used chat, regardless of which other channels they used? You can’t. You’re locked into the original structure, and left rebuilding your data pipeline just to answer a new question.
Ditch pre-processing with Luzmo
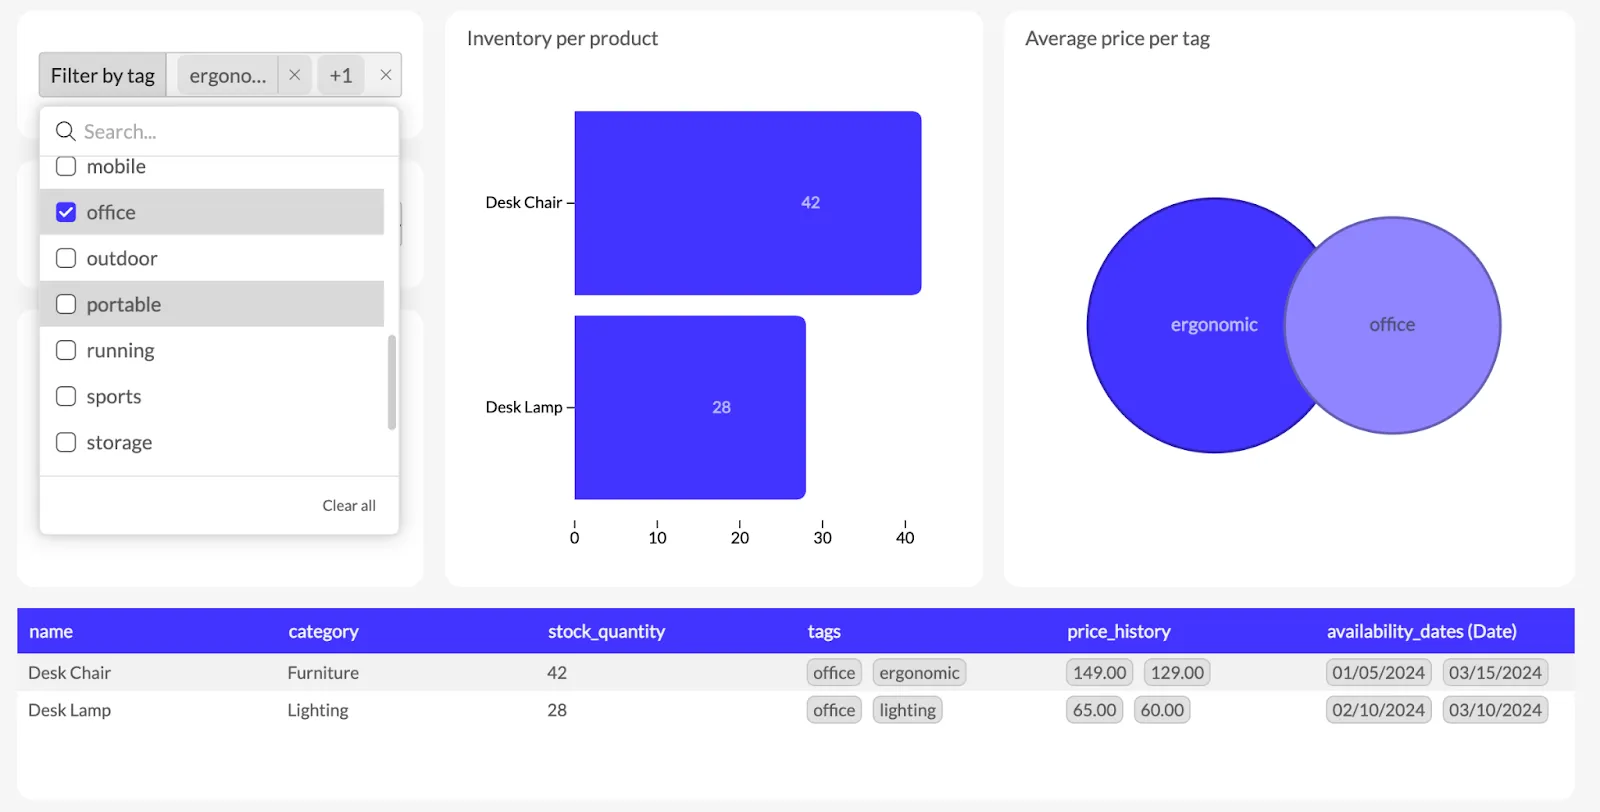
Luzmo recognizes array fields as first-class citizens. You can filter directly on array values using intuitive widgets, instead of writing complex SQL queries. Want to find all products tagged with "office" or "ergonomic"? Easy. Want to filter records with specific tags? One click. Arrays are fully dynamic and deeply integrated into the visualization layer.
3. The explode-and-aggregate hack
Having to flatten data before even touching a BI tool can feel frustrating. Some platforms, like Mode, Metabase or Hex, at least let you handle flattening dynamically, inside the BI. Data engineers can unnest arrays at query time using SQL functions like UNNEST, EXPLODE, or FLATTEN. After exploding, you aggregate your metrics again to compensate for the row duplication.
This hack works, but only for people who live in SQL every day. And then still, it’s fragile. One wrong join or aggregation level, and your numbers are off. If the above feels like foreign language to you, you’ll easily see the bigger problem: this approach doesn’t scale to non-technical people. Instead, it creates a divide between people who can use the data and those who need to.
No more complex SQL with Luzmo
No more time wasted on error-prone SQL queries. Luzmo’s visual engine supports native array columns for PostgreSQL and ClickHouse, so your metrics are always calculated correctly, even across multi-value fields. You can build dashboards that business users actually understand and interact with, without relying on a data engineering team to hold your hand.
Skip the data prep workarounds with Luzmo
Why go through the pain of data flattening, joins and SQL if it can be as easy as drag and drop?
Whether you're tracking product categories, support channels, user roles, or customer tags, Luzmo gives you a clean, scalable way to build client-facing dashboards that reflect the real shape of your software product’s data.
With native array column support, Luzmo lets you:
- Skip the prep work: Work with multi-value fields out of the box. No flattening, joining or SQL needed.
- Trust your numbers: Metrics are calculated accurately, even when one row contains multiple values.
- Explore data your way: Filter on multi-value fields in a few clicks, just like any other dimension.
- Move faster: Build dashboards faster, and empower your entire user base to explore complex data, even if they’re new to data analysis.
Curious to try it out and see how it affects your workflow? Start building with Luzmo and skip the workarounds for good!
Written by

Ship the future of your data
Let us show you what Luzmo can do for your product.

Leave your e-mail and one of our analytics experts will reach out to you