7 Best Metabase Alternatives for Data Analytics & Visualization

Today’s businesses are drowning in data and many of them have no actionable way of viewing or using it. This is one of the reasons why there are so many business intelligence and data analytics tools in the market, all promising intuitive analytics and ease of use.
One of them is Metabase, a product that “helps everyone explore and learn from data without using SQL”. It is open source, easy to use, and allows even those without any knowledge of code to do data analytics and visualizations.
But what if you’re looking for something more capable and with a different toolset? Here are the top Metabase alternatives to consider in 2026.
But first…
What is Metabase and what are its strong points?
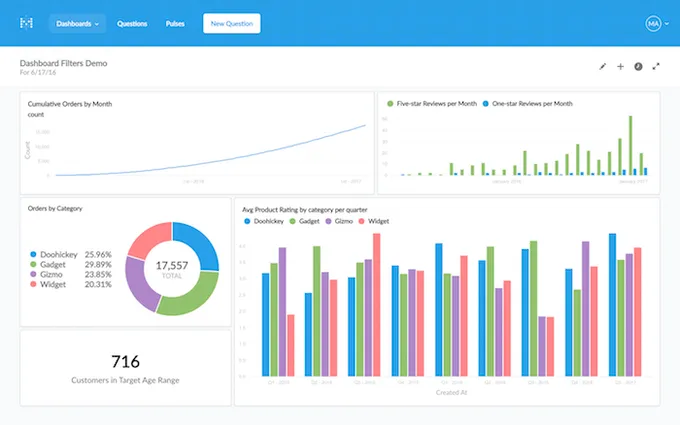
Metabase is a business intelligence and data analytics app that promises anyone to answer questions about their data - in under 5 minutes and without the knowledge of SQL.
Data exploration really is intuitive and with the visual builder, you don’t need an in-house data scientist to get started on your first dashboard. There are a few different ways to share them, from the standard links all the way to embedding them in your product.
You can connect Metabase with your favorite SSO and handle user permissions for viewing those dashboards quite effortlessly compared to some other competitors which we’ll talk about in a minute.
Pricing is another major upside to Metabase because you can get the open-source version of the tool entirely free to self-host. Managed cloud plans start at around $100/month for Starter (first 5 users included, then $6/user), with Pro at ~$575/month ($12/user, first 10 included) and custom Enterprise pricing (from ~$20,000/year). Note that with embedded analytics, your customer-facing end users also count as billable users.
Users praise its relative ease of use, the fact that it’s open-source, the availability of different customization options, and the ease of connecting various data sources, KPIs and metrics.
The downsides of using Metabase
Not everything is ideal with this tool and despite its ease of use, there are some common complaints that many customers have.
For example, there are multiple mentions of the tool being slow and cumbersome if you have a lot of data that you’re working with or importing from another tool. Not only will the tool take a bit to process the data initially, but loading it in dashboards is also going to take more time.

The second issue is that even though Metabase claims that no SQL is required, that’s not entirely true. While you can create basic reports and dashboards without using this language, any automation that is more complex and custom in nature will in fact require you to know something about SQL databases and SQL queries.
Also, ease of use comes at a cost and that is the lack of customization. Advanced users with SQL knowledge can go beyond the basic customization options provided in the visual editor. If you’re not well-versed in SQL, there’s only so much you can do when it comes to editing your reports and dashboards.
Moreover, while Metabase connects to 20+ databases and data sources, joining data across several databases in a single question is limited — you'll often want a data warehouse (or Metabase's modeling layer) to bring everything together first.
In short, some of the basic selling points of this tool - the ease of use, customization, no need of SQL knowledge - are not actually there.
Let us take a look at some alternatives instead.
Top Metabase alternatives for data analytics
Metabase does some things well but you may be looking for a completely different toolset, better pricing or ease of use. Here are some competitors you should consider as an alternative to Metabase.
Luzmo
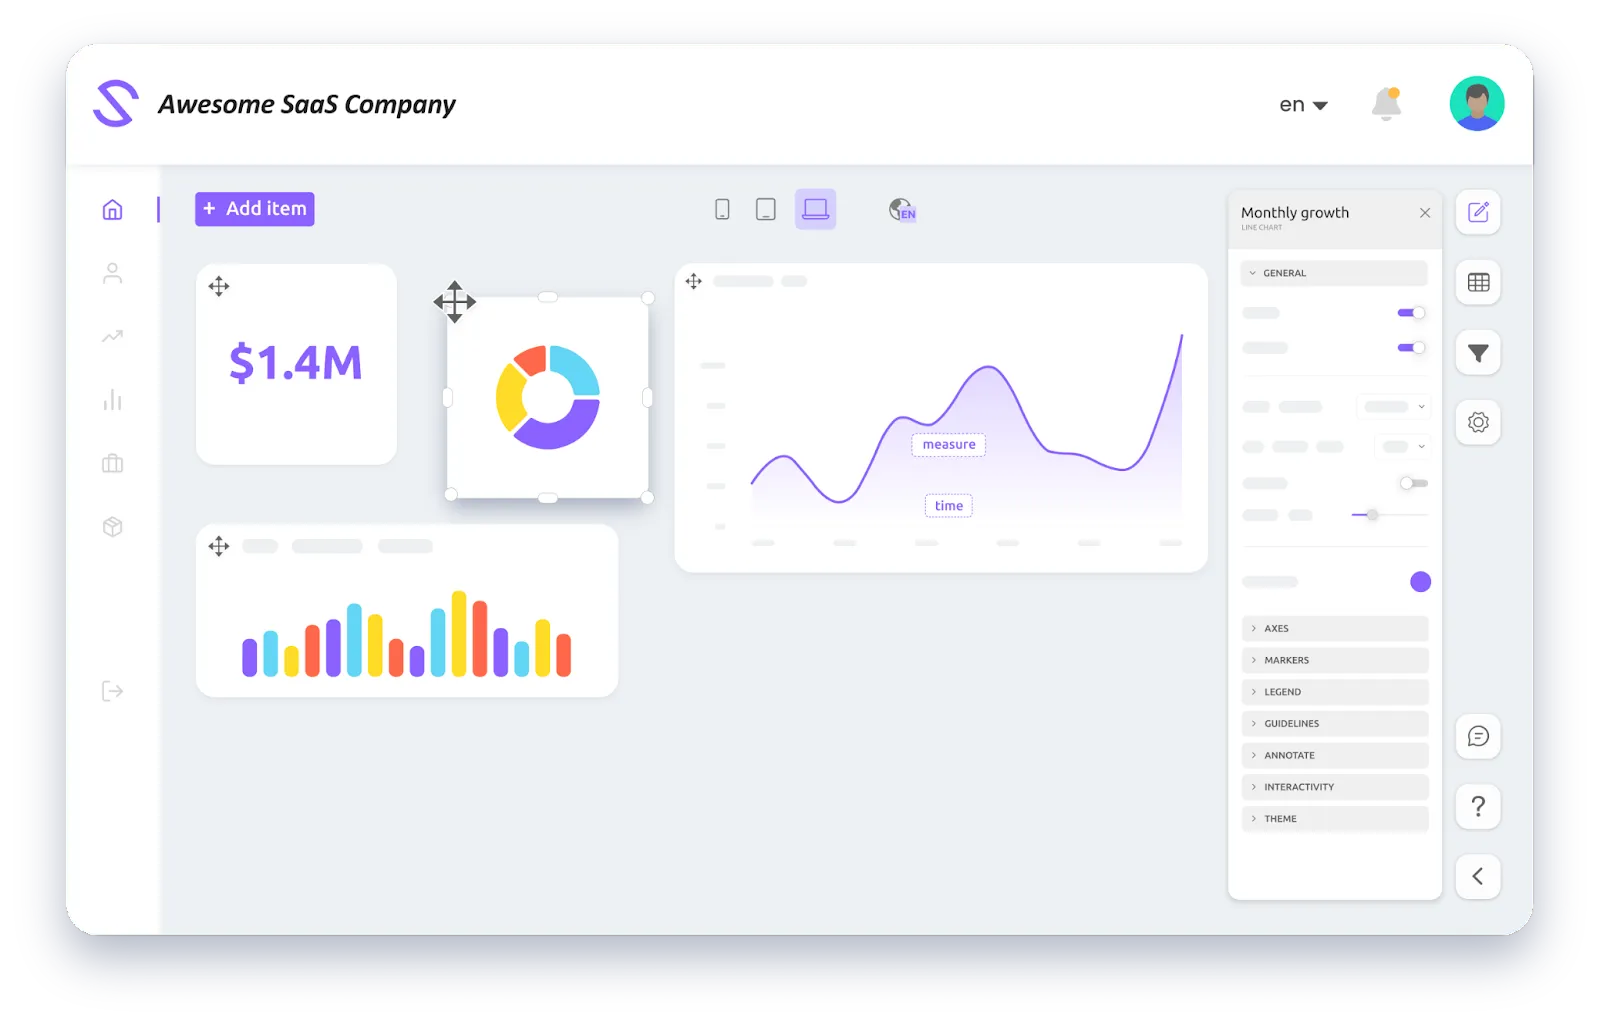
Need a tool that’s genuinely easy to use and lets you build dashboards in hours rather than days or weeks? Luzmo, one of the best Metabase alternatives for embedded analytics, was built with busy data analysts and product teams in mind, enabling them to quickly connect their data sources and visualize that data in customizable, interactive dashboards.
Simply connect your sources with our extensive list of connectors or our flexible API and you’re halfway done. Then pick from a number of dashboard templates (via Luzmo Studio) to find the one that best suits your use-case and your product.
Luzmo is ideal for SaaS teams and business users that want to embed dashboards without investing heavily in in-house development. Once the dashboard is ready, even a beginner developer can embed it into your product so it looks like it was always part of your app. It’s as no-code as it gets - non-technical users can master the typical workflow of creating a stunning dashboard.
Beyond embedded dashboards for your product users, Luzmo also allows your customers to customize those dashboards or slice data differently so they get the insights they really need.
In 2025, we’ve added new modular products:
- Luzmo IQ: a conversational analyst that turns any user into an analyst with AI-powered search and instant insight-generation.
- Luzmo Flex: a developer-first SDK to build fully custom analytics experiences inside your app.
- Agent APIs: a suite of AI-driven endpoints that automate dataset discovery, visualization generation, and more - so your analytics can think and act.
With real-time data updates, drag-and-drop dashboard builders, white-labeling, multi-tenant support, and seamless embedding, Luzmo delivers advanced analytics without heavy lift. Transparent pricing starting at €495/month for Starter and €1,995/month for Premium (billed annually, scaling with monthly active users) is available, along with a free trial.
Best for: SaaS teams that need intuitive yet powerful embedded analytics built into their product, without spending a fortune or months of development.
Looker Studio
If you’re looking for something free (or very low cost) and you don’t need heavy modelling, this might fit. Looker Studio (formerly Google Data Studio) is Google’s browser-based tool for creating reports and dashboards, especially from Google data sources like Analytics or Search Console.
It offers pre-built templates and easy sharing of dashboards. But the use-case remains limited: connectors outside the Google ecosystem can be costly or less mature, embedding is still rudimentary, and large-scale deployment may be constrained.
Best for: Marketing and agency teams already heavily inside the Google stack who need fast, low-cost dashboards.
Tableau
Owned by Salesforce, Tableau is a mature choice for on-premises or cloud-based analytics. It offers a large selection of visualisation types, strong integrations with data warehouses and apps, and is well-considered for dashboard consumers.
That said: setting up and developing dashboards in tools like Tableau is not trivial. For advanced modelling or embedded analytics, you’ll often need a specialist due to the steep learning curve. Pricing remains high and embedding remains harder than simpler platforms.
Best for: Enterprise businesses with data teams, modelling needs, strong visuals and internal/external reporting demands.
Domo
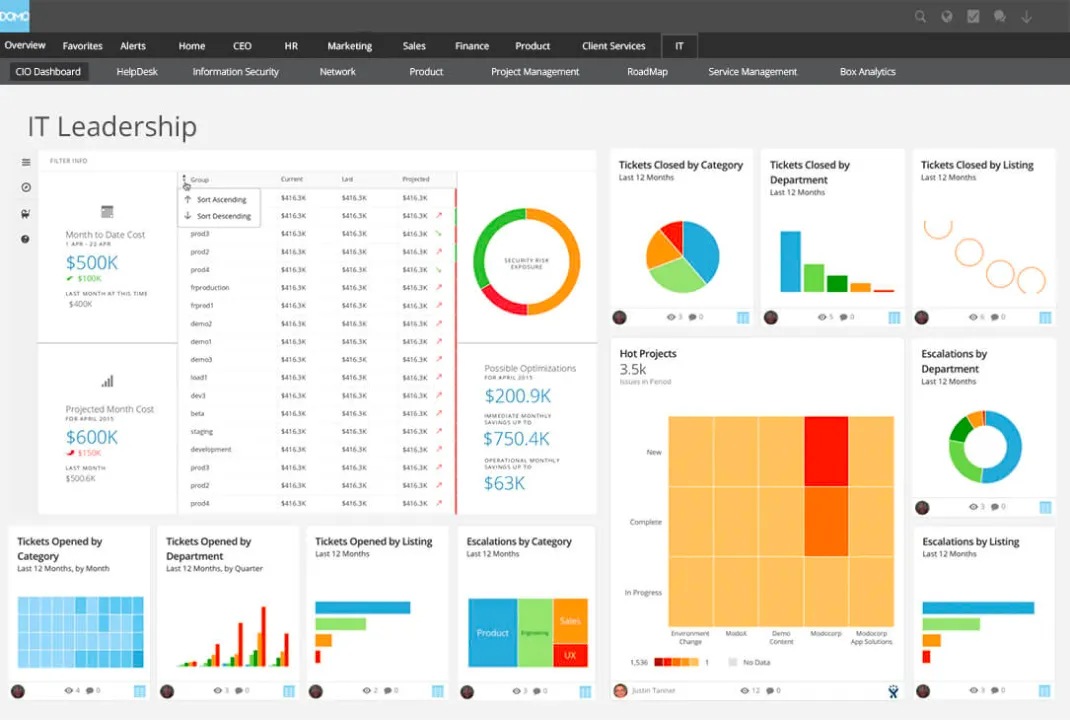
Domo is a cloud-based BI tool aimed at enterprise users. It supports many connectors, offers 150+ chart types, and even has mobile apps. It merges many roles (ETL, warehousing, visualisation) into one.
However: complexity and cost remain high. Learning curve is steeper for non-technical users, and embedded analytics may require substantial setup.
Best for: Organizations with advanced analytics needs, many data sources, and the budget to support it.
Sisense
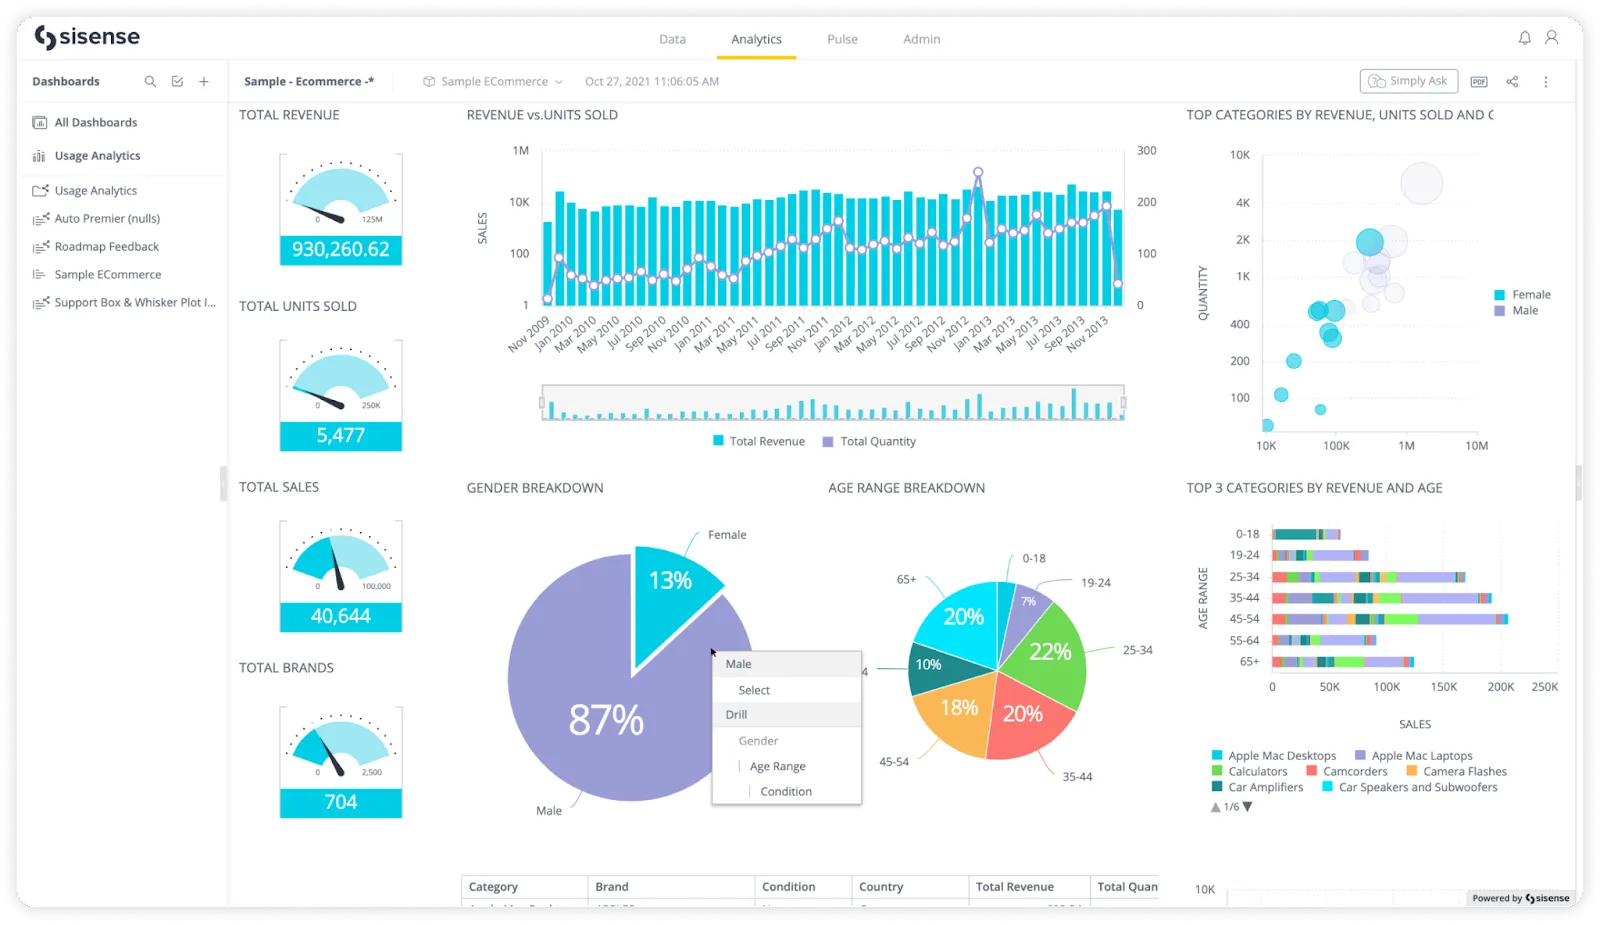
Sisense is positioned for embedded scenarios, offering a strong dashboard builder and customization. It supports on-prem and cloud deployments. That said: API access and embedding can be challenging, performance issues have been flagged, and pricing is often quoted at high levels.
Best for: SaaS tools with large budgets, experienced analytics teams, and the requirement for full embedding into their product.
Power BI
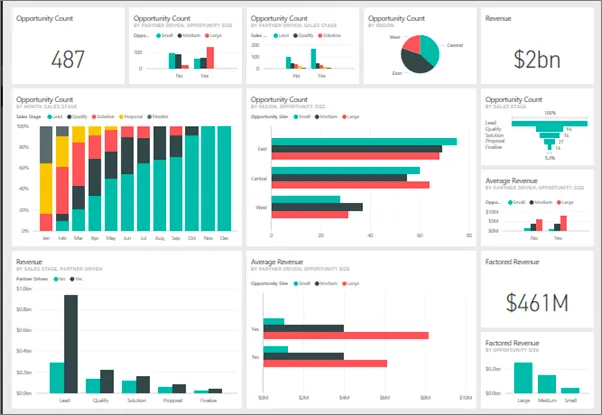
If you’re invested in Microsoft’s ecosystem, Power BI is a natural choice. It supports many data integrations (Azure, SQL Server, Excel files, etc.). It uses DAX for advanced modelling. In 2026, you’ll find strong AI-assisted features and tight integration with Microsoft Fabric.
But: to unlock the full potential you’ll likely need a Power BI specialist. Embedded analytics may still carry premium cost and complexity.
Best for: Enterprise users deeply embedded in Microsoft products, with internal reporting and data analysis needs.
Explo
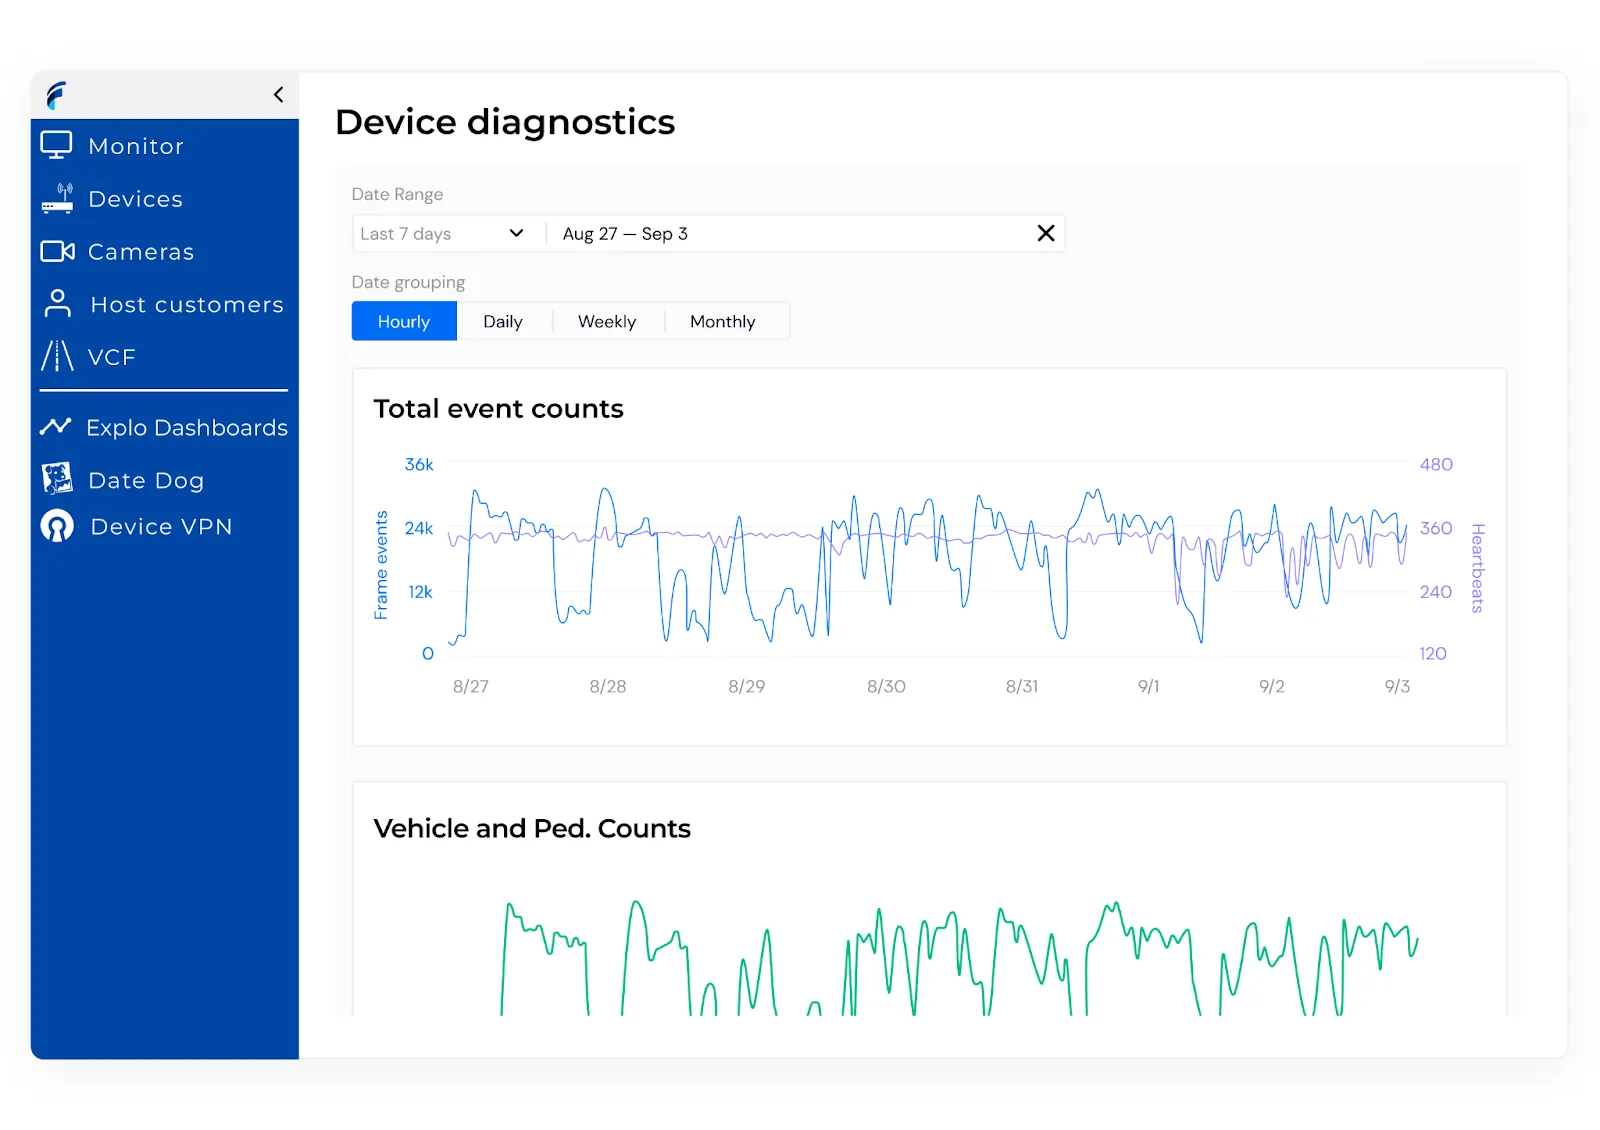
Explo is built primarily for analytics and data visualization, with a strong focus on embedding dashboards in web apps, SaaS products, or customer portals. It supports a wide set of data connectors, interactive dashboards and AI-powered reporting.
You can share dashboards in multiple ways: email links, shareable links, or embed directly into your web page or SaaS application. But unlike some general-purpose BI tools, its core strength is in customer- or user-facing analytics rather than purely internal reporting.
However, there are trade-offs: while ease-of-use is a strength, customization and advanced analytics features are not as deep as heavy-duty enterprise BI platforms. Some users also report limitations in custom visualization types or very advanced modelling.
Best for: Data-driven SaaS companies looking for a solid entry-to-mid-level embedded analytics tool with reasonable speed to value, and that value embedding dashboards for customers rather than purely internal analytics.
Metabase pricing: Flexibility for every team size
Metabase offers a pricing structure that scales with your organisation, from small teams to large enterprises. The open-source version remains available at no licence cost, making it attractive for teams prioritising budget and self-hosting.
For organisations seeking a fully managed cloud service, support, and enhanced features (like row- and column-level permissions, white-labeling and embedding), Metabase now offers:
- Starter (Cloud): around US $100/month + US $6/month per user (with 5 users included).
- Pro: around US $575/month + US $12/month per user (first 10 users included).
- Enterprise: custom pricing (starting around US $20,000/year) for mission-critical deployments, single-tenant or air-gapped hosting, dedicated support.
Whether you’re using Metabase on your own servers or in the cloud, the pricing model now offers transparency and caters to both self-service business intelligence needs and fully embedded, customer-facing analytics scenarios.
That said, if you go the open-source route you still need to factor in infrastructure, maintenance and operational costs.
In short: no matter your size, from solo analysts to enterprise data teams. Metabase has a tier that fits. Just make sure you match the plan to your deployment, dashboard-embedding, and governance requirements.
Wrapping up
Metabase is by no means a bad tool and it actually boasts many features that make it stand out against the competition. However, those features do not really work as advertised. These alternatives work for a variety of use cases and you can surely find something that meets your requirements in this list.
And if you’re looking for a tool to help you with embedded analytics in your SaaS tools - look no further. Sign up for a free trial of Luzmo to find out how quickly and easily you can build a SaaS dashboard for your users!
FAQ
All your questions answered.
What is Metabase used for?
Metabase is an open-source BI platform designed for self-service analytics. It helps teams explore data visually without needing to write SQL. Many startups use it for internal analytics, quick dashboard creation, and intuitive data exploration. While it’s popular among smaller teams, Metabase might feel limiting for complex reporting or large-scale user-facing analytics.
Why would someone look for Metabase alternatives?
Metabase is great for basic dashboards and open-source flexibility, but teams often outgrow it as their needs expand. Larger organizations may need better deployment options, stricter business logic control, or more advanced automation. Many users on Reddit mention performance issues, slower queries, and limited customization as reasons for switching. If your team requires ad-hoc queries, deeper data modeling, or embedded dashboards, a different BI platform may be a better fit.
Which tools are most similar to Metabase?
Some tools like Metabase include Luzmo, Superset, and Explo. Superset, another open-source BI tool, offers greater flexibility for developers comfortable with SQL. Luzmo, on the other hand, is ideal for SaaS teams building user-facing analytics with fast embedding. Tableau, ThoughtSpot, and Power BI represent more traditional BI solutions that appeal to enterprise users needing rich modeling, advanced governance, and predictive features.
Is Metabase suitable for startups?
Yes, Metabase remains one of the best free options for early-stage startups. Its open-source nature and simple setup make it an affordable way to get insights without heavy infrastructure. Still, as startups grow, they may need more control over deployment, scalability, and business logic, which often leads them to explore commercial alternatives like Luzmo or Domo.
How does Superset compare to Metabase?
Both are open-source analytics platforms, but Superset targets more technical users. It gives developers the ability to write SQL, manage complex joins, and define reusable datasets. Metabase focuses on a simpler, visual workflow that hides SQL behind a GUI. Superset is the best fit for engineering-heavy teams seeking more control, while Metabase suits non-technical users who prioritize intuitive data exploration.
Can Metabase handle user-facing analytics?
Yes. Metabase has a React Embedded Analytics SDK, multi-tenant data sandboxing, row/column permissions and white-labeling on its paid tiers. The main things to weigh are cost at external scale (embedded end users are billable) and how much product-grade UX you need — purpose-built platforms like Luzmo are designed specifically for branded, customer-facing SaaS analytics.
What are some Metabase alternatives for internal analytics?
For teams mainly focused on internal analytics, strong candidates include Power BI, Tableau, and Superset. These tools handle data governance, business logic, and ad-hoc reporting more efficiently for larger teams. If you want flexible visuals without heavy setup, Luzmo offers embedded and internal options in a single environment.
Is Metabase still a good choice in 2026?
Absolutely, but context matters. For small teams or startups that want an open-source BI tool for quick dashboards, it’s still a top pick. For organizations needing real-time performance, multi-source connections, or advanced embedding, alternatives like Luzmo, Superset, or ThoughtSpot may deliver more value and scalability.
Written by

Ship the future of your data
Let us show you what Luzmo can do for your product.

Leave your e-mail and one of our analytics experts will reach out to you