Product Update - March 2024
Get ready to supercharge your data game as we approach the end of Q1.
We’re thrilled to introduce a suite of new features designed to unlock deeper insights and streamline your workflows.
Check out aggregation formulas, advanced embedding (beta), query logs, and more!
Aggregation Formulas
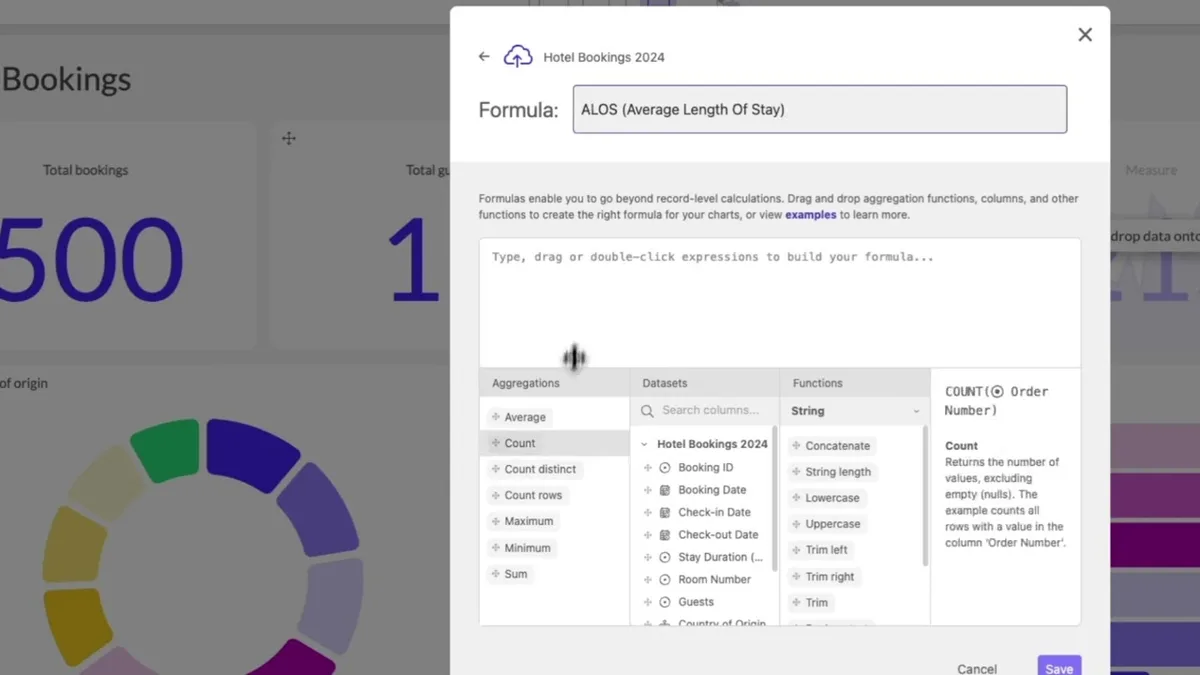
Solving complex calculations just got easier with aggregation formulas.
You can perform dynamic aggregations that go beyond basic row-level calculations. These aggregations include average, count, and sum based on your data groupings and filters, such as sales per product per week.
This enables you to easily reveal deeper trends and patterns within your data. No more manual data manipulation, so you can enjoy a more insightful data exploration experience.
Here are some examples of what you can calculate with aggregation formulas:
- Number of orders per store: COUNTD(Order ID) / COUNTD(Store ID)
- Number of deliveries per driver: SUM(Completed tasks) / COUNTD(employees)
- Average Deal Size: SUM(Contract size) / COUNTD(Deals)
- Biggest and Smallest: Order Size: MAX(order_size) - MIN(order_size)
- Inventory Turnover: SUM(Units Sold * Units Price) / AVG(Inventory)
- Average Stay Duration: SUM(Stay duration) / COUNTD(Booking ID)
- Utilization Rate: SUM(Operating hours) / (Count(Machines) * SUM(Available hours))
- Max Response Time vs Average: MAX(Response time) / AVG(Response time)
For more information on how to add aggregation formulas and current limitations, please refer to this Academy article.
Advanced Embedding Beta Release
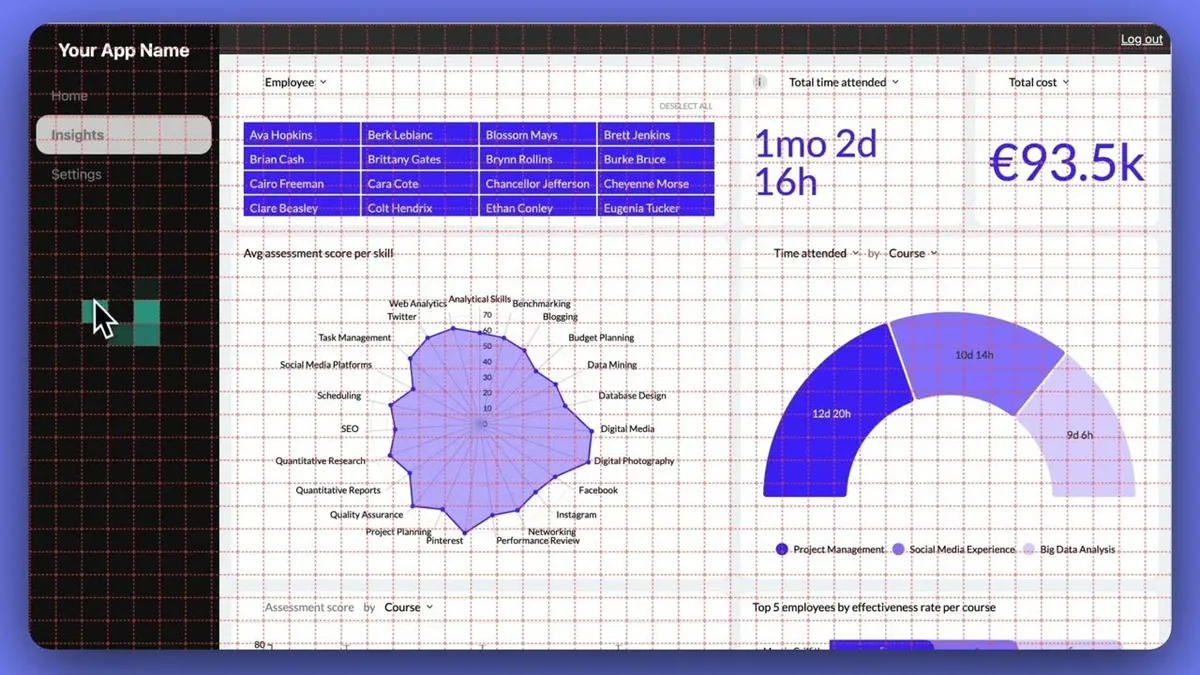
We're excited to announce the beta release of Advanced Embedding. With this new feature, you can embed Luzmo dashboard items like charts and filters directly into your app as web components.
Think of web components as the versatile building blocks of your app, similar to Lego bricks. They're reusable and independent, perfect for a composable architecture.
Unlike iframes, you can integrate custom items that feel native to your web page or platform. Web components can also dynamically interact with external items, such as filters, ensuring a more seamless experience for users.
But the coolest part? You can track how users interact with your embedded dashboards (or even specific charts and filters) using your favorite analytics tool, like Google Analytics or Mixpanel. This insider info lets you see what's working and what's not, so you can tweak your data visuals to make them even better.
Ready to join our beta? Contact your Customer Success Manager to get started.
Query Logs
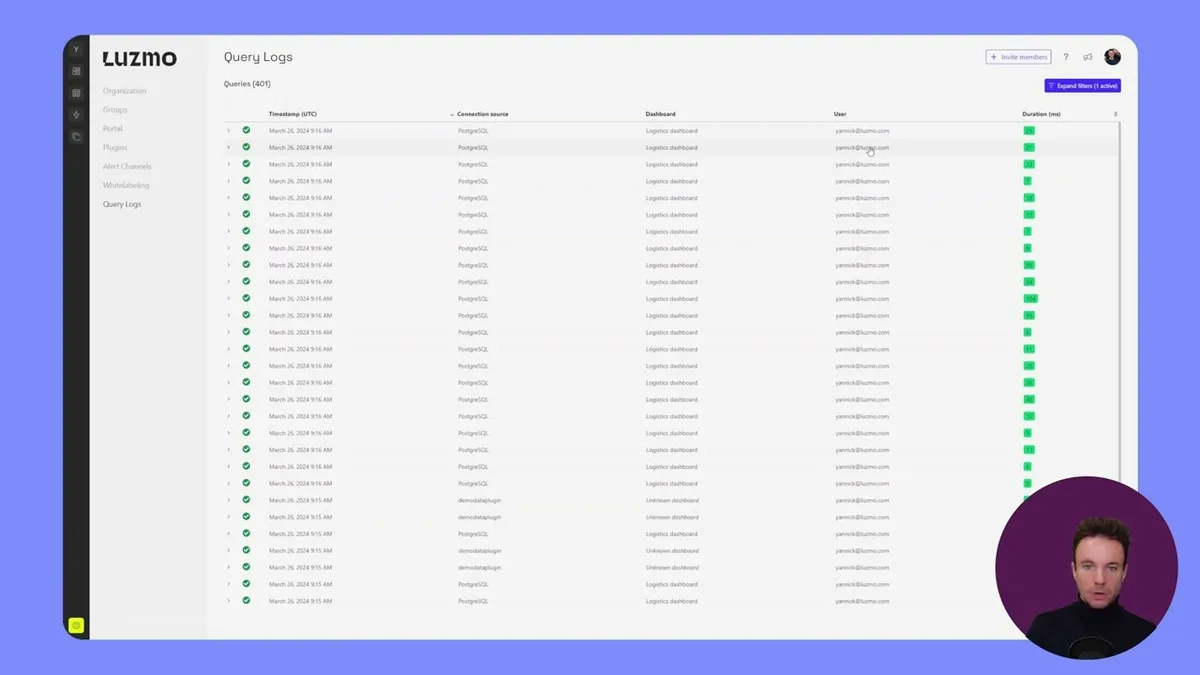
Ever stuck wondering why a query isn’t returning results? Our new query logs, accessible from the Settings page, provide a detailed record of all queries generated by your Luzmo dashboards - including those from the users of your app.
With this improved visibility, you can identify and fix failed queries faster, and proactively address problems without having to wait for user reports.
Comprehensive query logs also go beyond troubleshooting, as they offer a window into how users interact with your dashboards. By analyzing query patterns, you can see trends and proactively optimize your dashboards for smoother user experiences.
Query logs are a valuable source of information for you and your team. By understanding user behavior through queries on dashboards, you can collaborate to improve data accessibility and deliver even more insightful data visualizations.
Please note that data retention varies depending on your Luzmo plan, see our pricing page for further information.
We think you'll also love
Get out the vote: Instachart is live on Product Hunt! Head over to check out the conversation, and if you want to show some love for this sketch-to-chart AI tool, give us an upvote.
Improved BigQuery connector: This update brings order-limit, join, distinct count, SQL dataset, like-filter, and Warp custom timeout capabilities. You’ll experience faster query times and a smoother user experience.
Scheduled CSV exports: Automate data exports with our enhanced API scheduling service. You can schedule regular CSV exports of specific charts and tables directly from your Luzmo dashboards.
Start exploring these new features in Luzmo today. Take a look at our product roadmap for upcoming updates, and don’t forget, you can also submit feature requests.
Written by

Ship the future of your data
Let us show you what Luzmo can do for your product.

Leave your e-mail and one of our analytics experts will reach out to you