What is Self Service BI?

Data analytics is everywhere around us - we use data to guide almost every decision we make on a daily basis. In a business setting, data analytics can help you unlock key business insights. From driving new sales to improving customer support, your business can thrive with the right data. But what if you want the same for your end-users?
Self-service BI puts the power of data analytics into the hands of the people who use your product. And thanks to modern business intelligence tools, your SaaS business users can get actionable insights from the data in your app.
And today, we’ll explain how.
What is self-service business intelligence?
Self-service business intelligence is a type of data analytics where the end-users can explore and visualize datasets. Every user on the team, regardless of their level of data literacy, can create dashboards and reports without learning SQL or reaching out to your IT team.
Self-service BI is used by internal team members, customers, data scientists and engineers who want to save time, business analysts, marketers, sales professionals, and just about anyone who needs quick access to business intelligence insights.
Self-service BI vs. traditional BI
In a traditional BI setup, there is an internal team of data analysts, data scientists and BI specialists. If an internal stakeholder (e.g. a manager) or a customer requests a dashboard, report or some other type of data visualization to make data-driven decisions, they request this visualization from the BI team.
This starts a complicated process, from gathering datasets from various data sources, cleaning the data, formatting and structuring it properly, loading it up into a data warehouse, and finally, visualizing it in a BI platform.
While this process empowers better decision-making, it’s also complicated and unnecessary if someone wants an ad hoc, interactive report with real-time metrics.
This is self-service BI: giving end users (your customers) the ability to use self-service analytics in any software product. The users themselves have ready access to data sources, and they can create dashboards and reports with simple drag and drop.
Provided that the data quality is good and that the BI software is user-friendly, non-technical users can quickly create data visualizations and uncover actionable insights.
The benefits of self-service BI
If you have a SaaS product and you’re wondering whether to give your customers access to a BI solution or not, let’s show you some of the major benefits of having self-service capabilities.
Faster data analysis
The end users of your product no longer have to get in touch with you as their vendor or pull their IT department by their sleeves to do the basic data analysis and visualization. A user-friendly, drag-and-drop BI tool removes bottlenecks and helps the end user make key business decisions faster.
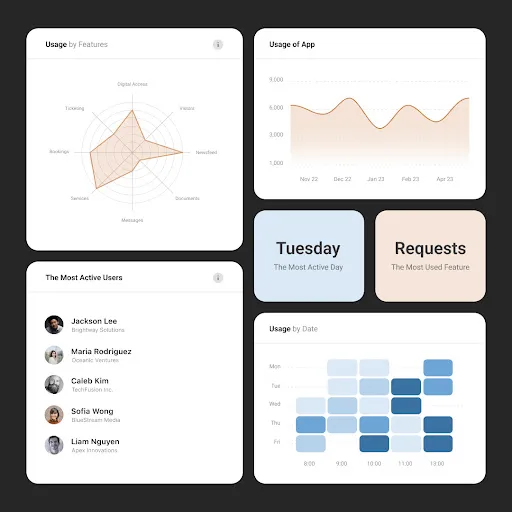
For example, someone who uses an app or AI website builder can access a self-service BI portal and create a dashboard outlining the most active users, most used features, and more. No need to ask the tool vendor or their IT team - they can get insights in a matter of minutes.
Creating a data-driven culture
Data literacy is crucial for any modern business. There is so much new data available every day that not using it means missing out on business opportunities.
With self-service BI, you can create a culture of data among your team members, from the executive level all the way to individual contributors. Instead of looking at endless spreadsheets, anyone can grab dashboard templates and create a visualization quickly, improving the decision-making process.
Additional revenue for your business
Adding a self-service reporting functionality in your app does not come free. In fact, most BI software costs thousands of dollars. But did you know that despite that, almost every SaaS product with self-service reporting earns additional revenue?
Typically, SaaS vendors sell self-service analytics as an add-on to their main product or as an extra feature in their higher pricing tiers. Dashboards and reports add even more value to your product and allow you to sell it at a higher price.
A single source of truth for your team
Data management in any organization can be a mess. Even if each department has the same data, it also has its own automation workflow, data governance, etc. The end result can be marketing, sales, and customer support having three different spreadsheets based on the same data and connectors.
Self-service BI prevents data silos from happening and with proper data preparation, it lets your entire team view the same dashboards and reports.
Wide range of customization options
Besides ease of use, modern BI tools have a wide assortment of customizations your team can use for their visualizations. You can pick and choose how your dashboards will look, rearranging widgets to tell a story.
You can also customize the dashboards and reports to fit better with your product, making them look and feel like they were coded from scratch.
Scalability
As your business grows, so will your datasets, governance policies, data models and initiatives. With a traditional BI model, this would mean hiring more people or relying on external help to create new visualizations.

Self-service BI is like any type of SaaS product - infinitely scalable and grows with you. As you add new data sources, connectors, and datasets, you can continue using the same BI solution.
The 4 best self-service BI tools to try in 2024
There is no single “best” self-service BI tool. The choice depends on your unique needs and requirements. Here are some of our top choices.
Luzmo - best for embedded analytics
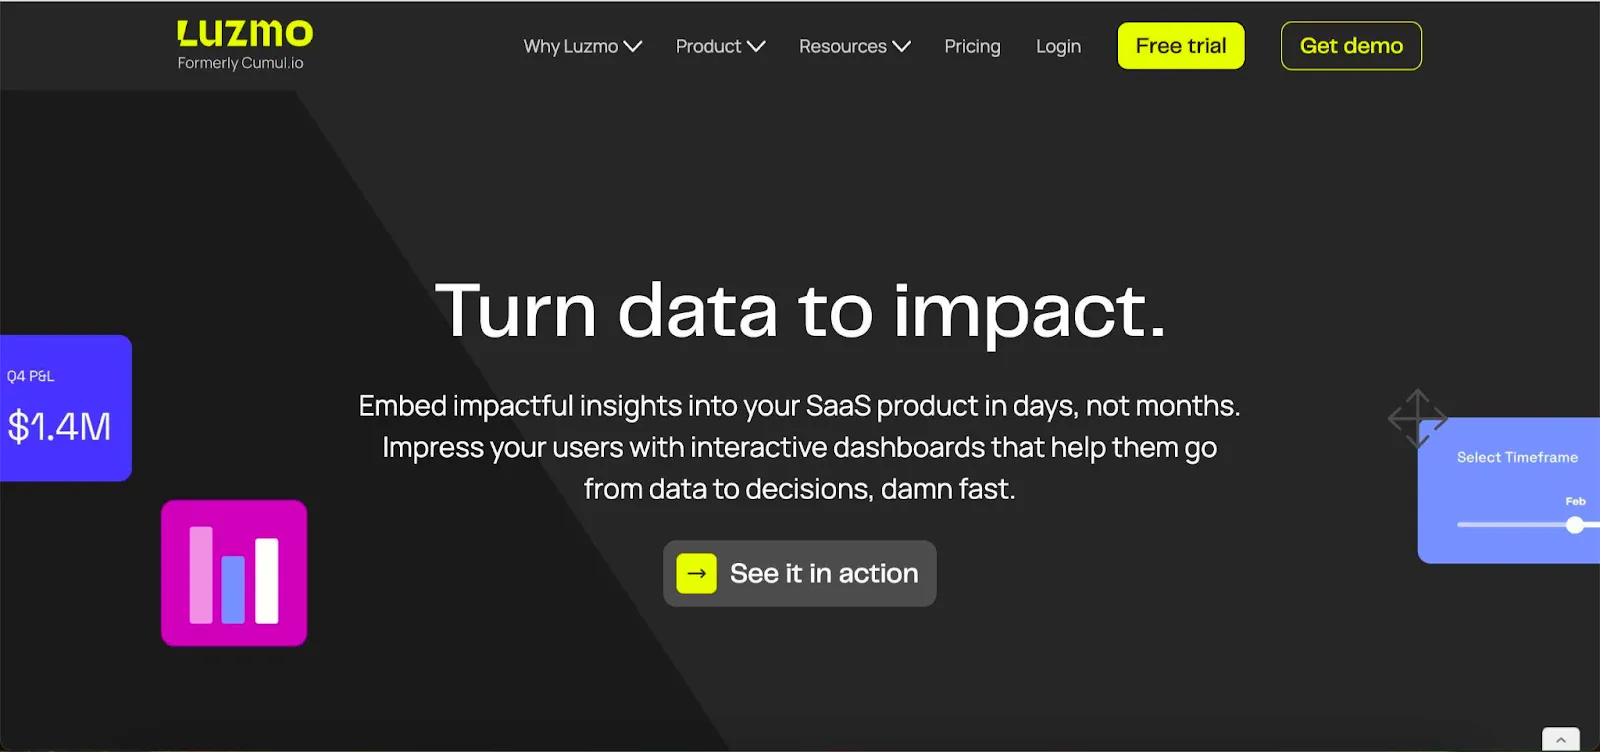
If you have a SaaS product and want to empower your end users with easy access to key data in your app, Luzmo is the best choice, for several reasons.
Luzmo is easy to connect with your app thanks to its powerful API. It also supports a variety of data warehouses and other connectors, making it light work for your team to connect your data sources. Embedding dashboards in your app is very simple compared to most other BI software.
For end users, navigating the dashboards is easy because of the great user experience and added tooltips. For example, Luzmo offers an embedded dashboard editor, allowing your end-users to create their own dashboards in your product, either from templates or from scratch.
Most other BI vendors don’t offer this option, and if they do, it’s very difficult to set up for users who are not familiar with BI tools.
Most importantly, Luzmo has pricing that is transparent and easy to understand - you know exactly what you’ll pay every month.
Grab your free trial today and empower your end-users with business intelligence insights!
Tableau - best for in-house reporting
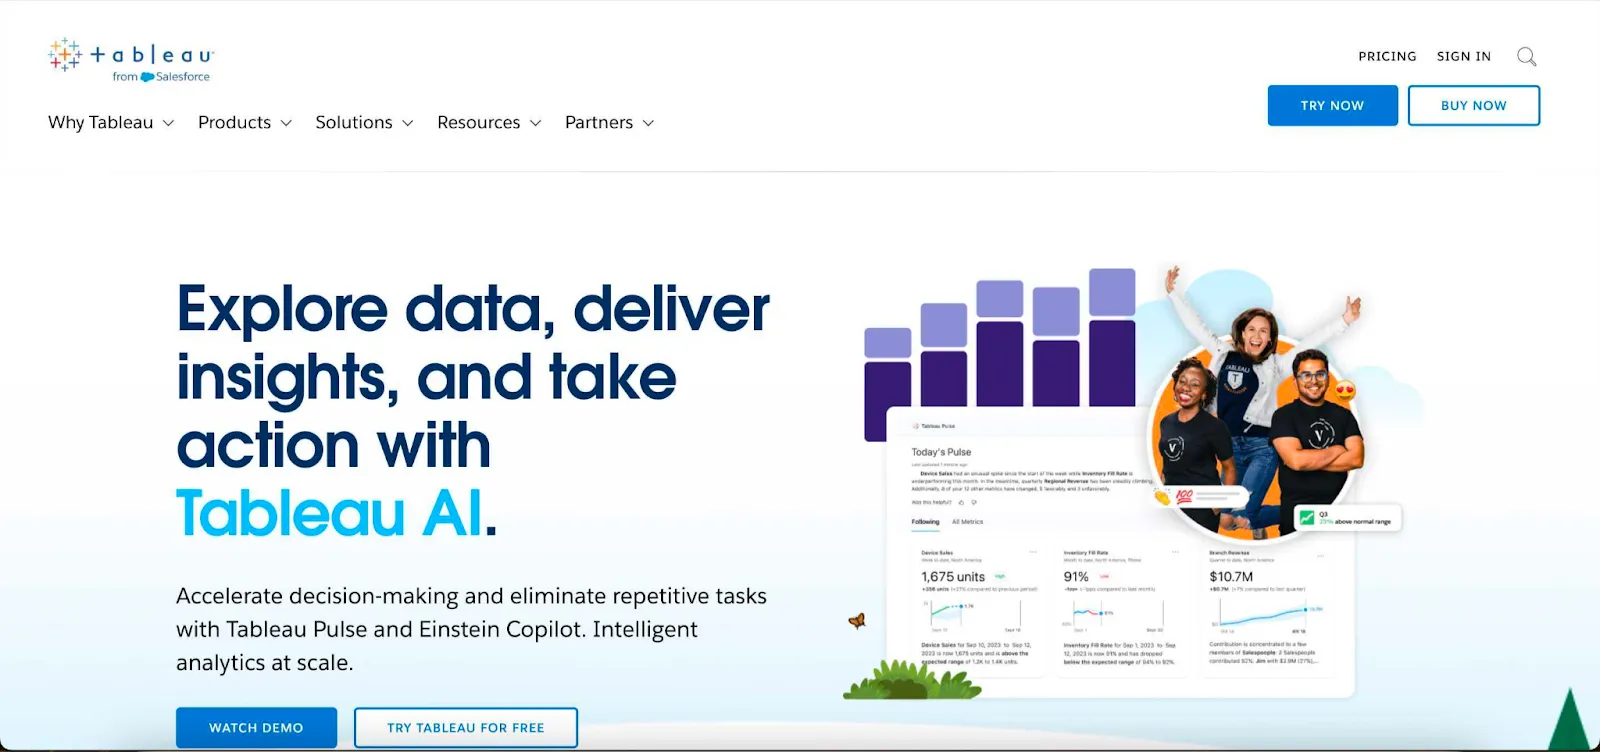
Salesforce’s Tableau is one of the top choices if you want to empower your internal team to create ad hoc dashboards and reports with ease. It’s well-known for its extensive visualization choices and intuitive interface.
If you’re considering a new BI tool for your team that you primarily want to use within your team, Tableau should probably be your first choice. With their drag-and-drop interface and a crash course in Tableau functionalities, you can create beautiful, informative visualizations.
Microsoft Power BI - for businesses that rely heavily on Microsoft products
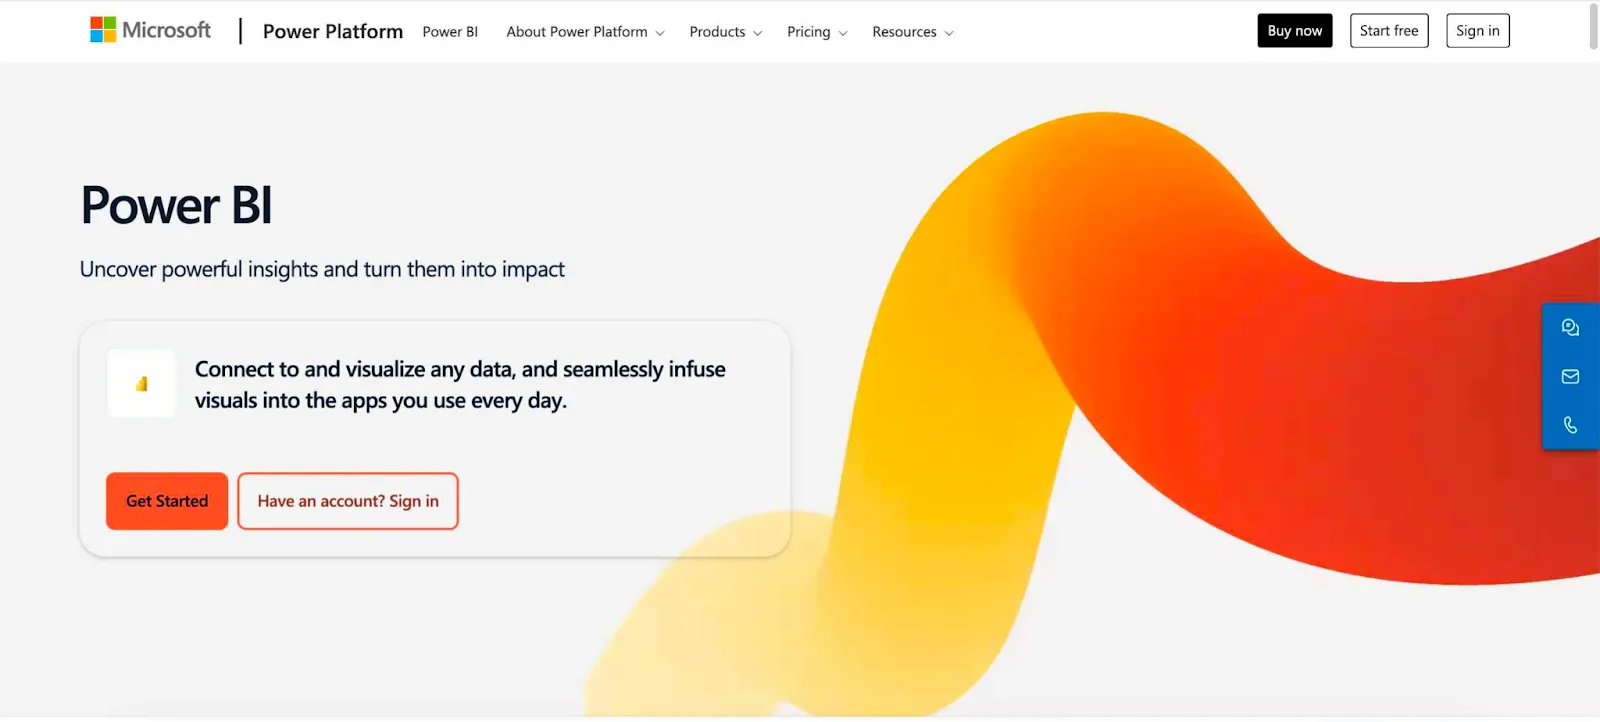
Tableau or Power BI - it’s like the BI battle between Coke and Pepsi. If you host your data on Azure and use Excel to prepare your data, Power BI might be the best selection for you.
However, Power BI is not the best idea for embedded analytics, as it’s expensive, difficult to customize, and requires the end user to have some knowledge of how this tool works.
Looker - for enterprise businesses with deep pockets
Google’s Looker is an extremely powerful tool with some of the best visualizations in the game. In terms of what the dashboards look like and in terms of the variety of choices, Looker stands up there with Tableau and Power BI.
However, it’s notoriously expensive, which is why it’s only reserved for companies with lots of money to spare on BI. It’s also not very easy to set up Looker for an embedded use case.
Get self-service BI for your tool today
For forward-thinking companies that want to empower their teams and customers, using self-service analytics in 2024 is a no-brainer. With more data literacy comes better decision-making and ultimately, more revenue for everyone involved.
If you have a SaaS product and you want to add self-service dashboards for your customers, try Luzmo. Your developers will love it when they embed a full BI solution in just a few hours, and your end-users will love how intuitive it is to explore their data.
Book a free demo with our team and we’ll show you how to get actionable insights, the easy way.
Written by

Ship the future of your data
Let us show you what Luzmo can do for your product.

Leave your e-mail and one of our analytics experts will reach out to you