Tableau vs ThoughtSpot: 2026 Comparison
Selecting a modern business intelligence tool (BI tool) is no trivial task.
Between ThoughtSpot and Tableau, you are comparing two very different data platforms: one built from the ground up for AI‑driven search and self‑service analytics, and another that became a household name through best‑in‑class data visualization.
Since the BI landscape is racing towards agentic analytics, it’s worth revisiting how these platforms stack up in 2026.
We’ll look at features, ease of use, dashboards, embedding, pricing and which tool might fit your business needs. Finally, we’ll introduce Luzmo as a third option purpose‑built for embedded analytics.
ThoughtSpot and Tableau at a glance (+ AI innovations)
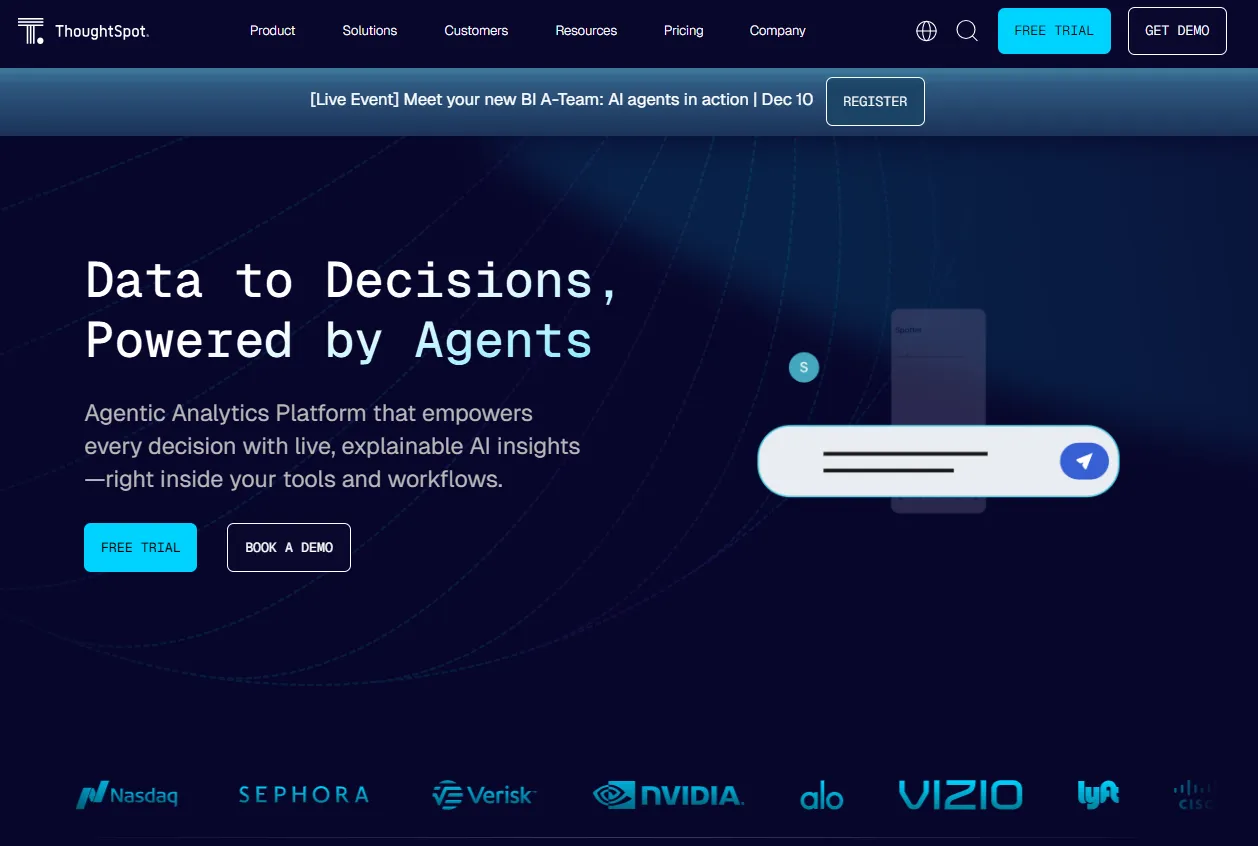
ThoughtSpot has evolved dramatically since its launch in 2012. Once known primarily for its search‑driven analytics, the company now describes itself as an agentic analytics platform. ThoughtSpot’s portfolio includes ThoughtSpot Analytics for self‑service BI, ThoughtSpot Embedded (formerly ThoughtSpot Everywhere) for embedding dashboards into other apps, ThoughtSpot Mode for code‑first data work, and, most recently, Analyst Studio.
The vendor’s strategy centres on AI‑powered natural language querying, letting users ask questions in plain English and get answers on live data. In April 2025 ThoughtSpot launched its Agentic Analytics Platform, generalizing its agentic AI architecture and releasing a Semantic Layer and versions like SnowSpot and DataSpot to natively integrate with Snowflake and Databricks.
In September 2025 the company updated ThoughtSpot Embedded, introducing Spotter 3, an updated AI agent that can access unstructured data and perform multi‑step reasoning; an Integrated Developer Playground and mobile SDK for custom experiences; and a Model Context Protocol (MCP) server connection to external AI platforms.
The update emphasised four pillars: embedded intelligence, native experiences, seamless workflows and an open ecosystem to deliver actionable insights with trustworthy, agentic AI.
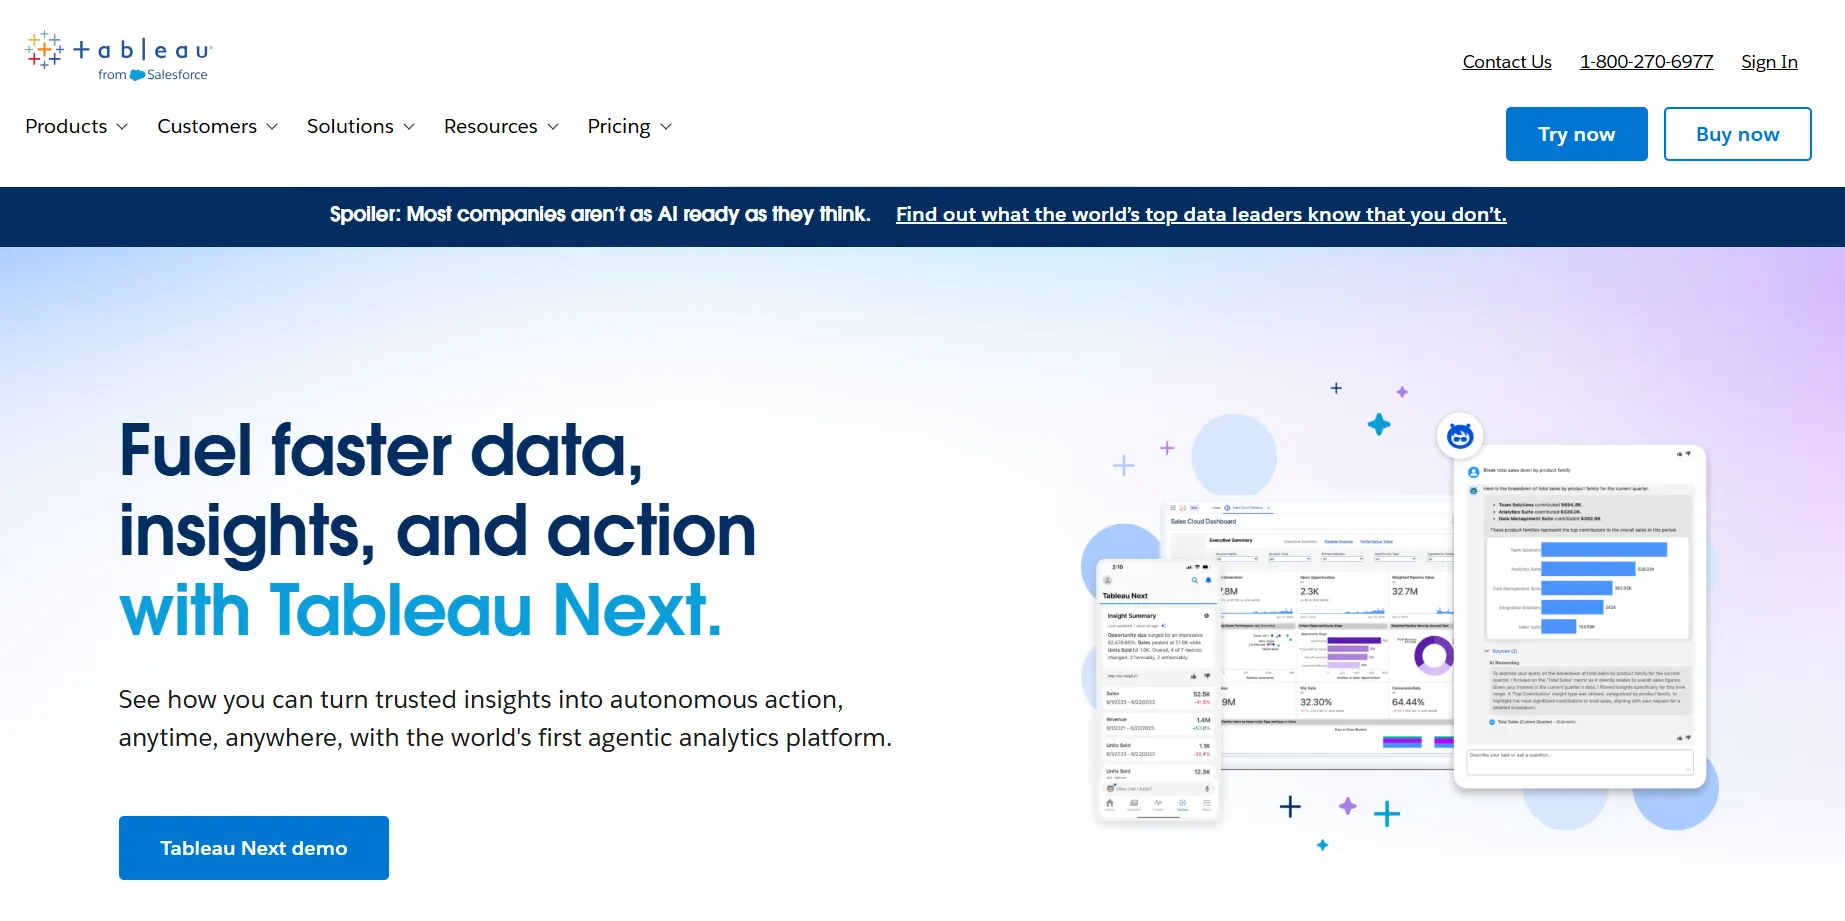
Tableau, by contrast, has been part of Salesforce since 2019 and is firmly established among BI platforms. The core offerings - Tableau Desktop for local analysis, Tableau Server for on‑prem deployment and Tableau Cloud for SaaS delivery - still power most deployments.
However, in 2025 Tableau rolled out Tableau Next, its own agentic analytics experience. The November 2025 release added an MCP Server that allows AI agents to run secure analytics on a governed semantic layer.
It also introduced Published Data Sources into Tableau Semantics to build semantic data models from existing sources, an External Embedding SDK to embed agentic analytics in any web app, Concierge in Lightning, which brings conversational analytics into Salesforce workflows, and dashboard enhancements such as ad‑hoc calculations, custom colours and intuitive widget repositioning.
The 2025.2 release added Semantic Learning (improved agent knowledge management), Tableau App for Google Workspace (embed vizzes in Docs and Slides), Dynamic Spatial Parameters for synchronized maps and a Performance Insights Dashboard to troubleshoot slow dashboards.
These innovations show Tableau’s pivot towards agentic, context‑aware analytics while maintaining its reputation for rich visualisations.
Ease of use and self‑service analytics
Both ThoughtSpot and Tableau aim to democratize analytics, but they target different audiences.
ThoughtSpot built its reputation on self‑service and plain English search. Non‑technical users can type questions like “show me sales by region last quarter” and get tables and charts instantly.
With the launch of Spotter and the Agentic Analytics Platform, ThoughtSpot now allows plain English questions to be answered through semiautonomous agents that perform multi‑step reasoning and even surface hidden drivers. However, the ease of use comes with caveats: to enable natural language search, someone must first model the data, define metrics and connect the right data sources.
The Analyst Studio release shows the company acknowledging this by providing a full data preparation environment with AI‑assisted SQL editing, Python and R notebooks, and built‑in data pipelines. Mode, acquired by ThoughtSpot in 2023, is now integrated into Analyst Studio for code‑first analytics. Thus ThoughtSpot is more accessible for non‑technical users once the data team has done the modelling, but it remains a platform that requires investment from your data team.
Tableau’s hallmark is its drag‑and‑drop interface. Even business users can build dashboards quickly using pre‑built templates. VizQL, a visual query language, translates user actions into optimized SQL or other queries. Recent Tableau Next updates bring conversational analytics through Concierge, letting users ask questions in natural language and receive explanations with next‑best actions.
Semantic Learning allows organizations to train agents with domain knowledge for more accurate responses. For power users, Tableau still supports Python and R integration, advanced calculations and complex data modelling. Learning Tableau might take time for someone unfamiliar with visual analytics or building calculations, but the vibrant community, robust training materials and Tableau Public galleries shorten the learning curve.
Overall, Tableau offers a more polished user experience for dashboard authors and consumers, while ThoughtSpot excels at self‑service analytics via search once the groundwork is in place.
Visualization capabilities
Data visualization remains a key differentiator.
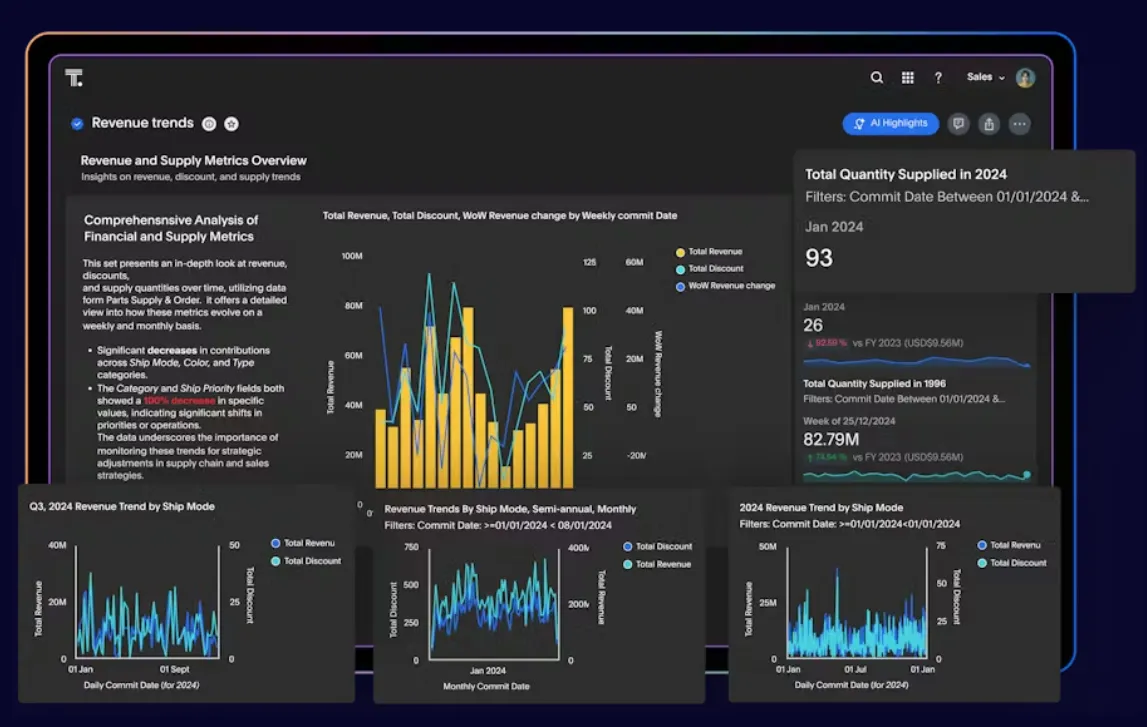
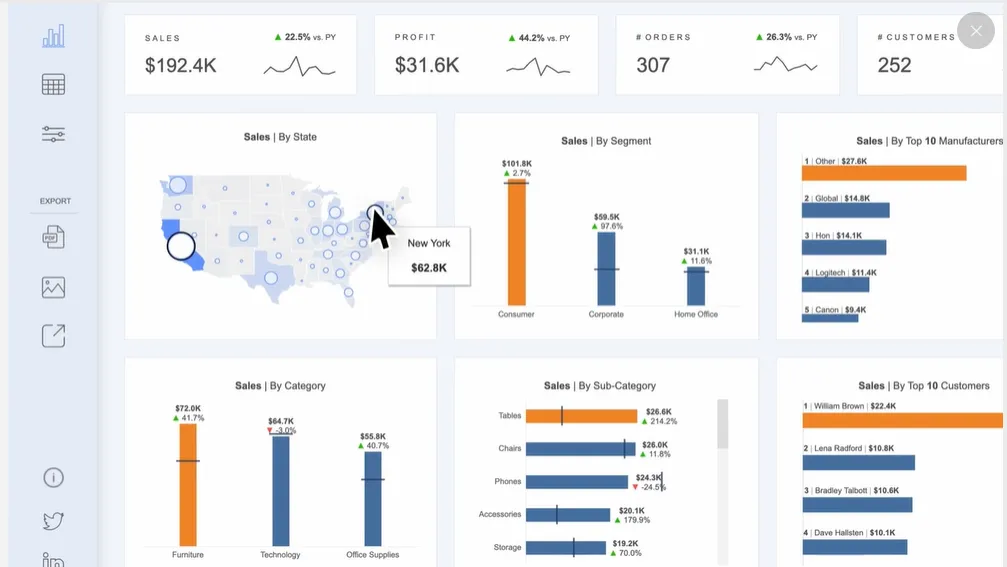
ThoughtSpot has historically been criticized for limited chart types, many compared its visualizations to Excel. The vendor responded by adding AI‑augmented dashboards and Liveboards, which allow users to drill anywhere and ask new questions without leaving the board. Spotter’s AI can automatically surface trends and explanations.
However, the variety of charts is still narrower than some competitors and customizing them to match your brand may require developer involvement. ThoughtSpot’s strength lies in delivering insights quickly rather than producing pixel‑perfect dashboards. Large datasets are handled well thanks to its underlying search technology, but heavy queries can still be costly on a per‑query pricing model (discussed later).
Tableau, on the other hand, is often cited as the best BI tool for visual exploration. With dozens of graphs, maps and geospatial charts, dynamic colours and responsive layouts, it outshines most traditional BI tools. The 2025 updates further improved the range of visualization options: users can create ad‑hoc calculations inside the viz builder, reposition widgets easily and customize colour schemes. Dynamic Spatial Parameters enable synchronized maps for deep geo‑analysis, and the Performance Insights Dashboard helps authors identify slow worksheets.
These enhancements confirm why many data teams and tableau users still rely on Tableau for exploring complex data visually. Put simply, Tableau makes beautiful, interactive dashboards that help you visualize data and share stories with your stakeholders.
Dashboard embedding and integration
Delivering analytics within your product workflow is increasingly important. Both ThoughtSpot and Tableau provide options to embed dashboards, but there are notable differences.
ThoughtSpot Embedded (recently rebranded from ThoughtSpot Everywhere) offers a Visual Embed SDK, REST API, JavaScript API, iFrame support and SAML/0Auth SSO. With the September 2025 update, ThoughtSpot added a Mobile SDK and an Integrated Developer Playground to help developers test and customise embedded experiences.
Spotter 3 can now be embedded so customers can query unstructured data, and the new Model Context Protocol server enables ThoughtSpot to send context to external large language models like ChatGPT. These features make ThoughtSpot more competitive in the embedded analytics space, though customizing the look and feel still requires development resources, and consumption‑based pricing means heavy usage can be expensive.
Tableau’s embedded analytics story has matured with the advent of Tableau Next. The External Embedding SDK lets developers embed dashboards and metrics into any web application. Concierge in Lightning integrates conversational analytics directly into Salesforce flows. Tableau also supports SSO via SAML/OAuth and offers options to embed through Tableau Public, Tableau Desktop (embedding via JavaScript API or web embedding) and Tableau Server.
These options allow you to embed dashboards with fine-grained permissions and brand customisation. Implementation still requires a developer, but the community offers many examples and the SDK simplifies tasks like authentication and theming. Because Tableau uses a per‑user licence model rather than consumption pricing, embedding costs are predictable once you know how many viewers and authors you need.
Data sources, integration and semantic layers
Connecting to data is table stakes for modern BI solutions.
ThoughtSpot’s underlying architecture allows users to search across a variety of data sources including cloud warehouses like Snowflake, Databricks, Google BigQuery and Amazon Redshift. The platform’s Any Data, Anywhere approach emphasises zero‑copy live queries and unified metadata; Spotter 3 can connect to unstructured sources via the MCP server.
Analyst Studio adds support for Python notebooks, R and SQL editors, making it easier for data scientists to prepare and mash up data. ThoughtSpot’s new Agentic Semantic Layer provides a trusted metrics layer that helps agents interpret queries accurately.
Tableau connects to hundreds of data sources out of the box - relational databases, OLAP sources, Excel, Salesforce and APIs. The new Published Data Sources into Tableau Semantics feature allows users to bring existing Tableau Cloud data into semantic models and share them across workbooks. Tableau Bridge continues to support hybrid on‑prem/cloud scenarios.
For those who need ETL, Tableau Prep provides data preparation capabilities, while Tableau Data Management adds catalogue and governance. Tableau doesn’t yet support unstructured data for queries, but its integration with Salesforce’s Genie data platform and Tableau Pulse ensures real‑time metrics can be surfaced where teams already work.
Pricing and licensing (2026)
ThoughtSpot pricing underwent a major shift in 2025.
On its pricing page, ThoughtSpot now lists four tiers: Essentials, Pro, Enterprise and Developer. The Essentials plan starts at $25 per user per month (billed annually) and includes dynamic interactive dashboards, up to 25 million rows and between 5 and 50 users. The Pro plan begins at $0.10 per query and targets growing businesses; it includes Spotter AI agents, Analyst Studio and supports 25-1000 users with up to 250 million rows.
Enterprise plans offer unlimited users and data with custom pricing. The Developer tier is free for up to one year for up to 10 users and 25 million rows. This new pricing structure reflects ThoughtSpot’s shift toward consumption and agentic capabilities, but it can still be unpredictable if your usage spikes.
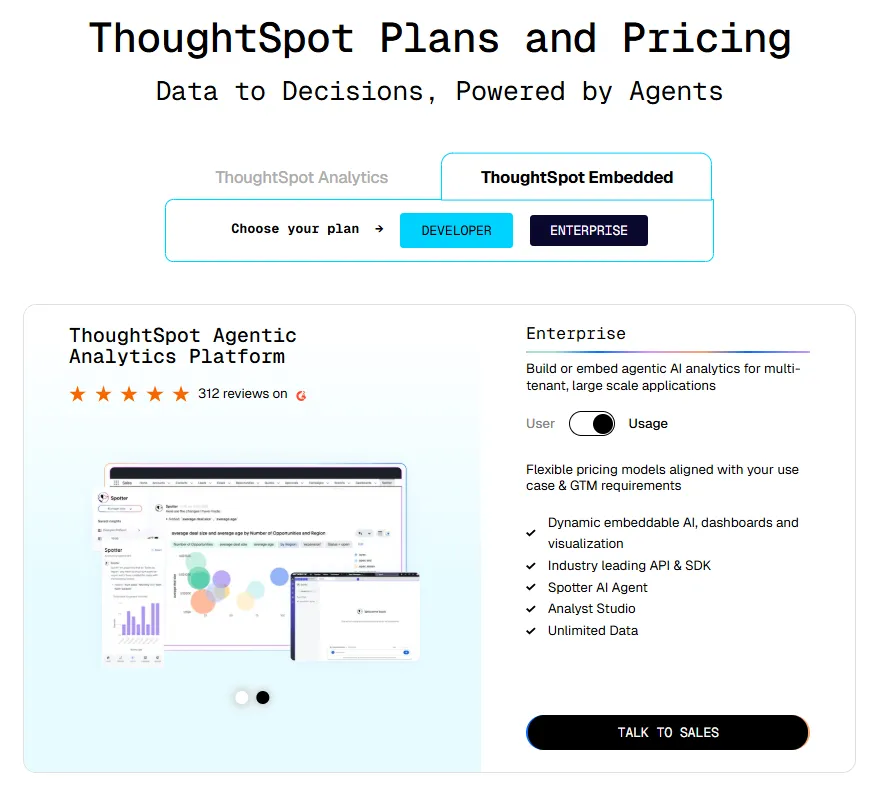
Tableau pricing remains more transparent.
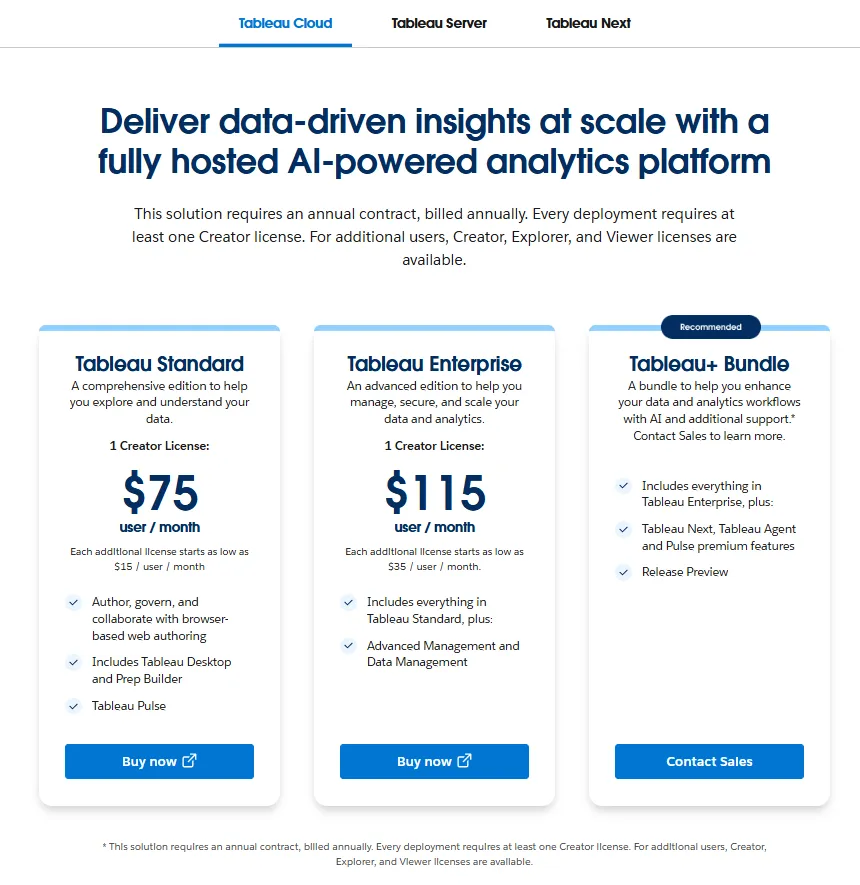
For Tableau Cloud (formerly Tableau Online), a Creator licence costs $75 per user per month and includes Tableau Desktop and Prep; each additional licence starts at $15 per user per month. The Tableau Standard edition requires at least one Creator and offers web authoring, governance and Tableau Pulse metrics.
The Tableau Enterprise edition is priced at $115 per Creator per month with additional licences starting at $35 per user per month, adding Advanced Management and Data Management capabilities. Tableau sells a Tableau+ Bundle that combines Tableau Cloud with Tableau Next and agentic AI features; it requires contacting sales.
Unlike ThoughtSpot’s consumption model, Tableau’s per user per month subscription makes it easier to budget once you know how many creators, explorers and viewers you need.
Which tool fits your use case?
Deciding between Tableau or Thoughtspot depends on who will use the system and how.
If your primary requirement is self-service analytics with plain‑language search for non‑technical users, and your data team can build the necessary models and manage consumption costs, ThoughtSpot offers an innovative approach. Spotter 3’s ability to access unstructured data and perform multi‑step reasoning brings analytics closer to natural conversation. Analyst Studio and Mode support code‑first workflows, making ThoughtSpot an attractive option for organisations that want to combine AI-driven search with code‑driven data analysis in one complete intelligence platform. However, heavy usage can get expensive, and the platform’s visualisations remain less polished.
If your team values rich, polished dashboards and drag‑and‑drop design, and you have a mix of business users and analysts who want to explore data visually, Tableau may be a better choice. Tableau’s 2025 updates align it with the agentic AI trend while retaining its core strengths. It supports large datasets, multiple data warehouses, and connectors to tools like Salesforce and Qlik. With features like Concierge, Semantic Learning and Dynamic Spatial Parameters, Tableau allows you to ask natural language questions and get recommendations while still having full control over the data model. Pricing is clear, though adding AI features or switching to the Tableau+ Bundle may require negotiating with sales.
You don't want to use ThoughtSpot or Tableau? Consider Luzmo
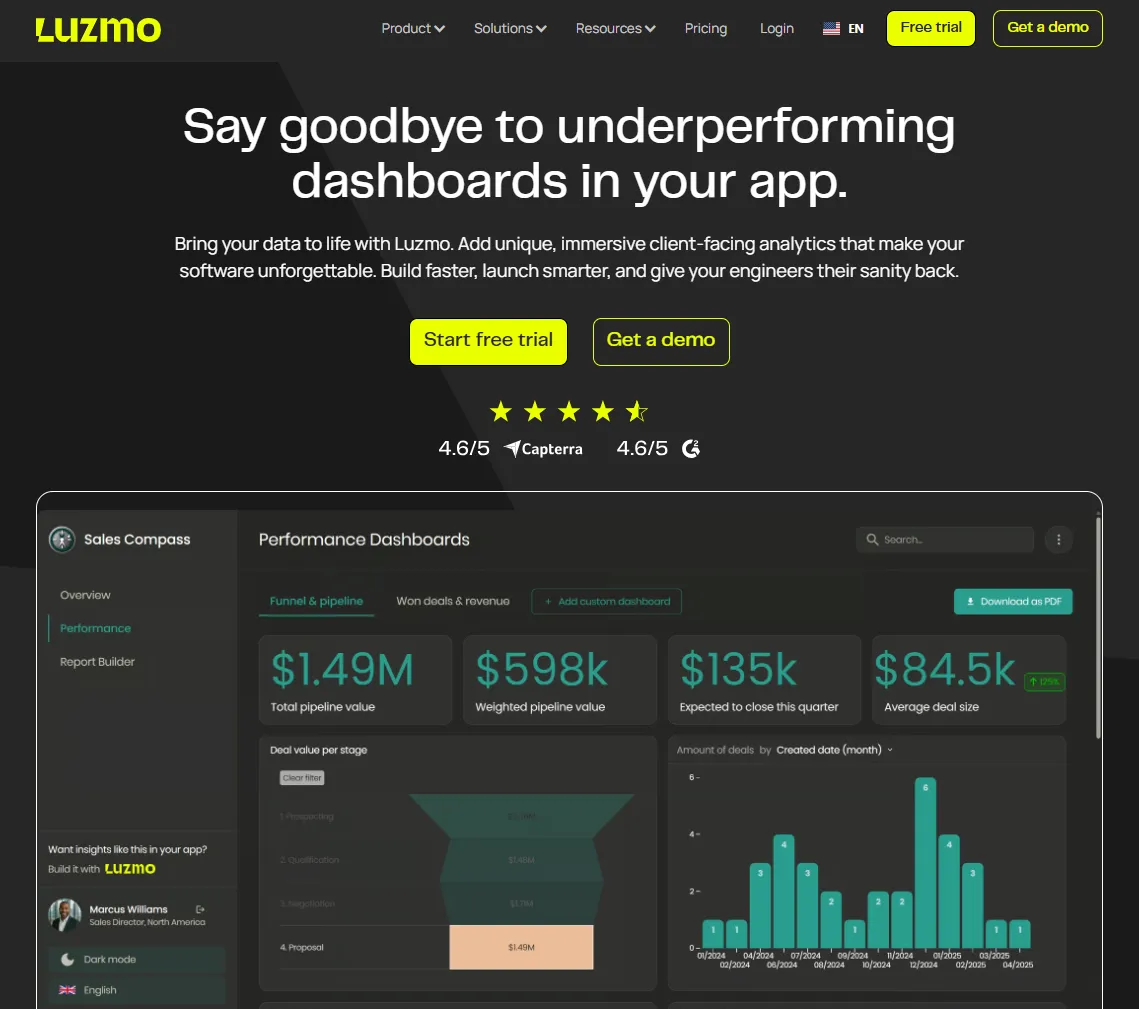
If both ThoughtSpot and Tableau seem complex, expensive or not suited to your embedded analytics strategy, Luzmo offers a compelling alternative. Built specifically for SaaS applications, Luzmo combines ease of use with powerful APIs.
Luzmo IQ allows you to ask questions in plain language and get instant answers with charts. It provides an embeddable chat widget, AI‑generated executive summaries and search results, and even a workflows API for connecting to tools like Slack. This helps business users type questions in plain English and get immediate insights.
Luzmo Studio is a drag-and-drop dashboard builder with over 40 chart types and responsive design. It supports multi‑language, multi‑time‑zone and multi‑currency experiences, and offers row‑level security and caching, making it easy to create a dashboard that scales across tenants.
Luzmo Flex SDK is a code‑first toolkit that lets developers build custom experiences, from report builders to AI‑powered chart generators. It offers a low-code surface for simple tasks and full control when needed.
Agentic APIs provide modular AI building blocks to describe datasets, perform semantic search, generate formulas and visualizations and build conversational agents. You can chain agents together to automate workflows and integrate them into automation platforms.
Because Luzmo is designed for embedded use cases, it emphasises fast integration, white-labelled dashboards and transparent pricing. With Luzmo Studio for dashboard creation, Luzmo IQ for natural-language analytics, and Luzmo AI to automatically generate charts and insights, teams can deliver powerful data experiences without heavy setup. Pricing is built for SaaS scalability — starting at €495/month for Starter and €1,995/month for Premium, with Enterprise plans available — so you avoid the unpredictable consumption or per-user costs of tools like ThoughtSpot or Tableau.
Wrapping up ThoughtSpot vs Tableau
In the rapidly evolving BI landscape, both Tableau and ThoughtSpot are embracing agentic AI and natural language. ThoughtSpot stands out for its AI‑powered search, semantic modeling and new agentic capabilities. Tableau remains the leader in data visualization and now brings agentic analytics to its platform.
Both integrate with major data warehouses and support both code‑first and self‑service workflows. Yet, each has its trade‑offs - ThoughtSpot’s consumption pricing and limited visuals versus Tableau’s higher licence costs and still‑emerging AI features.
When deciding between these two tools on the market, consider the skill set of your data team, whether your users prefer chat‑style interactions or drag‑and‑drop dashboards, and your appetite for usage‑based pricing. Don’t forget to explore alternatives like Power BI and Qlik if you need different trade‑offs.
And if you need a complete intelligence platform that combines ease of use, flexible embedding and AI capabilities, give Luzmo a try. With Luzmo’s IQ, Studio, Flex and Agentic APIs, you can deliver self‑service analytics and embed dashboards within days, no matter the size of your dataset or the complexity of your data. Jump on a free call with us now to discuss your needs.
FAQ
All your questions answered.
What is the main difference between ThoughtSpot and Tableau?
The main difference lies in their approach to analytics. ThoughtSpot focuses on AI-driven search and natural-language queries, allowing users to ask questions about their data and get instant insights. Tableau, on the other hand, is known for its powerful data visualization capabilities and drag-and-drop dashboard builder, making it ideal for exploring and presenting data visually.
Which tool is better for embedded analytics?
Both ThoughtSpot and Tableau offer embedded analytics options through APIs and SDKs that allow dashboards to be integrated into web applications. However, implementation complexity and pricing models differ. ThoughtSpot uses a consumption-based model tied to queries, while Tableau typically relies on per-user licensing, which can make budgeting easier depending on the use case.
When should companies consider alternatives to ThoughtSpot or Tableau?
Organizations may consider alternatives if they need simpler embedding, faster implementation, or more predictable pricing. Some embedded analytics platforms are designed specifically for SaaS products and focus on white-label dashboards, flexible APIs, and faster deployment compared to traditional BI platforms.
Written by

Ship the future of your data
Let us show you what Luzmo can do for your product.

Leave your e-mail and one of our analytics experts will reach out to you