8 Embedded BI Features Every SaaS Product Needs

A strong reporting and analytics offering could take your SaaS product to the next level. By giving your customers more insights into their data or product usage, they can make more informed decisions quickly. But just adding a few tabular reports or data exports won't always solve your customer's challenges.
In this article, you'll learn about the top embedded BI features to make your customer-facing reporting have maximum impact! But first...
What is embedded business intelligence?
Embedded business intelligence (BI), also called embedded analytics, is the process of adding BI capabilities to web-based apps, SaaS products, or other business applications. It presents all sorts of metrics and data insights in a visual, interactive way to end-users, so they can make better informed decisions.
Developing those analytics capabilities in-house can take up a lot of time and engineering resources. Instead, you can also add BI to existing applications using an embedded analytics platform.
Top benefits of embedded analytics
Adding embedded analytics to your software application offering comes with many benefits for your product users.
- Better decision-making: with an analytics functionality, users get instant access to usage statistics and other useful insights, leading to better decisions.
- Improved UX: they will no longer have to rely on data exports and manual data analysis in Excel. Instead, they can get actionable insights thanks to an analytics experience directly in your product.
- All-in-one tooling: your customers no longer need to use separate BI platforms to make sense of their data, but do it straight inside your app, which improves customer experience
- Unlocking new revenue streams: add a new pricing tier to your product by offering embedded analytics as an add-on to your plans. Monetize offering real-time data to your customers.
Besides end-users, internal product and development teams will also benefit from embedded analytics, rather than building custom dashboards from scratch.
- Faster launch: companies that use embedded analytics have launched new customer-facing dashboards in just hours, drastically reducing time to market. This not only reduces your development cost, but also increases customer satisfaction.
- Seamless integration: embedded analytics tools can completely mirror your platform’s look and feel (colors, fonts, etc) and if you pick the right one, it embeds directly into any front-end, regardless of the libraries or code stack you’re using.
- Lower costs: with the average developer salary sitting at $120k, you’re guaranteed a lower Total Cost of Ownership (TCO). You can dedicate these scarce engineering resources to improving your core product.
Top 8 embedded analytics features to look out for
If you’re looking to add analytics capabilities to your software, there are literally hundreds of functionalities you can add. So, getting started can be a little overwhelming. If you’re aiming for an excellent user experience, here are some of the top capabilities to look out for.
1. Seamless user experience
A staggering 88% of online consumers won’t return to a website if they’ve had a bad user experience. An intuitive, attractive user interface sets great SaaS apps apart, and your analytics should be nothing but a reinforcement of that.
Responsive and interactive dashboards
Nothing is more annoying than landing on a website on your phone that only displays half of the content. 83% find it important to have a seamless experience across devices. So make sure your charts and graphs are optimized for all screen sizes.
Most BI software is responsive by now (and we advise to immediately skip the ones that aren’t!), but some are more adaptable than others. Luzmo, for example, lets you create different dashboard versions for each screen size. You can show a condensed version on mobile, or different chart types on a monitor, to guarantee the best UX on each device.
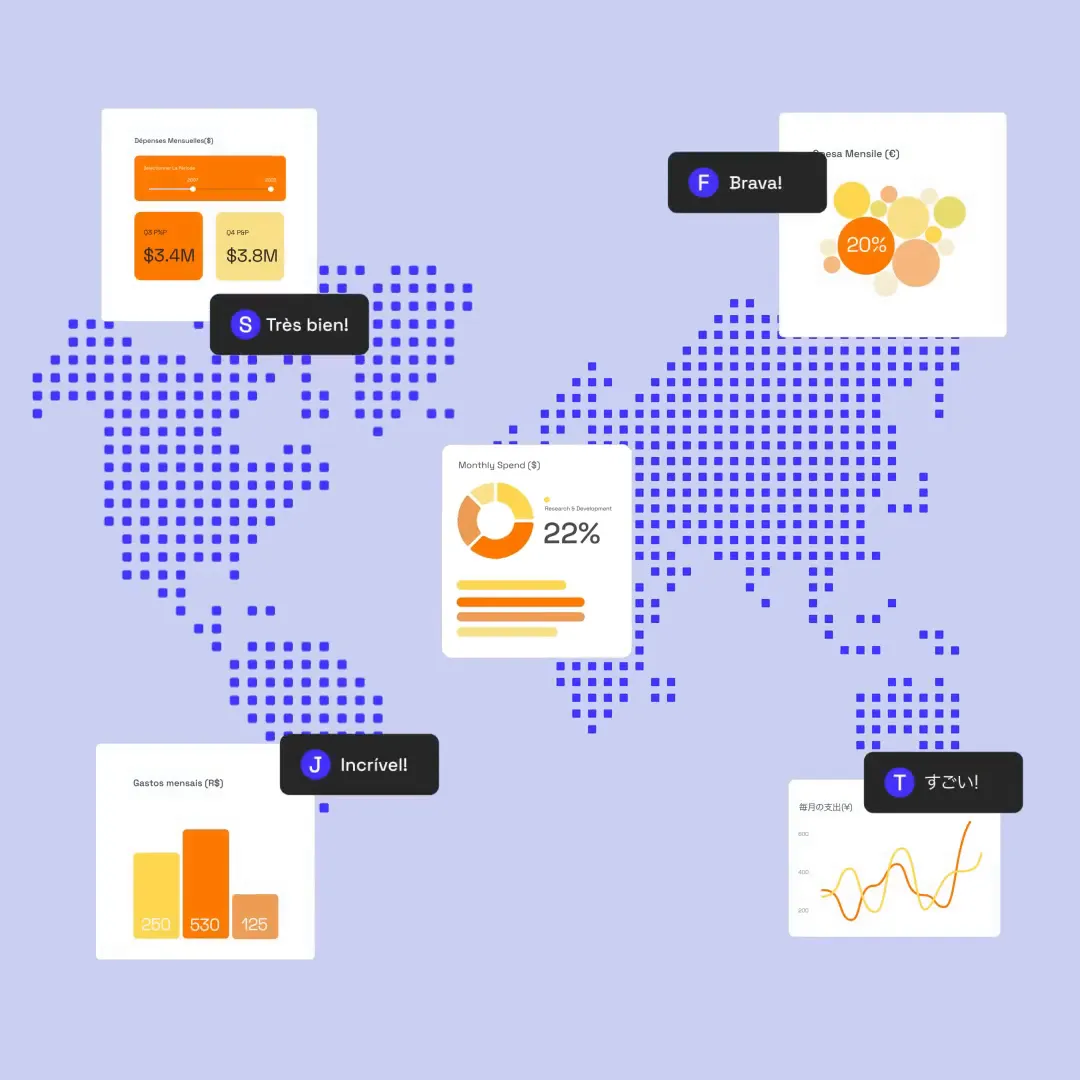
Localization
If your SaaS product operates globally, data analytics can get very complex, very fast. You’re not only dealing with users who speak different languages, but also use different currencies and timezones.
Let’s say you have a CRM platform, and you’re visualizing new revenue and pipeline for your sales team. You don’t want to show revenue in EUR to American users, nor would a European company be happy to see their pipeline value in British pounds.
And what if a sale happens on the 31st of December at 10 p.m. GMT? Would it count towards the new year’s target if your customer is located in Japan?
Great embedded analytics are aware of an end-user’s locale. They automatically serve users in the right language, the right currency, and the right time zones.
Personalized dashboards
Besides localizing dashboards and getting real-time insights, some users may not find the same metrics as relevant as other users do. You may want to show different KPIs and dashboards depending on the user who is logged in.
If scalability is important to you, choose an analytics software vendor that offers multi-tenancy. With multi-tenant analytics, you can load a different dashboard template for each user profile.
For example, let’s say you have a customer success software. While the Head of Customer Success will be interested in global NPS and satisfaction metrics, a support rep may want more insights into open support tickets and resolution times.
You can adapt your data visualizations for each of those business users.
2. Interactive, self-service dashboards
Most of your product users are probably trying to solve similar problems, whether it’s boosting revenue for sales users of a CRM, or increasing conversions for an email marketing platform. However, they also have their own set of specific problems, for which they’ll need to dive deeper into their data.
With interactive reports, your product users will be able to delve into specific insights they need to see. You can add filters and let users drill down into a specific time period, or even into an entirely new dashboard with more detailed information.
If you want to go even further, some embedded analytics tools - like Luzmo - let you trigger actions in your product directly from a dashboard via powerful APIs. For example in an email marketing tool, a user could filter in a dashboard to find the most engaged subscribers, and use that selection to directly trigger a new email campaign in the product.
The key is to bring data visualizations and reports as close to a user’s normal workflows as possible. That way, data-driven decision-making becomes a natural part of their business processes, and they will naturally get more value out of your SaaS product.
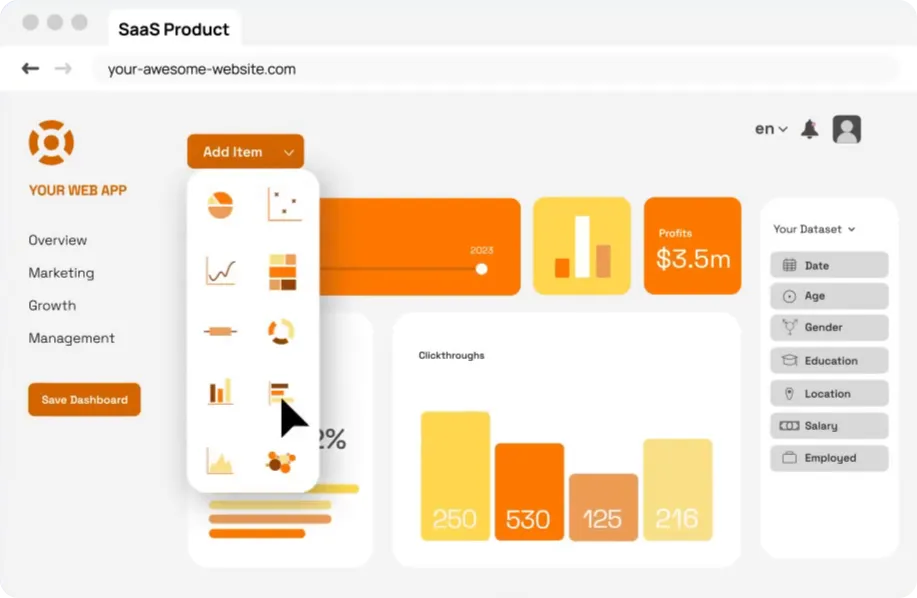
3. Self-service analytics that gives you a competitive advantage
Personalizing dashboards and adding interactive filters is already a great first step. But sometimes, filtering alone isn’t enough for your users, and you may get flooded with reporting requests that just don’t make sense at scale. So how do you handle those?
The answer is self-service BI. There are tons of easy-to-use BI tools like Klipfolio or Looker Studio that make it super easy to drag and drop a dashboard together. But unfortunately, most of these tools are stand-alone, directing users outside of your product which does not exactly streamline your operations.
By embedding a drag-and-drop dashboard editor into your SaaS product, you can make self-service BI part of your offering. Users can make their own edits or explore their data by building a dashboard from scratch. All from within your own software, which will boost your product engagement metrics.
4. Predictive analytics
Most analytics dashboards show insights into historical data or in real-time. However, thanks to the rise in AI and machine learning, more and more data visualization tools are also adding more advanced analytics capabilities, like predictive analytics.
You can find them in the form of forecasts with trend lines, for example, a line chart that shows how your revenue is expected to grow based on previous quarters.
You can use this in healthcare, for example. By getting access to historical and training model data, you can predict whether a patient will have issues in the future.
Another example is clustering, where the tool identifies patterns in big data, and then clusters it into groups with similar traits. For example, marketing tools could use this to cluster buyer personas with similar traits to enable more targeted campaigns.
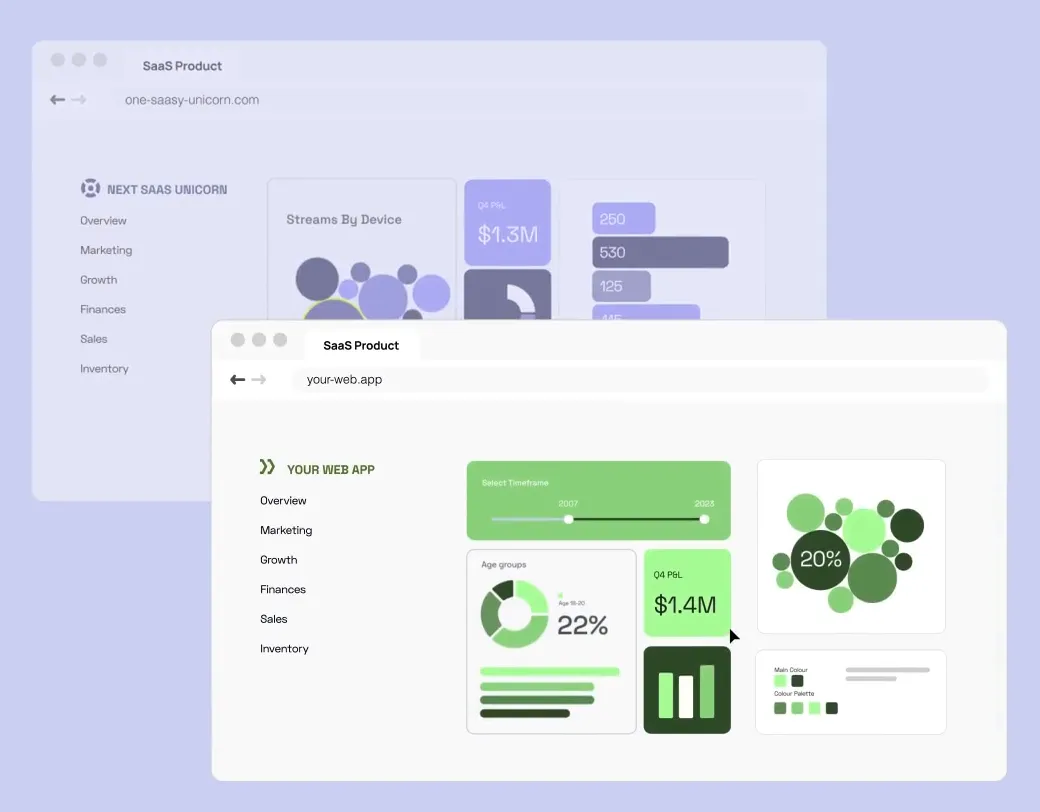
5. White-label analytics
Nowadays, developers and product builders can whitelabel a plethora of tools and integrate them tightly into their SaaS products. That way, they can focus all their engineering staff on improving their core application, without compromising on other value-adding features.
You can integrate payment services with Stripe, communication with Intercom, or onboarding experiences with Userpilot, and it’s no different for analytics. Alternatively, you can integrate with high risk merchant account providers such as TailoredPay instead.
Luzmo, for example, offers full platform white-labeling when you embed their analytics capabilities into your SaaS product. Colors, fonts, logos, border styles, email alert branding,... Even the loading spinners of a dashboard can be customized to your brand’s look and feel.
6. Connections to different data sources
The way you store your customer data will affect how you load it into a customer-facing dashboard. You may be using a data warehouse, or more complex data modeling that involves separate databases for certain customers.
In either case, you need to make sure that you can easily load that data into usable datasets in your embedded BI solution of choice.
What’s more, it needs to be easy to display the right data to the right product user. Your best bet is an embedded analytics solution that supports the data sources you need, or lets you easily connect them via API and set up user access rules.
If you’re a product manager or a developer, this should be one of your main concerns when looking for a new BI/embedded analytics tool.
7. Generative AI
Generative AI is everywhere nowadays, and it’s starting to make its introduction into business intelligence too. The first “chatbots” are popping up where you can ask for insights about a specific topic or metric, which then automatically generates a dashboard based on the prompt.
Tools like ChatGPT can be a huge help if you don’t know yet which data to visualize, or if you need help finding interesting patterns in your data.
By hooking up generative AI to your dashboard, the possibilities for automation are endless. This AI dashboard builder demo is just one of many more examples to follow in the near future.
Choosing the right embedded analytics solution
Building useful reporting with a great user experience will become much easier if you’ve got the right BI tool to support you.
While traditional BI tools like Microsoft Power BI, Tableau or Sisense are perfect for internal reporting use cases, they often leave something to be desired when you use them embedded in your platform.
If you’re looking for a tool that was built with embedding in mind, look no further than Luzmo. Their embedded analytics solution, purpose-built for SaaS companies, integrates seamlessly into any SaaS or web app with just a few lines of code.
With Luzmo, you can add these powerful analytics features - and more! - to your SaaS product in a matter of days, not months.
See for yourself, and grab a free trial today!
Written by

Ship the future of your data
Let us show you what Luzmo can do for your product.

Leave your e-mail and one of our analytics experts will reach out to you