Product Release Update – April 2026
Our product team has been moving at a pace we've never hit before, which means we've got a lot to cover this month. A brand new way to embed analytics into your product, an enhanced editor with AI baked in, and more. Let's get into it.
Composable analytics: A new way to build analytics experiences
Embedding analytics into a product usually means one thing: drop in a pre-built component, configure it, and ship it. That works well, and for a lot of teams, it's still exactly the right call.
But we've also heard from a growing number of teams who want to go further. They want an analytics experience that feels like it was built into their product from day one, not embedded into it. Fully on-brand and completely their own.
Composable analytics, powered by the Analytics Component Kit (ACK), opens up that option. It’s a library of embeddable web components that you wire together into your own analytics creation experience.
Think of it like building with Lego: you pick the pieces you need, arrange them the way you want, and end up with something that's entirely yours.
The components inherit your CSS variables automatically, so they look native to your product with basically zero styling work. And they run on the same embed token auth and tenant-safe data access you're already using. No new infrastructure to wrangle.
Why this matters right now
AI coding tools are collapsing the cost of building custom UIs. More product teams want to compose their own analytics experience rather than settle for a pre-built embedded editor. But they still need the parts that AI can't vibe-code in an afternoon: a query engine, a data acceleration layer, tenant-safe authorization, a chart renderer that actually works. ACK gives you full control over your UX, with Luzmo handling the hard infrastructure underneath.
Ready to dig in?
Start with the Composable Analytics landing page, browse the examples library to see what you could build, jump into the dev docs, or see a step-by-step guide for building your own dashboard studio.
ACK launches with 10 components and is available as an add-on module. Talk to your Customer Success Manager or drop us an email at hello@luzmo.com to get started.
Luzmo Studio, rebuilt with AI
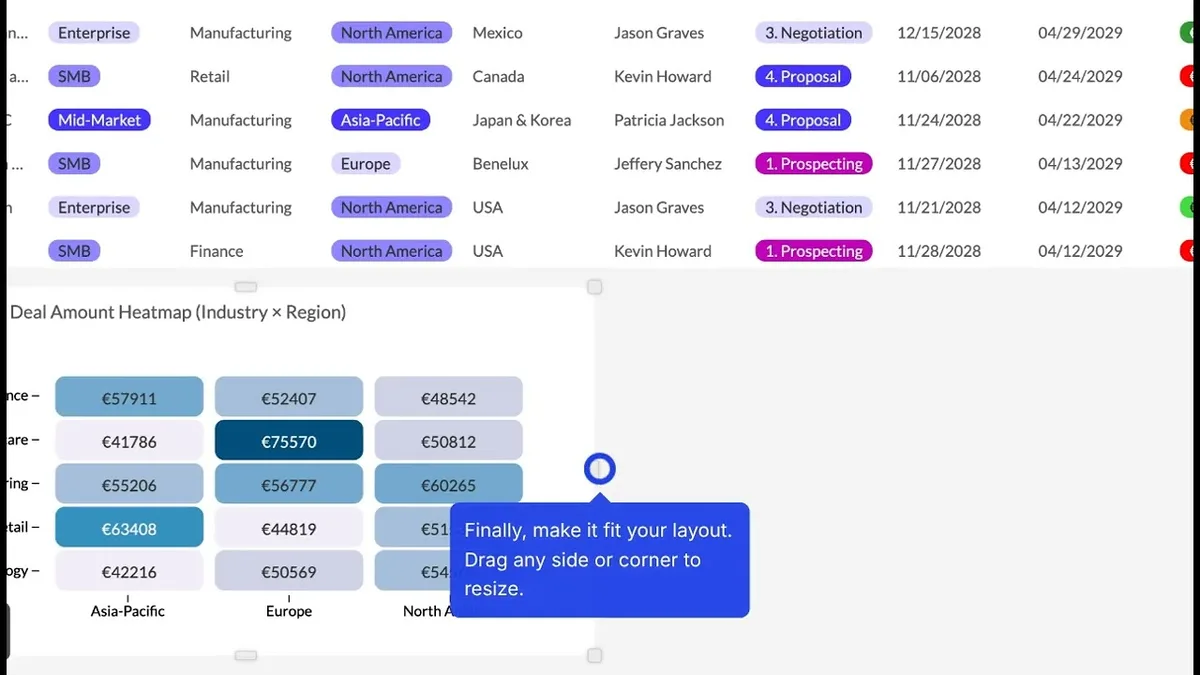
We gave Luzmo Studio, our dashboard editor, a full refresh. More breathing room, a cleaner layout, easier to navigate. But the UI cleanup is honestly the secondary story here. The bigger news is that AI-powered chart creation and editing is now built right into it.
Instead of selecting a chart type, dragging fields into slots, and fiddling with display options, you just describe what you want to see. Luzmo builds it automatically. You refine it in the same conversation. No starting over, no re-configuring from scratch. It also shows you exactly what it's doing at each step, so there's no black-box weirdness.
This is a meaningful unlock for business users too. You don't need to know what a "measure slot" is to get to a useful visualization anymore. Just describe the insight you're after, and iterate from there. See how it works →
Luzmo IQ V3
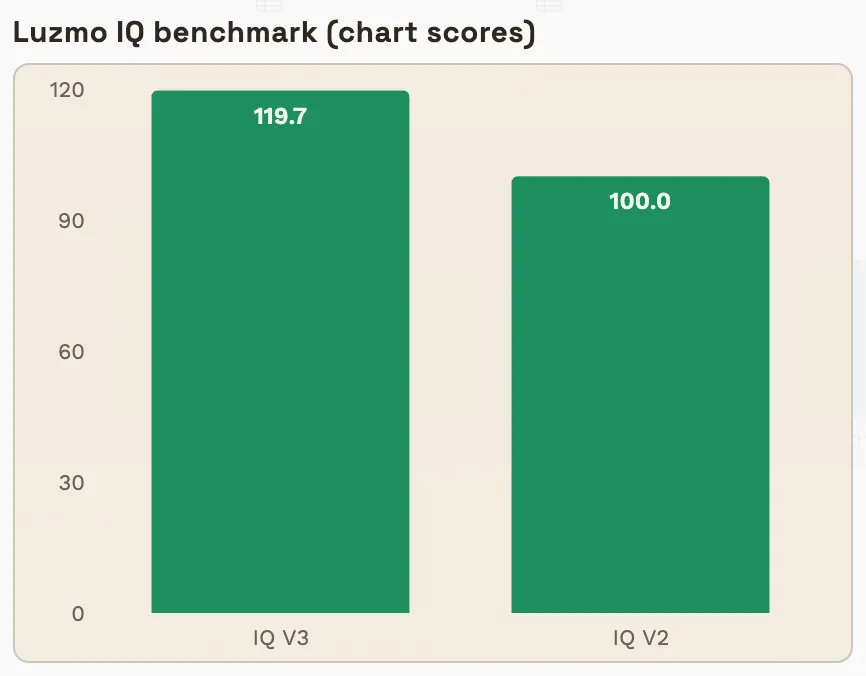
Luzmo IQ just got a significant upgrade under the hood. V3 delivers meaningfully better answers: text responses are 7% more accurate, and chart answers are 20% more accurate. Nested filters now work in queries, and text answers are formatted in Markdown for cleaner, more readable output.
The bigger change is architectural. We moved from a purely agentic approach (giving the LLM everything and letting it figure things out) to a hybrid workflow model that guides the LLM through steps we control more tightly. The results are therefore more predictable.
Nested Aggregation Formulas (Beta)
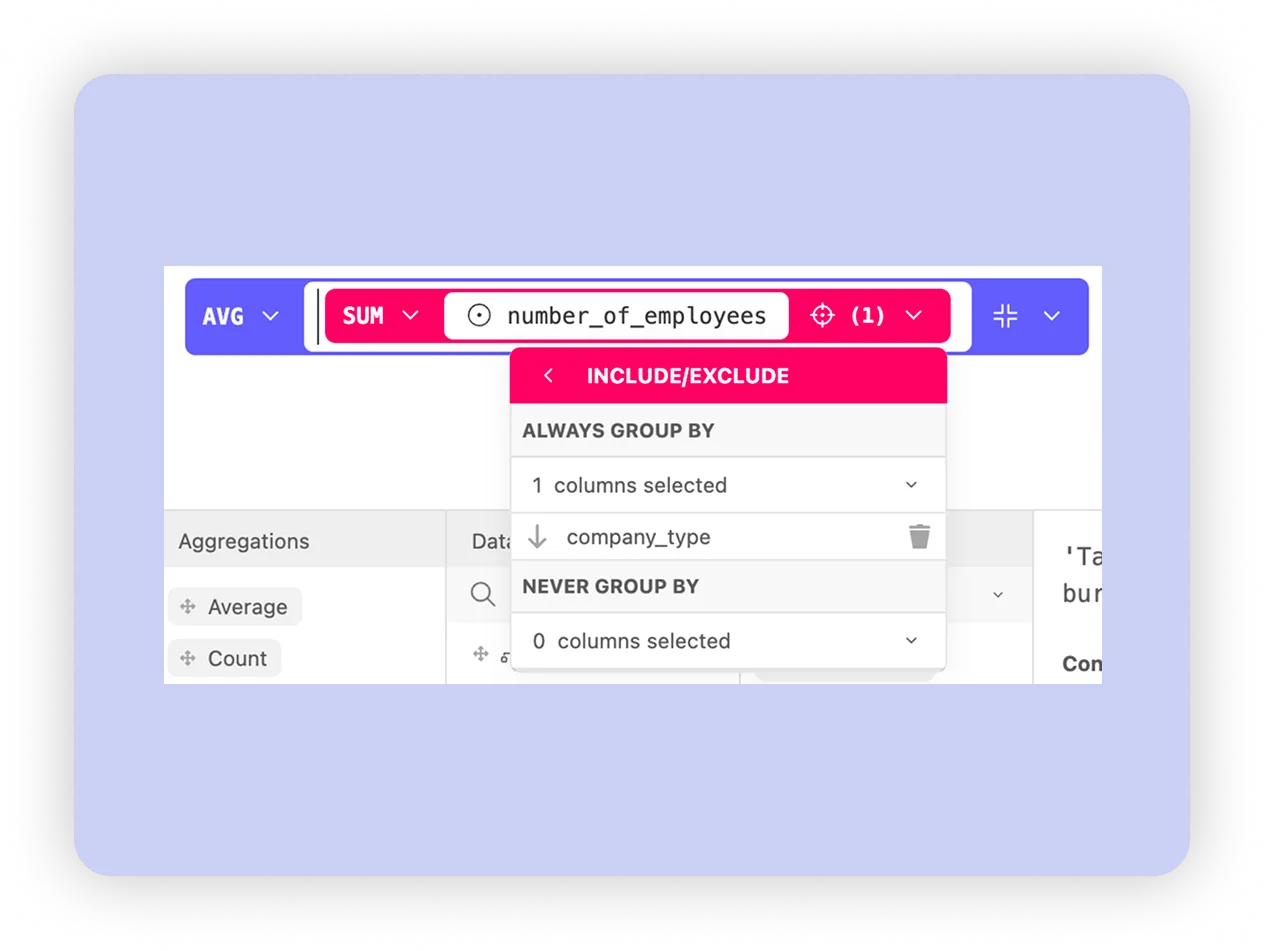
This one's for the analysts. You can now apply an aggregation on top of another aggregation, directly in the formula editor. That might sound niche, but it unlocks a whole class of calculations that have been a bit painful to pull off until now.
The classic example: revenue per employee, calculated correctly across months.
SUM(revenue) / SUM(GROUPINEX(MAX(employee), [month], []))
This first calculates the employee count per month, then sums those monthly counts and divides total revenue by that value, giving you a correct revenue-per-person calculation across the selected period.
Without nested aggregation formulas, this wasn't possible to express directly. It's a pattern that unlocks a lot of other use cases too, especially anywhere you need a dynamic denominator.
This feature is currently in beta on SQL pushdown connectors, including Local Upload and Warp datasets. Reach out to your Customer Success Manager to get access.
Get started with these new features
Ready to put these updates to work? Head to your Luzmo dashboards and start exploring today.
Don’t forget: you can follow along on our product roadmap to see what’s coming next, and submit your own ideas directly to the team.
Questions or feedback?
Our Customer Success team is here for you. Reach out to your CSM or drop us a line at cs@luzmo.com. We’d love to hear how these updates improve your workflows.
Written by

Ship the future of your data
Let us show you what Luzmo can do for your product.

Leave your e-mail and one of our analytics experts will reach out to you