Maps studio
A geographic drill-down dashboard pairing a Luzmo custom chart map with a configurable dashboard for spatial drill-down analysis.
Learn more (opens in new tab)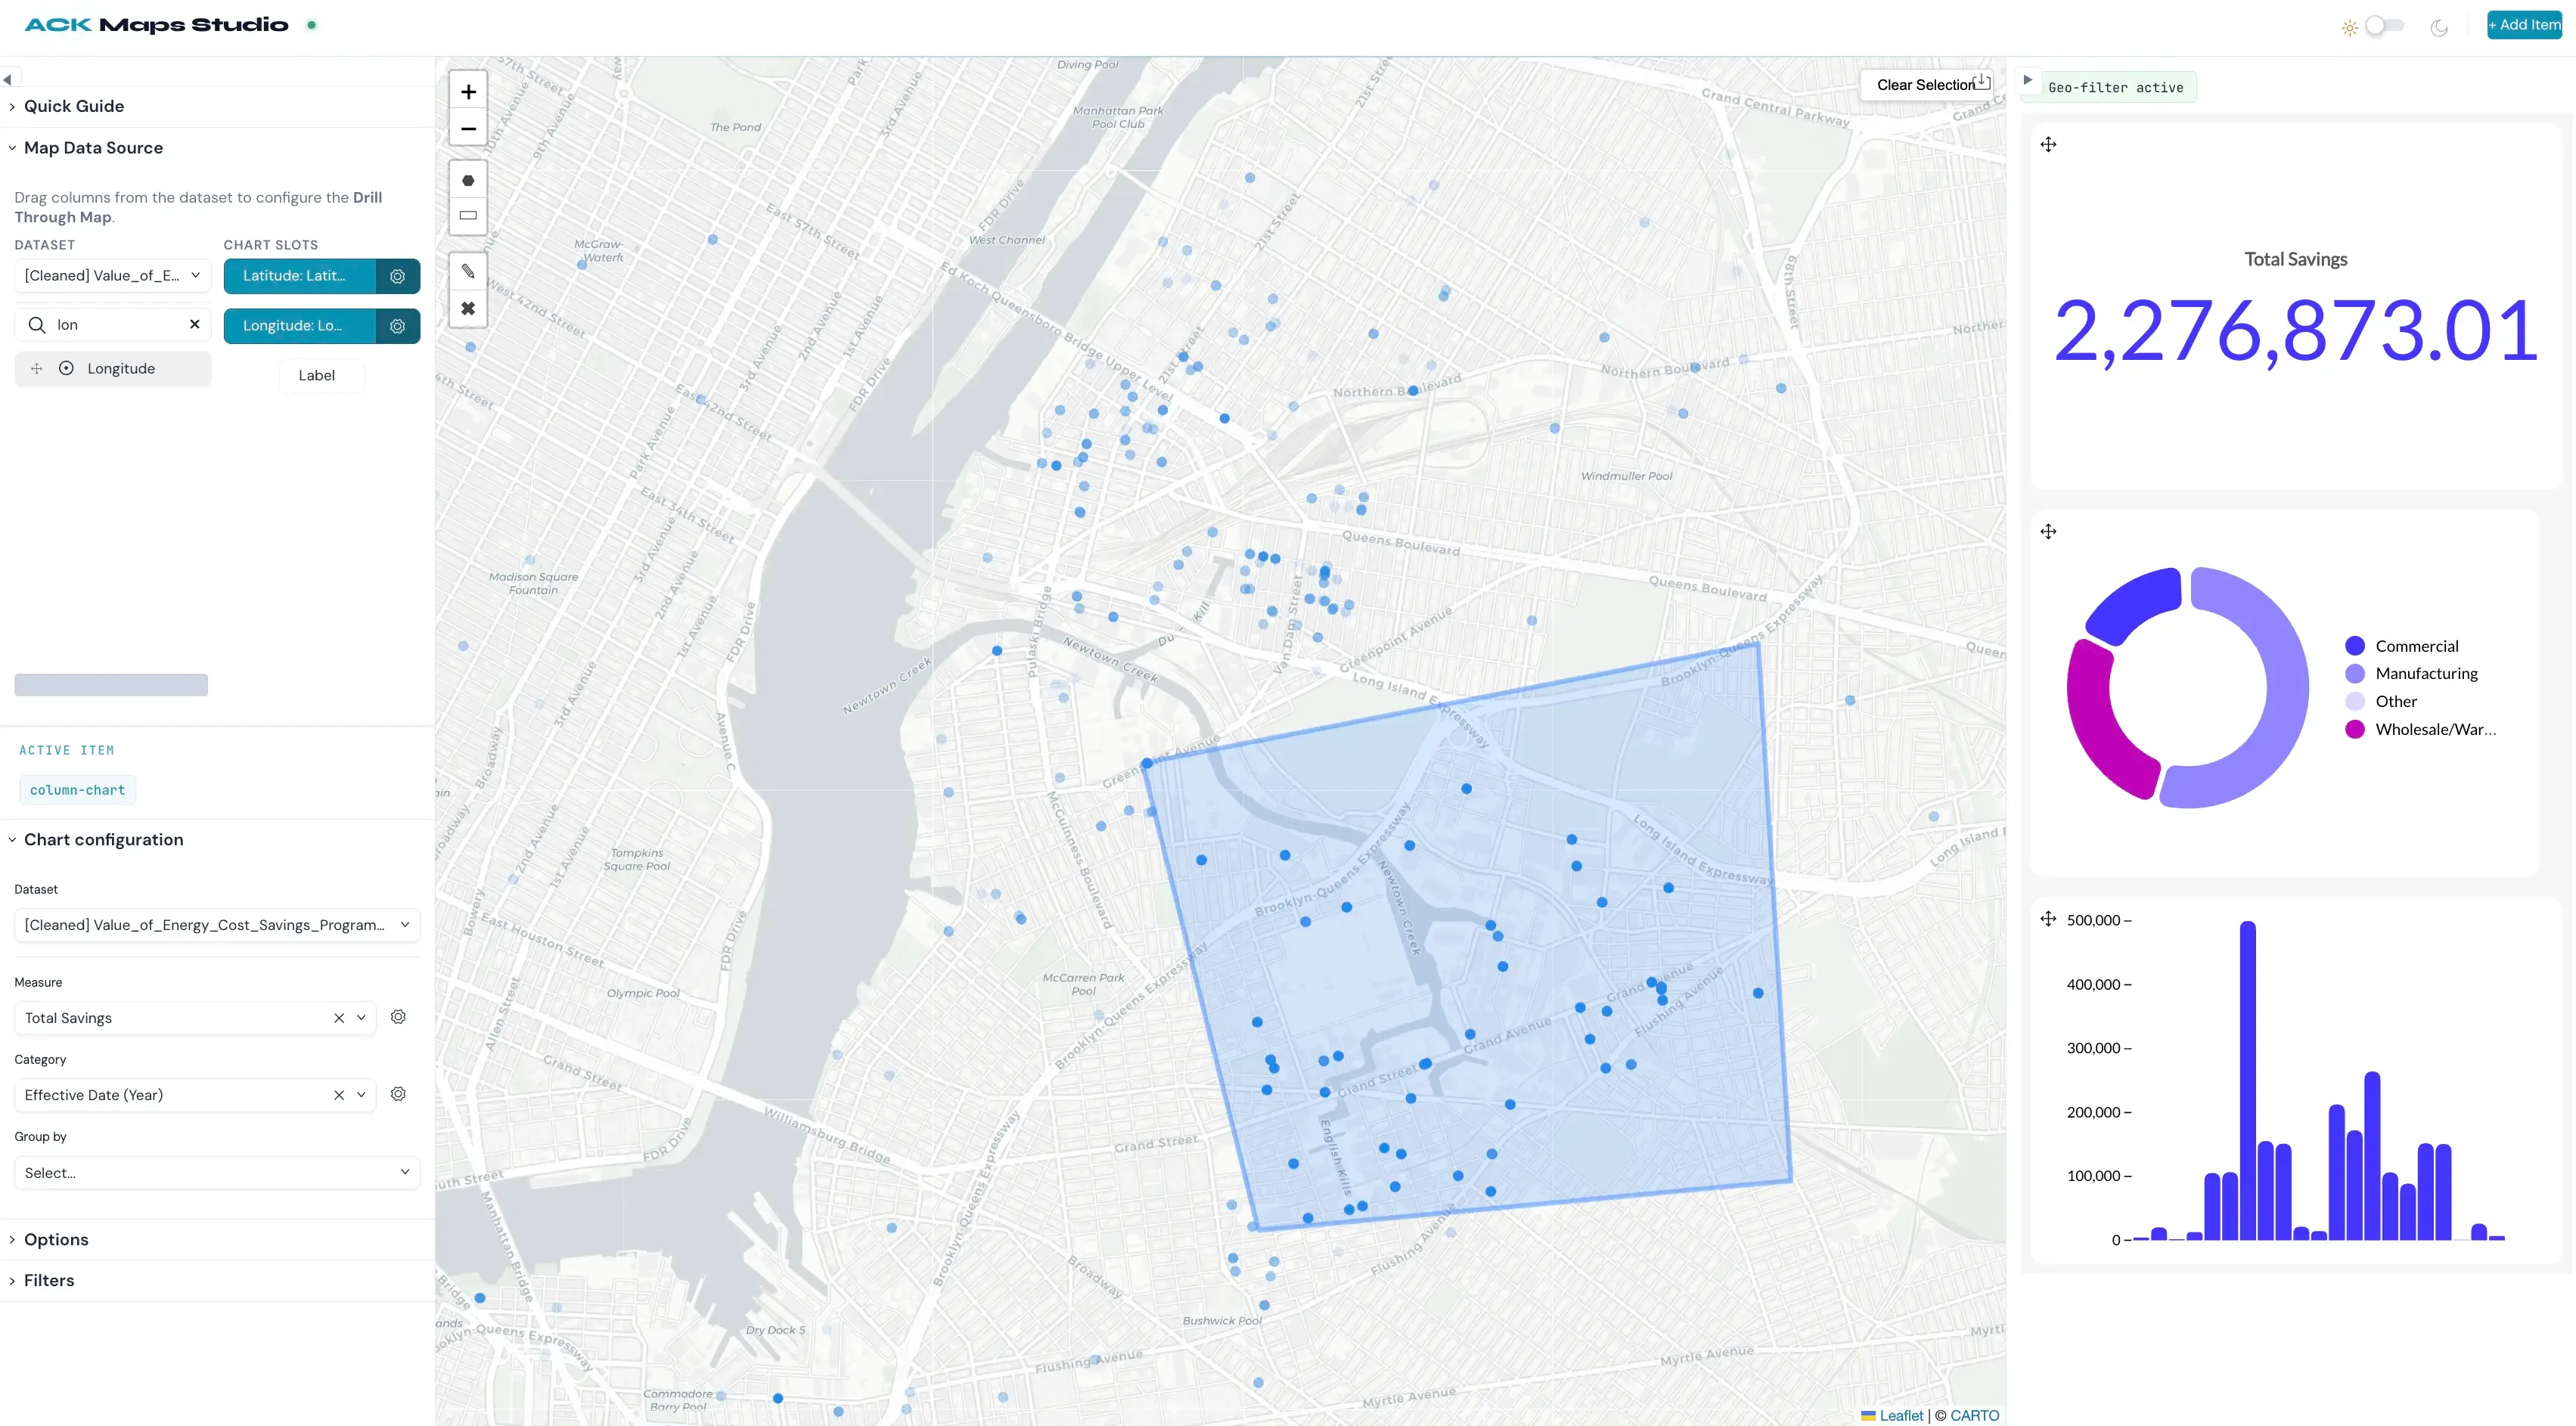
Composable analytics
When a standard dashboard isn't enough, go composable. Your team owns the experience. Luzmo handles the data layer.
“Beautiful, out-of-the-box dashboards that can convince new clients!”

Matthieu Vegreville
Co-founder & COOGreenly
“With Luzmo, we skipped three years of development time and immediately jumped to a full-blown solution.”

Maarten Saeys
CPOLansweeper
“Luzmo's flexibility and ease-of-use were unmatched in any other platform we evaluated. It is so easy and fun to use.”

Cedric Spaas
Product Expert AnalyticsMarigold
Our components handle the heavy lifting of data processing and dynamic visualization. You control the user experience.
1--luzmo-font-family: 'Inter', 'Segoe UI', sans-serif;2--luzmo-font-color: rgb(226, 232, 240);3--luzmo-font-size: 14px;4--luzmo-line-height: 1.5;5--luzmo-background-color: rgb(15, 23, 42);6--luzmo-background-color-highlight: rgb(30, 41, 59);7--luzmo-border-color: rgba(148, 163, 184, 0.35);8--luzmo-border-width: 1px;9--luzmo-border-radius: 12px;10--luzmo-primary: rgb(99, 102, 241);11--luzmo-primary-hover: rgb(129, 140, 248);12--luzmo-positive-color: rgb(34, 197, 94);13--luzmo-negative-color: rgb(239, 68, 68);14--luzmo-animation-duration: 0.2s;See how top product teams are transforming data experience for their users
A geographic drill-down dashboard pairing a Luzmo custom chart map with a configurable dashboard for spatial drill-down analysis.
Learn more (opens in new tab)Analytics for Engineering teams in a cyber-themed command centre: monitor bug queues and PR health, with on-demand chart generation.
Learn more (opens in new tab)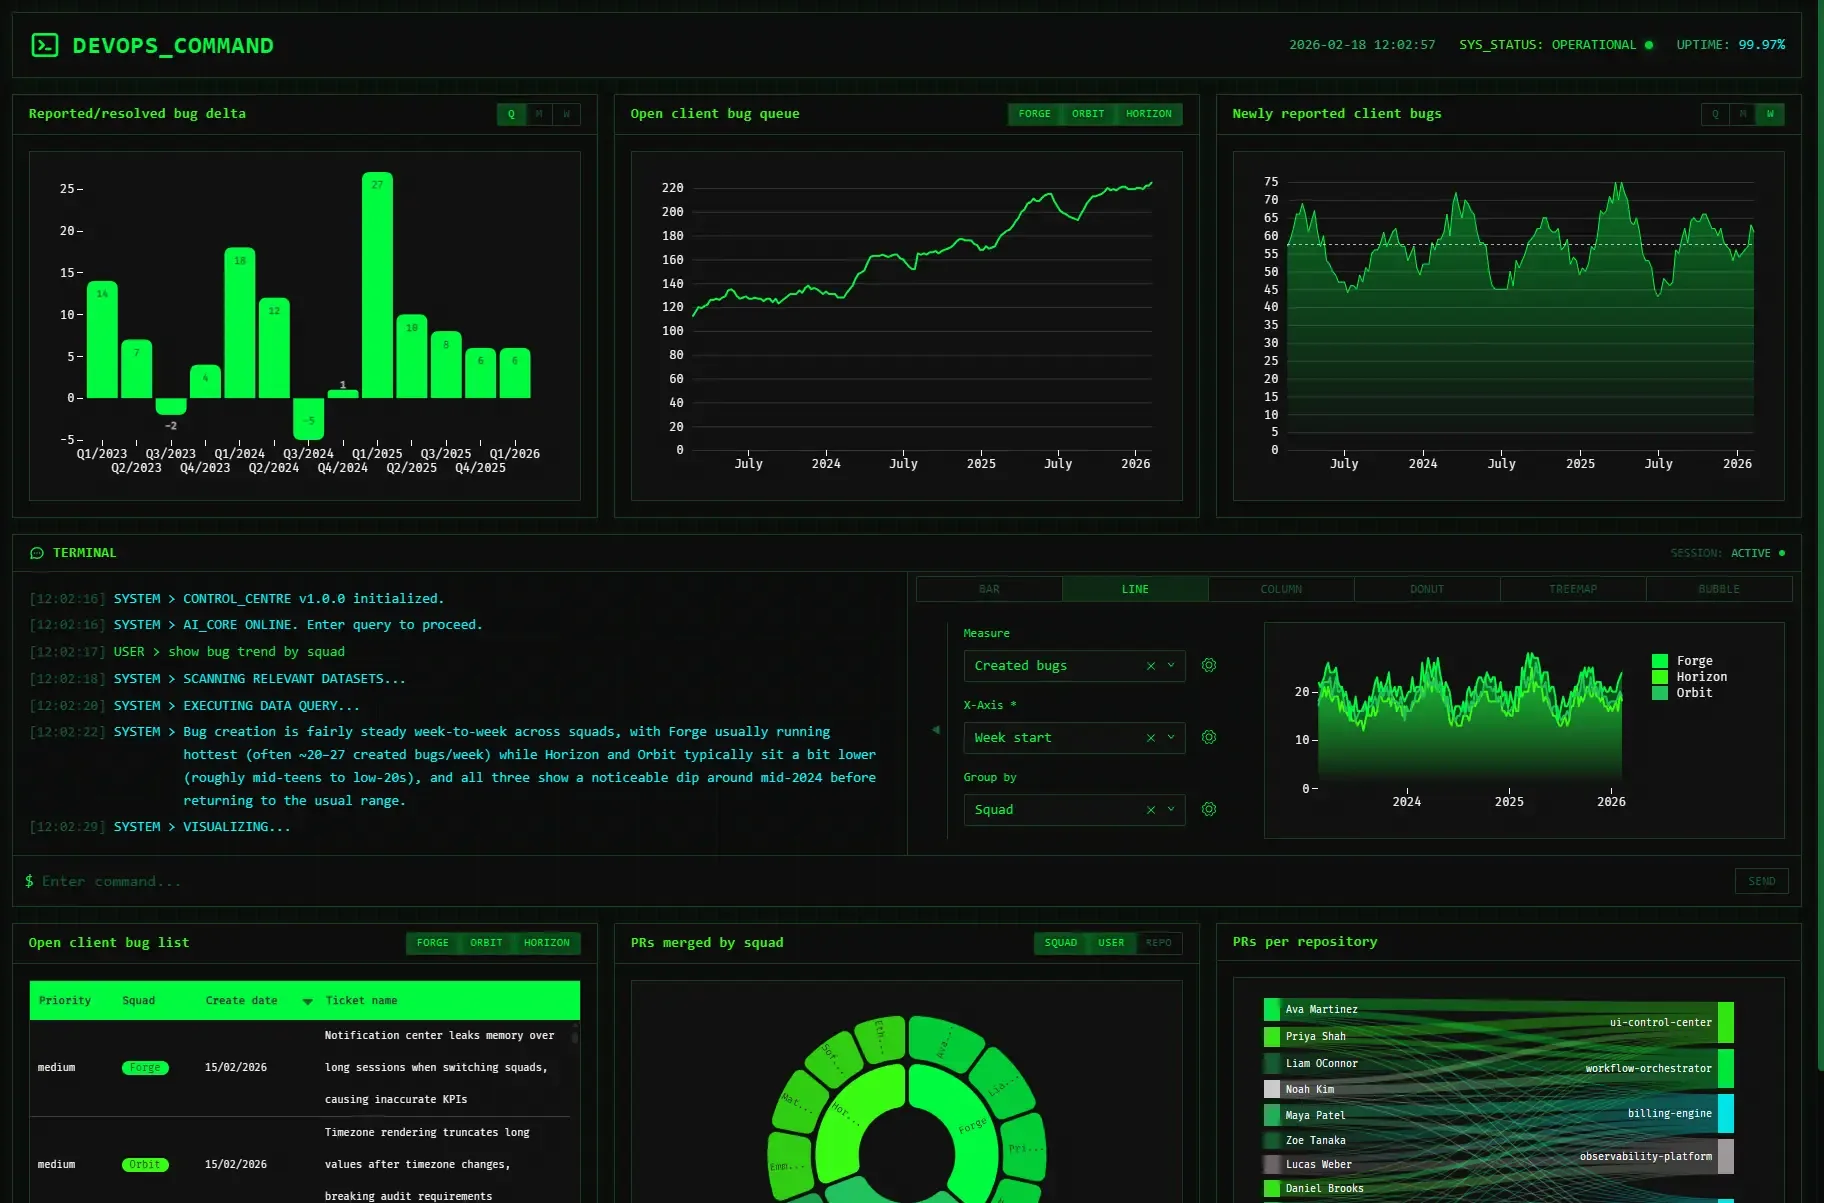
Guide users through building charts and tables from raw data, then compose them into interactive dashboards.
Learn more (opens in new tab)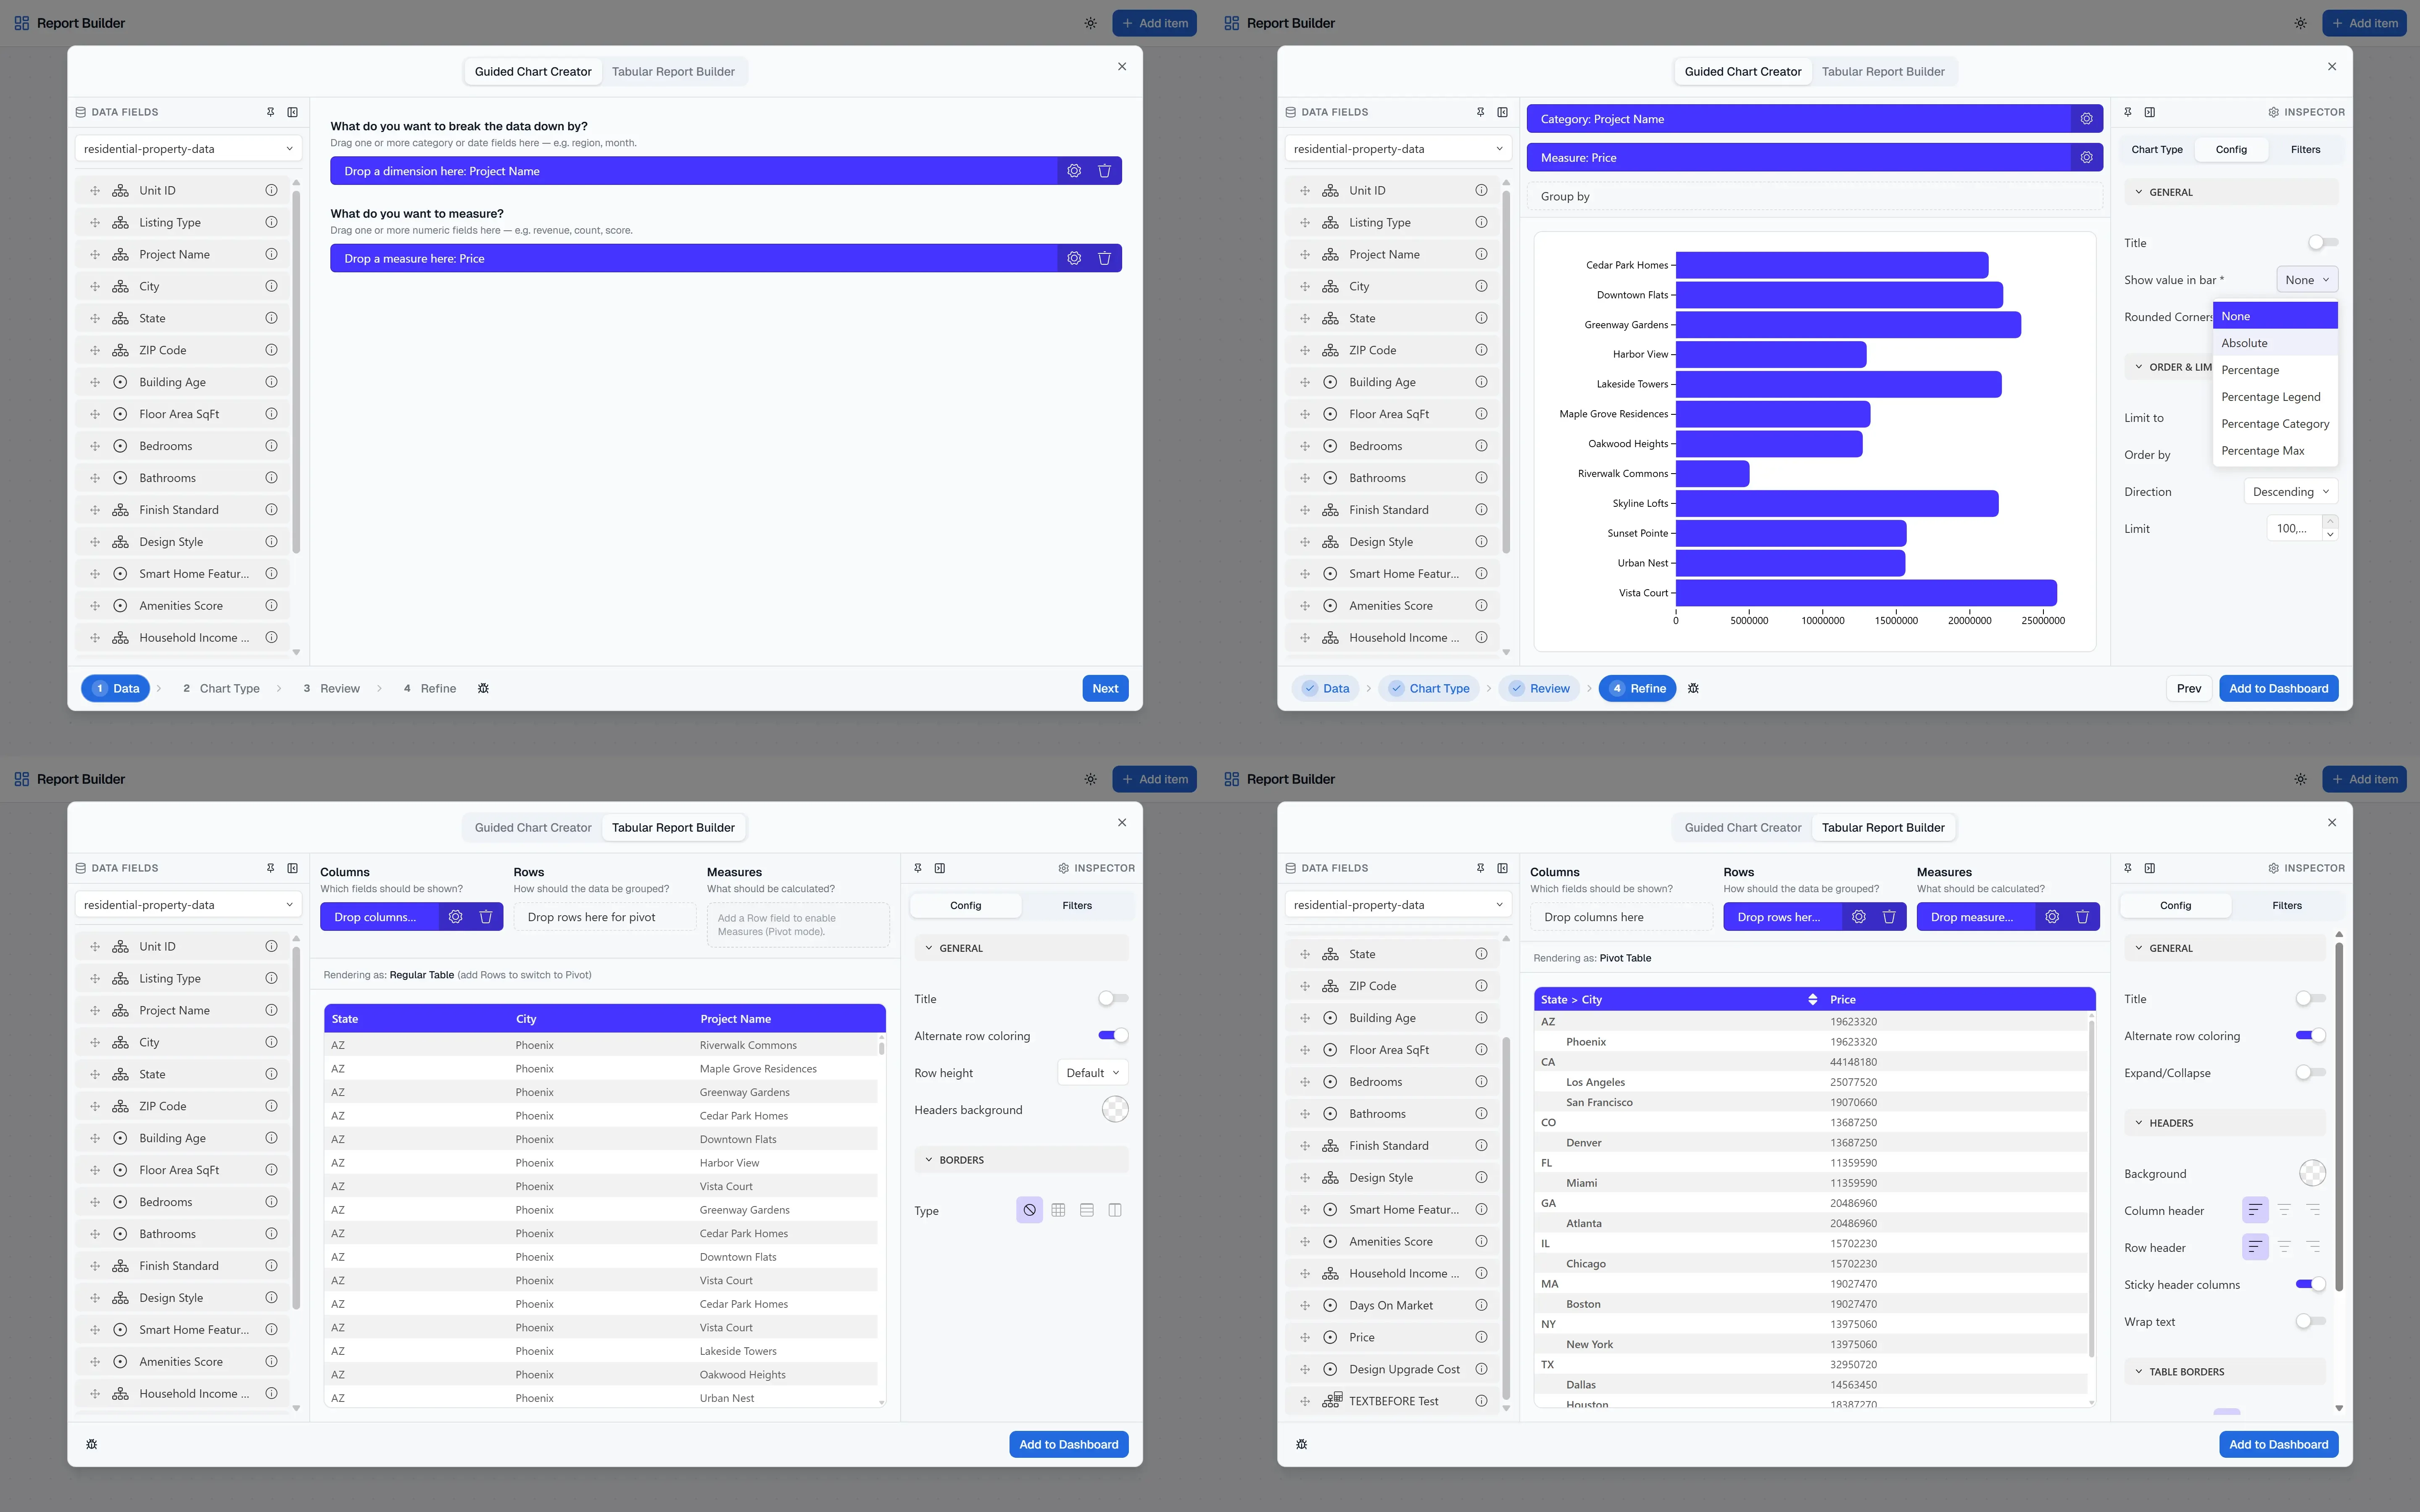
Scenario-driven financial planning dashboard with composable report builder, featuring scenario switching, global filters, and a guided/advanced report composer built on Luzmo ACK and Angular.
Learn more (opens in new tab)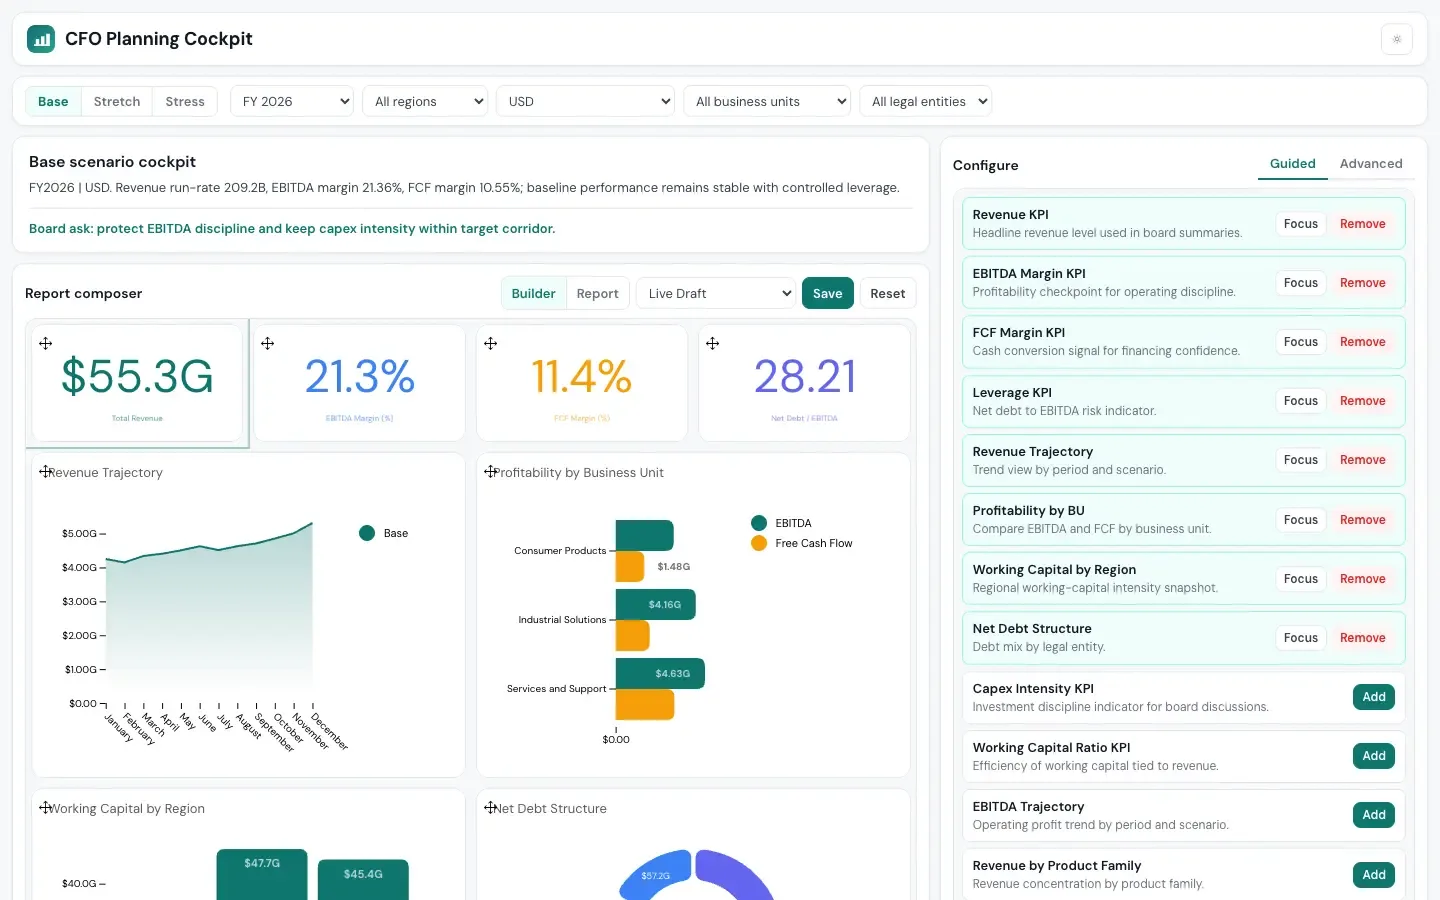
Your roadmap is too important to be stalled by legacy BI. Launch native, self-serve analytics this sprint.

Leave your e-mail and one of our analytics experts will reach out to you