12 Best React Chart Libraries for Data Visualization
Does writing code feel like second nature, but having to create an interactive visualization feels like a chore? Before you resort to leaving development and starting a farm, there is something that can help with data visualization: chart libraries.
If you use React to write code for your app or website, you can use visualizations to show data instead of long and confusing tables. To visualize data in React, you need chart libraries, and today, we’ll show you some of the very best to consider for your next project.
What are React chart libraries?
These are specialized tools and components built to help developers visualize data in React. With pre-built, customizable chart components, they allow dev teams to create interactive charts, graphs, maps, and other visual elements.
Instead of building out the chart functionality from scratch, your developer can simply use one of these libraries to create a variety of chart types in your software or website.
Most of these libraries are open source, which means that they are free and offer a high level of customization in web development.
Top React chart libraries to use in 2025 and beyond
Depending on your visualization needs, the kind of apps you’re building and who the intended audience is, there are many different libraries to choose from. These are our top picks.
Recharts
Best for: creating simple and customizable charts quickly with a focus on ease of use.
If you want a mix of D3.js and React’s capabilities, Recharts is one of the most logical choices out there. This is a composable chart library built on top of React components, renowned for its ease of use and flexibility. It quickly became one of the most popular ways to deliver visualizations in the React ecosystem.
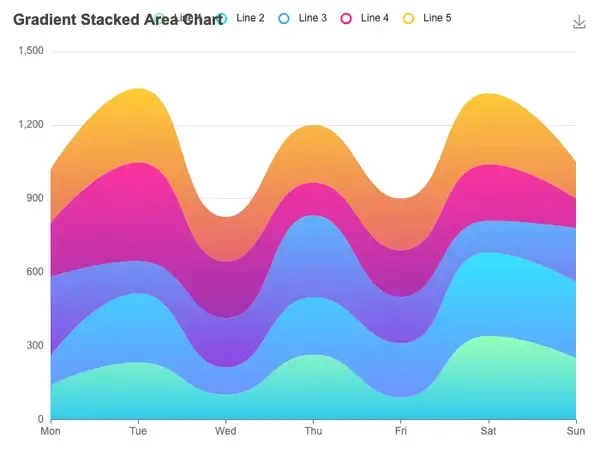
It supports a wide array of visualizations, such as area charts, pie charts, line charts, radar charts, radial bar charts and many others.
August 2025 update:
- Still widely used and actively maintained. It remains one of the most popular React chart libraries, with over 24.8K GitHub stars, 3.6M+ npm downloads, and more than 781K dependent repositories
- SVG-only rendering remains the model. While responsive charts are possible, you must wrap them in components like ResponsiveContainer - they are not responsive by default
- Ease-of-use remains its greatest strength, but it still lacks the flexibility of lower-level libraries and can struggle with very large datasets
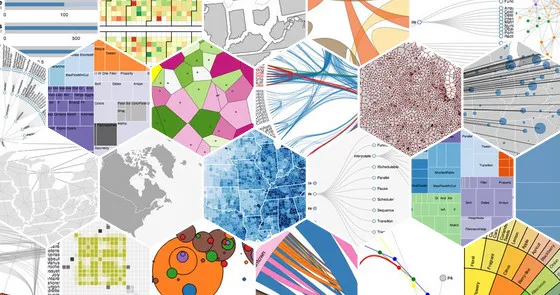
D3.js
Best for: highly customizable and complex visualizations with a steep learning curve.
D3.js is a Javascript chart library that can be used in React and it’s one of the best ways to get interactive and responsive charts in React applications. Created in 2011, it helps developers bind data to a Document Object Model (DOM) and let them apply data-driven transformations to the document.
While it can help make amazing visualizations that look great on the frontend, it has a steep learning curve for some React developers.
August 2025 update:
- Legacy remains firm: D3 is still renowned for giving developers low-level control to build almost any visualization. Its flexibility and power are unmatched, especially for academic, scientific, or highly customized visuals
- However, complexity and steeper learning curve continue to pose challenges, especially for beginners
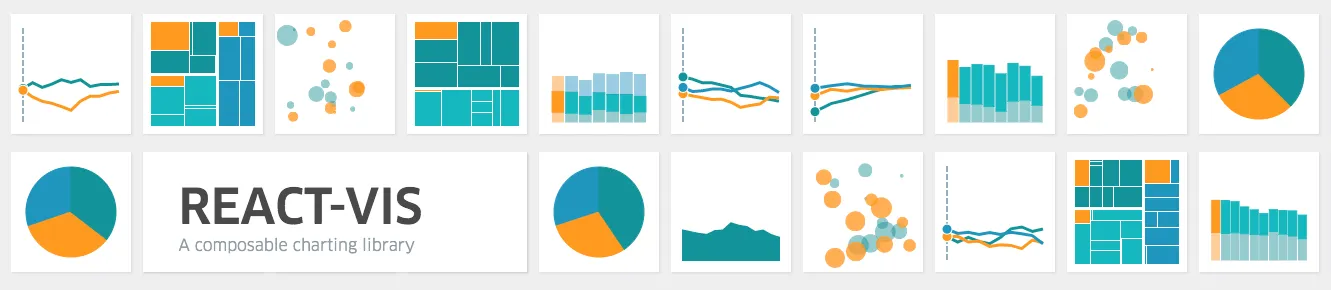
React-vis
Best for: building data visualizations with an easy-to-use API and basic customization options.
React-vis was purposely built by Uber Open Source to help developers build visualizations in React native applications with a simple API. It’s one of the easiest chart libraries to get started with if you want to create custom visualizations and it has support for Canvas and SVG.
Some of the supported chart types include scatter plots, heatmaps, treemaps, radial charts, area charts, line charts and many others.
August 2025 update:
- While stable, React‑vis has faded in recent conversation. It remains usable, but hasn't seen much activity or notable momentum in 2025.
Nivo
Best for: creating complex and responsive charts with extensive customization options.
Nivo was built on top of D3 and offers many different types of chart types in formats such as Canvas, HTML and SVG. If you take a look at Github, you’ll see a blooming community of developers around this chart library. The reasons are many, but primarily, it’s because it’s customizable and responsive out of the box.
In this data visualization library, you can build choropleth maps, radial charts, treemaps, heatmaps, scatter plots and others.
August 2025 update:
- Growing popularity and versatility: Nivo supports SVG, Canvas, and even server-side rendering - ideal for exporting visuals or optimizing chart performance
- Broad range of chart types - from basic line graphs to complex visualizations like chord diagrams, sunbursts, and treemaps
- Frequently praised as “gaining favor” due to its flexibility across use cases
Visx by Airbnb
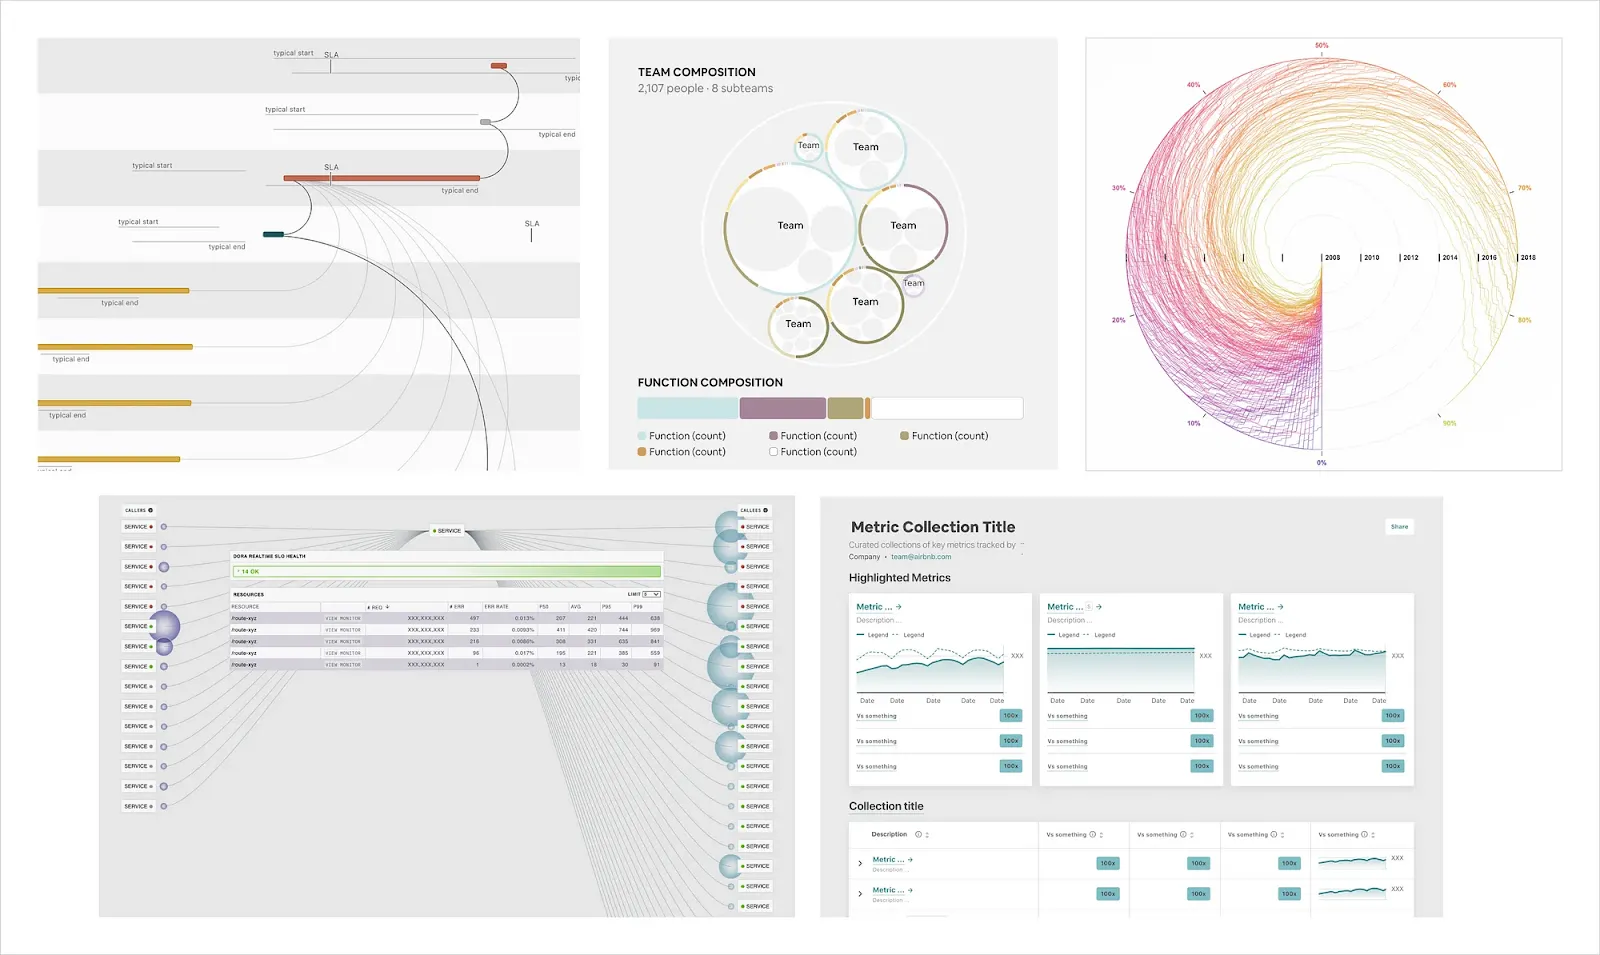
Best for: creating low-level, highly customizable visualizations that leverage the power of D3.
Built by Airbnb on top of D3.js, VisX is built for those developers who seek simplicity in their interactive data visualizations. It supports SVG as a format but not Canvas. The bundle size is small, which helps keep your react project both user-friendly and quick to load for your end users.
You can use it to build line charts, bar charts, pie charts, scatter plots, heatmaps, treemaps and more.
August 2025 update:
- Still highly valued for its low-level primitives and modular control, letting developers build custom visualizations with a smaller bundle size
- Still seen as powerful but with a learning curve, often selected by teams who need precise design control
Chart.js with react-chartjs-2
Best for: simple and responsive charts with good performance and ease of integration.
This is a Javascript chart library at heart, and it’s practically a react wrapper for Chart.js. It’s primarily built for cases with low project requirements, without the need for complex visualizations and ultra responsive design. There is extensive documentation for this library in case your developers get stuck.
Use it to create bubble charts, polar area charts, scatter plots, radar charts and more.
August 2025 update:
- Continues to be a solid choice for quick and responsive Canvas-based charts. Popular for its simplicity and animations, particularly in projects requiring minimal setup
Victory
Best for: creating modular and flexible chart components with a declarative approach.
Victory was built on top of React and D3 and has rich documentation for developers wanting to learn how to create a wide range of chart types without sacrificing on performance. It was developed by Formidable and designed to be flexible and customizable, so you can use it on anything from low-level projects to complex web applications.
It supports pie charts, radar charts, scatter plots, line charts, bar charts and others.
August 2025 update:
- Maintained by Formidable, Victory remains known for its consistent API and declarative approach
- It includes built-in accessibility features and solid documentation
BizCharts
Best for: creating enterprise-level, highly customizable chart solutions with extensive features.
Created by the tech giant Alibaba, BizCharts is a widely used chart library with a large number of npm downloads. It’s mostly used in the Asian part of the world so some documentation may be hard to find, but this library is fairly easy to use. It’s also known for its customization options and the largest number of available chart types among their competitors.
You can use it to build line charts, bar charts, scatter plots, heatmaps, treemaps, and more.
August 2025 update:
- Still relevant, particularly in Asian markets due to its Alibaba origins and extensive chart types
- However, there are no standout updates or surges in popularity noted in 2025 sources
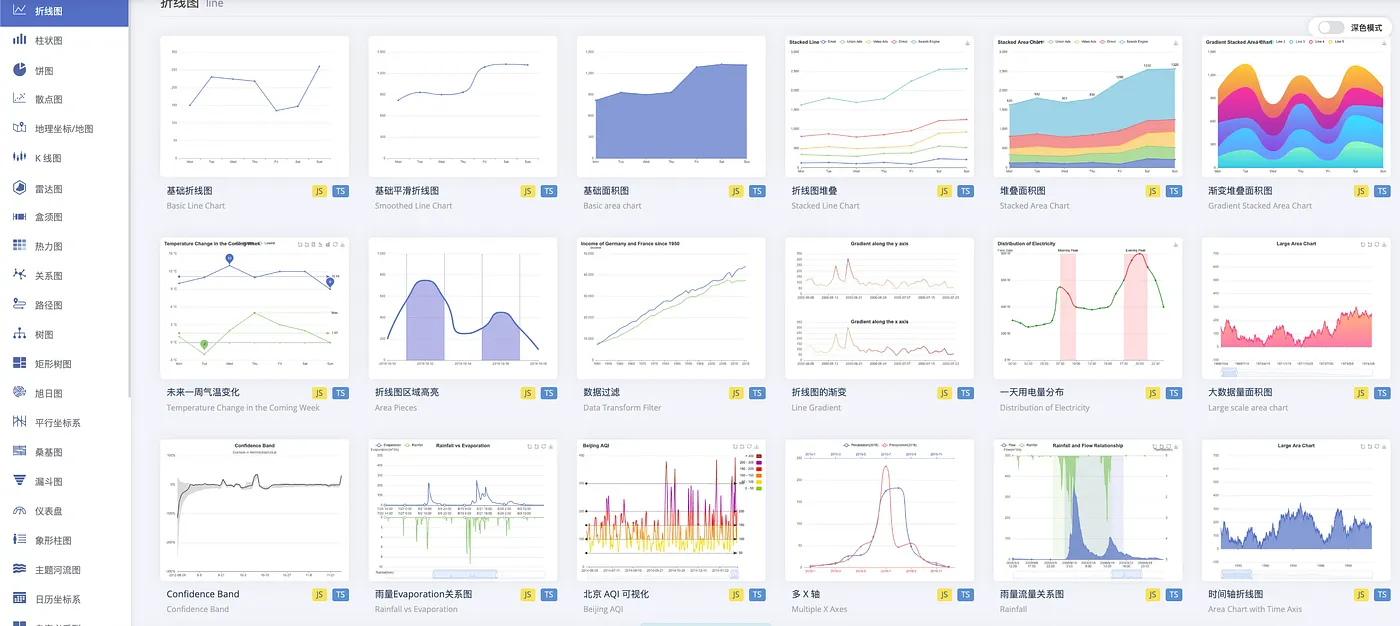
Echarts
Best for: rich and interactive visualizations with strong support for various chart types.
Echarts was built by Apache on top of Zrender. It’s extremely customizable and offers a variety of themes and plugins. It’s highly responsive across devices and has a vibrant community of developers you can tap into if you have any issues.
On top of the usual suspects, you can get visualizations such as Sankey diagrams and heatmaps.
August 2025 update:
- Notably strong performance with large datasets thanks to support for Canvas and WebGL rendering
- It remains an excellent choice for complex, real-time dashboards
- Recognized for both performance and richness in features, but its complexity can be a downside in smaller projects
Rumble charts
Best for: creating simple, lightweight, and responsive charts with minimal configuration.
Looking for something super simple and easy to use? The Rumble chart library is flexible and customizable, built for bare-bones data visualizations. Bear in mind that developers don’t update it as frequently as other libraries on the list and you won’t have a community to get help from if you run against a wall.
It supports all the typical visualization types such as bar charts, radar charts, scatter plots and others.
August 2025 update:
- Gains no mention in 2025 sources and appears to remain niche, lightly maintained, and with limited community engagement
Ant design charts
Best for: highly polished and professional charts that integrate seamlessly with Ant Design.
Optimized for the Ant design framework, Ant design charts is built on top of G2plot and comes with a variety of visualizations out of the box that are ready to use. If you’re already using Ant Design, this is a natural next step for visualizing your data.
Visualization types include bar charts, scatter plots, pie charts and others.
August 2025 update:
- Continues to serve as a polished option that integrates well with Ant Design and G2plot, though its usage numbers (about 2K stars and 61K downloads) remain relatively modest
React-stockcharts
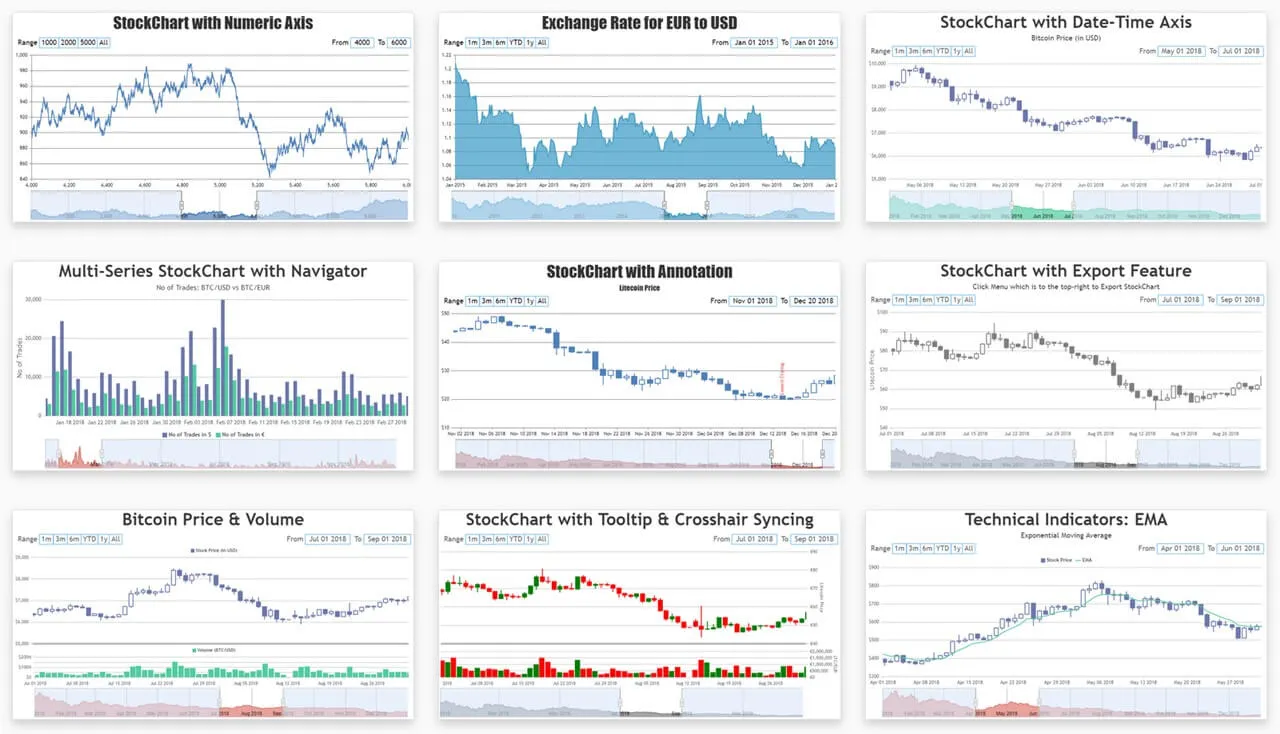
Best for: building financial and stock market charts with comprehensive support for various chart types.
If you want to embed financial charts into a website or an app, React-stockcharts is the best tool for the job. It has two unique advantages. It handles large volumes of data really well so performance is never an issue.
The second is that it supports visualizations popular in this industry, such as candlestick charts, indicators, and OHLC charts.
August 2025 update:
- The original react-stockcharts repository (by rrag) remains available with its last release in August 2025, version v0.1.6, primarily addressing a minor defect fix
- The project is still considered alpha software, with an API that may change, and it hasn't seen recent major enhancements or widespread adoption
- Multiple community forks exist aiming to modernize and update the library’s dependencies, but they currently remain niche and don't indicate a thriving maintenance ecosystem
Why React chart libraries may not be the best choice for visualizing data
You may have the top React talent in the market and feel pretty confident about visualizing big data sets as charts and graphs in your app or website. But is a React chart library really the best tool for the job?
Performance limitations: React’s virtual DOM can be a bottleneck for visualizing complex data sets. If you need to fetch large volumes of data and visualize them in an app, this could take a while. And for use cases such as mobile or web apps, this loss of time can be a deal breaker.
Flexibility and customization: by default, React’s libraries are built with a focus on ease of use and simplicity for developers. The trade-off is that you lose some of the customization capabilities you would get in a dedicated visualization tool.
More importantly, you lose the integration options offered in tools such as Luzmo. You won’t be able to optimize for different types of devices or show dashboards in different languages depending on the user. You also won’t be able to set access data control, which is crucial in SaaS apps.
Dependency overhead: introducing a new React layer can introduce additional dependencies and in turn increase the bundle size of your web applications. Once again, the performance of the app or website suffers.
Lack of advanced features: most React libraries lack features such as and complex interactions. Not even the best developer can avoid these shortcomings of React components.
Use Luzmo instead
Do you want a superior user experience in your software, all the while creating an easy job for your developers? Luzmo lets you visualize data in your app or website with a setup that takes hours, not days or weeks. Your developers can embed dashboards in your product and thanks to our handy API, connect the data sources you and your users need.
Luzmo is fast, intuitive, fully customizable and offers a wide range of interactive visualizations. And the best part is, you can get a free trial and see how it works for your software product.
Written by

Ship the future of your data
Let us show you what Luzmo can do for your product.

Leave your e-mail and one of our analytics experts will reach out to you