What is Interactive Data Visualization? + Examples

Imagine taking a look at a beautiful landscape photograph in a frame, on a wall. Now imagine taking a walk through that landscape and being able to smell the flowers, feel the wind in your hair and listen to the rippling of the creek. That’s the difference between data visualization and interactive data visualization.
On the one hand, you have static visualizations like Excel sheets and infographics. On the other, you have interactive dashboards that the user can play with, explore and research the data on their own terms.
Today, we take a look at interactive data visualizations and why it makes sense for any business to take their visualizations to the next level.
What is interactive data visualization?
Interactive refers to the ability of the user to interact with visualizations such as dashboards. Instead of just having static visualizations that provide data insights, the end user can change them to get more information.
In other words, let’s say you have a real estate dashboard based on various datasets. It shows the properties of a certain company in New York and when they are rented throughout the year, with the use of graphs.
This dashboard becomes interactive when the end user can click on it and get other information, such as:
- Which size properties get rented the most
- What is the least popular month in terms of occupancy
- What the average rent is across properties
- What kind of pricing resonates best with tenants across different parts of the city
- And many other insights
The goal is to give the end-user access to real-time metrics. But even more so, interactive data visualizations let people without a data science background discover new insights.
There are many different types of data visualization, such as pie charts, bar charts, scatter plots, heat maps, line charts, and others, depending on the data sources you’re working with and what you want to show.
Typically, businesses embed interactive data visualizations in their app for their own internal use or for their customers.
Top benefits of interactive data visualization for businesses
Having interactive dashboards and reports can benefit your entire organization. Here is how.
Data storytelling: it’s easier to understand complex data when you can explore it on your own terms. Instead of looking at tables and rows of data for hours on end, the end user can dig into an interactive map to find the data they need faster.
Identifying trends and patterns: with interactive interfaces, you can comb through large data sets in a matter of seconds. This means that even non-technical users can spot trends, patterns, spikes, and outliers.
Customization: visual representations of data are great, but what if your customers have different use cases or needs than what you’re displaying by default? The best data visualization examples are those where the end user can change the visualization according to their needs. The person interacting with the dashboard does not need knowledge of Javascript, Python, D3.js or any other programming language or framework.
Making complex data simpler: having access to real-time data is great, but it can be overwhelming to those with no experience in data analytics. With interactive visualizations, they can hover their cursor over the visualizations to get more information from tooltips or explore data by clicking around.
Easier decision-making: a manager or a CEO can take a deep dive into a visualization to get more insights without reaching out to any of the employees they manage. They can review timelines, trends, and spikes and make important decisions more quickly.
Taking interactive one step further
Allowing your employees and customers to tinker with dashboards and visualizations is a major step forward from static visualizations. But you can go even further than that.
Tools like Luzmo have something called an embedded dashboard editor, a tool that allows any end-user to create their own dashboards based on their readily available data. If you have a tech-savvy audience that needs access to real-time data, this gives them full control over the final output of their visualizations.
Imagine giving someone access to the kind of beautiful visualizations you would get in Tableau, but without the Tableau learning curve. With Luzmo, you can do just that. Plus, you have artificial intelligence and machine learning tools to get insights from data with AI, even faster.
Several components power this analytics experience. Luzmo Studio allows teams to design and manage interactive dashboards through a visual builder, making it easy to embed analytics into SaaS applications. Luzmo IQ helps automatically surface trends and patterns across datasets, while Luzmo AI enables users to ask questions about their data in natural language and instantly generate charts or insights.
Interactive data visualization examples to learn from
Here are some examples of interactive visualizations that you can learn from and copy, all built in our embedded analytics platform.
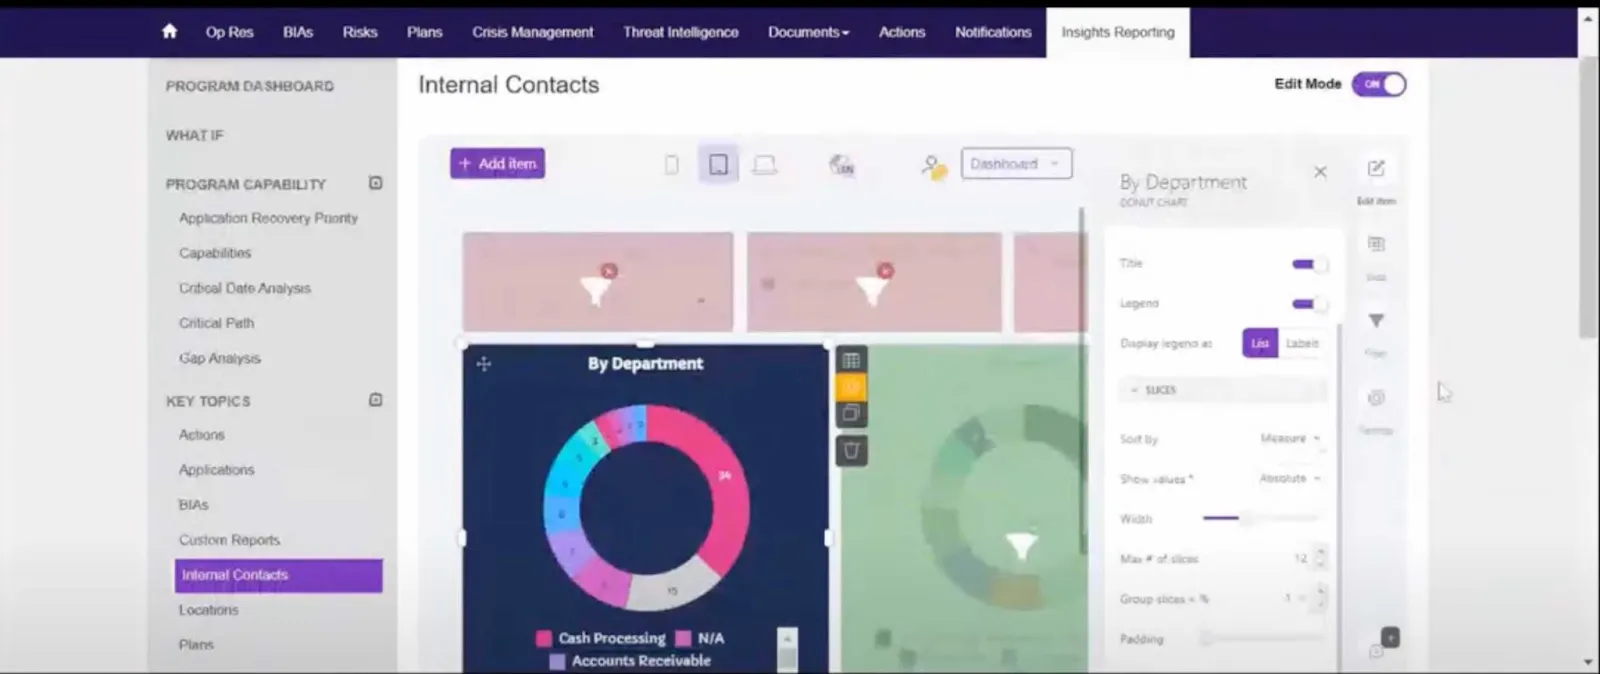
Riskonnect’s self-service dashboards
Riskonnect is a risk and compliance management tool that has unique reporting needs. Their customers kept requesting custom dashboards and over time, this became overly complex and expensive. Instead of building these dashboards for their customers, they created templates that customers can grab and build their own dashboards from scratch.
Selligent marketing cloud - exploring email marketing data
Selligent is a Europe-based marketing automation platform that largely revolves around email marketing. Their customers launch campaigns within Selligent and they wanted to know how they perform in terms of key email marketing metrics.
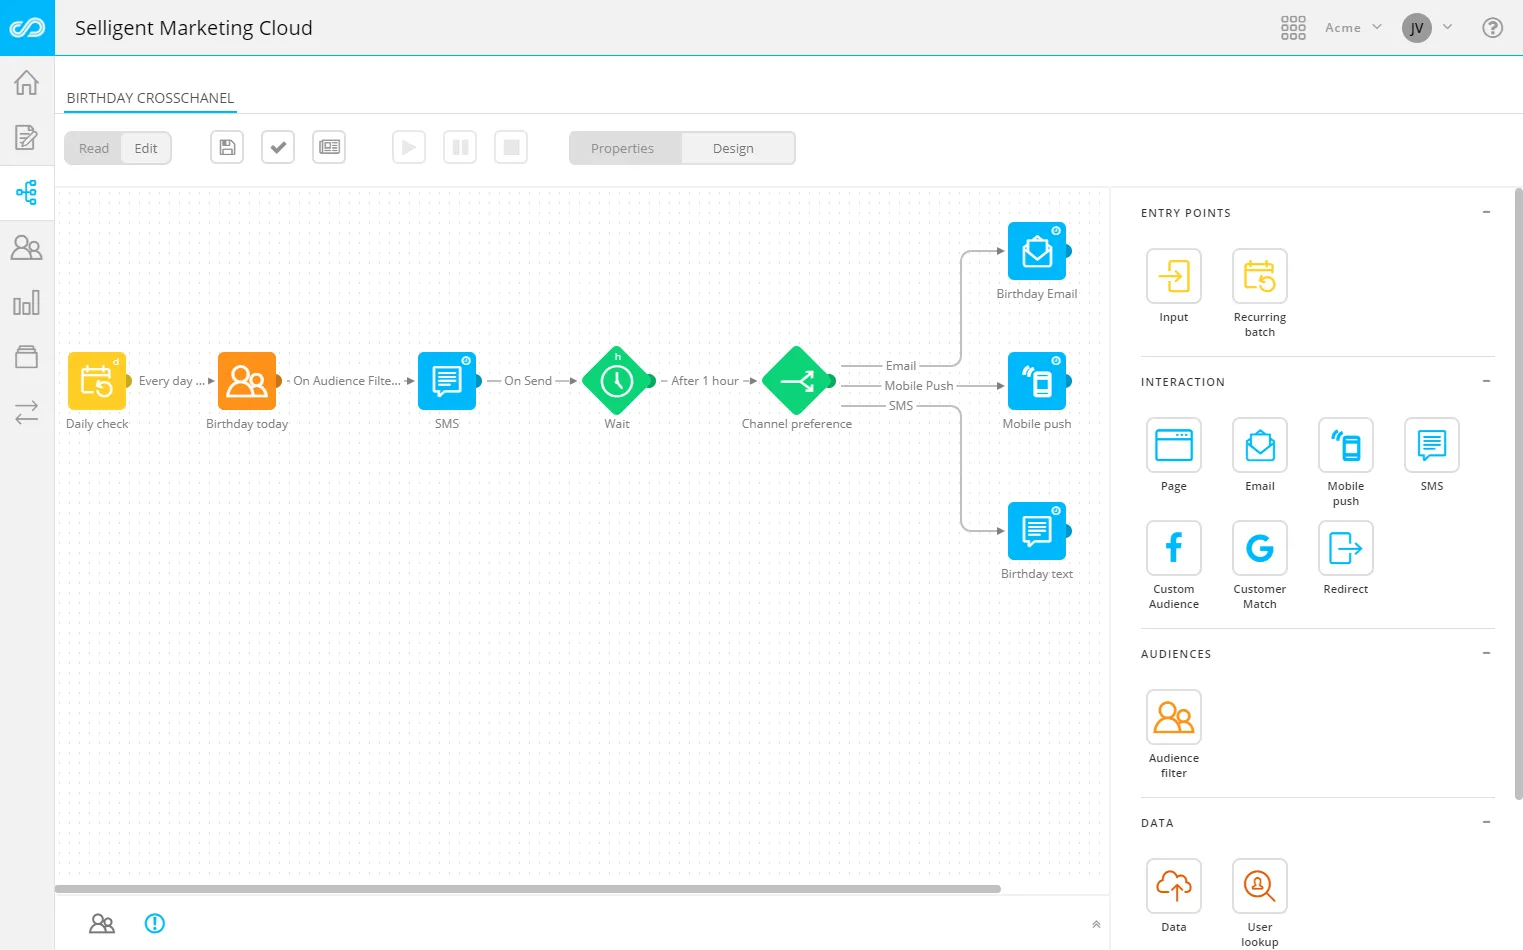
Selligent created an embedded analytics dashboard for their users, allowing them to tap into metrics and explore them over time.
What’s more, users can really take interactivity to the next level with their email segment builder. Imagine you’re exploring a dashboard, filtering out the age groups, locations or campaigns with the highest engagement. Once you’ve made your selection, you can click a button, and use the filtered segment as a target list for your next campaign.
Apogea’s 3D models allow for faster decision making
Apogea is a Spanish company in the proptech and civil engineering space, which is not known for being tech-savvy. Instead of relying on storytelling for their buildings, Apogea built 3D models that viewers can explore and get insights from.
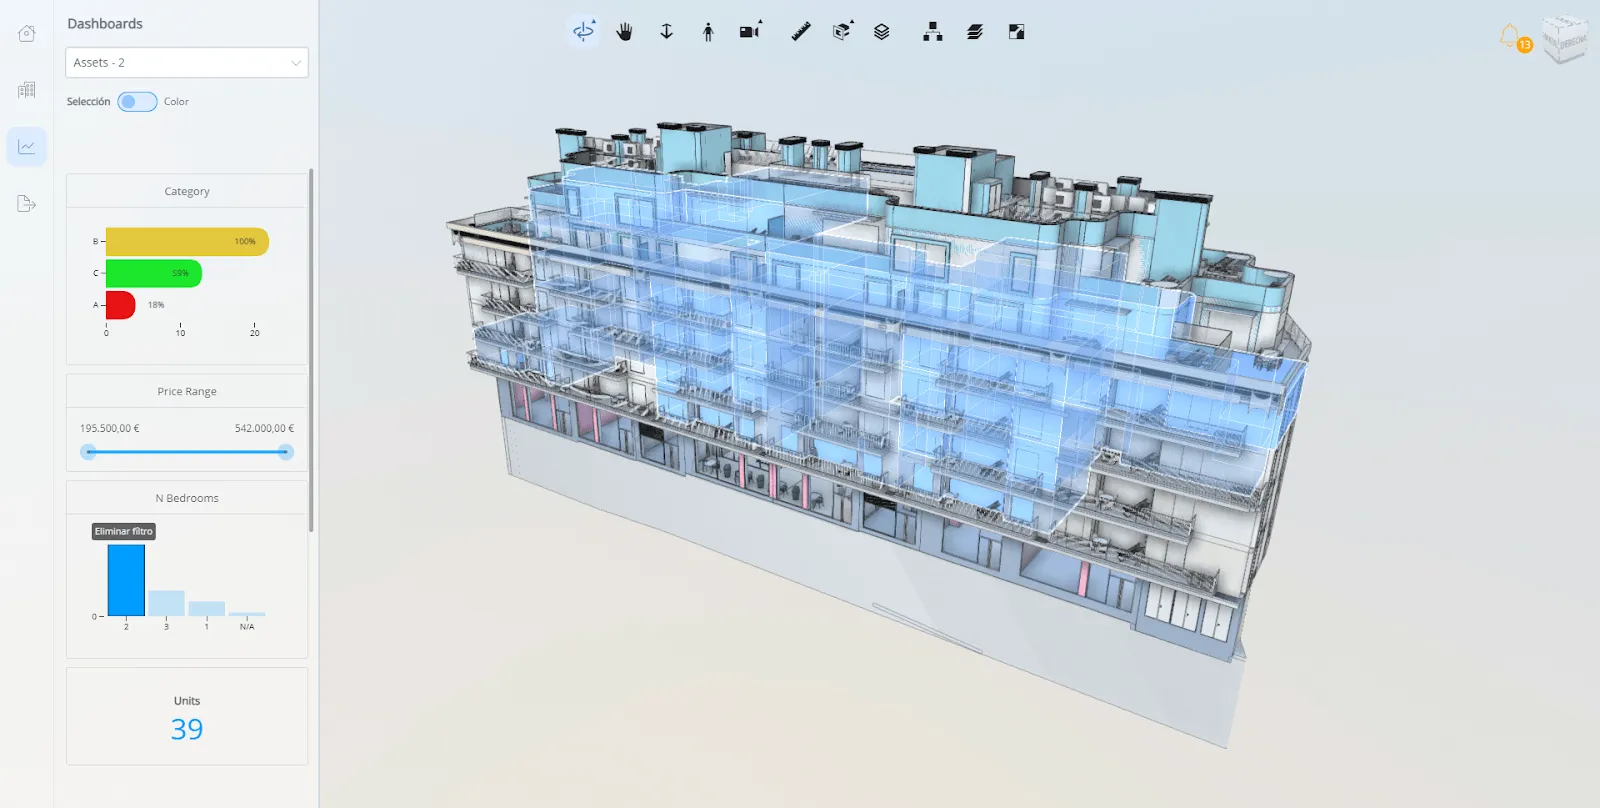
They can tap into individual apartments, look at the materials used, the type of construction, the cash flow, the sale price and much more. In an old school industry such as construction, this brings Apogea a competitive advantage.
Conclusion
Business intelligence is no longer reserved for data scientists and engineers. With data visualization tools, anyone with basic computer skills can do their own data analysis and exploration. And no matter what kind of industry you’re in, giving more people access to data leads to better business outcomes.
If you’re in SaaS and you want to give your customers access to interactive data visualizations, Luzmo can help. Our dashboards not only look great, but they’re easy to use, interactive, and can be customized to look and function great in your SaaS app.
Get your free demo today to learn how Luzmo can help you give your customers access to data points they can explore.
FAQ
All your questions answered.
What is interactive data visualization used for?
Interactive data visualization allows users to explore data by interacting with charts, dashboards, and visual elements. Instead of viewing static reports, users can filter, drill down, and modify visualizations to discover deeper insights.
What is the difference between static and interactive visualizations?
Static visualizations present fixed charts or graphs that do not change. Interactive visualizations allow users to manipulate the data by clicking, filtering, zooming, or exploring different dimensions of the dataset to uncover new insights.
Why do businesses use interactive dashboards?
Businesses use interactive dashboards because they make complex data easier to explore and understand. Teams can quickly identify trends, detect anomalies, and make data-driven decisions without needing advanced data science knowledge.
Written by

Ship the future of your data
Let us show you what Luzmo can do for your product.

Leave your e-mail and one of our analytics experts will reach out to you