 ChatGPT
 Perplexity
.png)
.png)
.png)
Build your first embedded data product now. Talk to our product experts for a guided demo or get your hands dirty with a free 10-day trial.


There's a version of the embedded analytics readiness question that's about technical prerequisites: do we have data? do we have an API? do we have engineering capacity? Those things matter, but they're not what this checklist is for.
This checklist is about product readiness. It's designed to help PMs and CPOs figure out not just whether they can embed analytics, but whether they should – and if so, what level of sophistication is appropriate for where they are right now.
The 2026 version is updated with two signals that didn't exist in earlier iterations: composable analytics readiness and agentic AI readiness. Both represent a meaningful step up from "we have a dashboard in our product," and both require a different kind of organizational readiness.
Work through the questions below honestly. The scoring at the end gives you a starting point recommendation, but the real value is in the questions that make you pause.
If your support inbox, your CS team's Slack, or your NPS verbatims include regular requests for "can you send me the data," "can I export this," or "do you have a report that shows X" – your users want analytics. They're asking for it in the only way they currently can.
This is the clearest signal. Users who want data will find workarounds. They'll export to spreadsheets, they'll screenshot dashboards, they'll ask your team to pull custom reports. Each of those workarounds is a user who would prefer the data to be in your product.
Sales teams hear this as "we need reporting" in discovery calls. CS teams hear it as "we're not getting the value we expected" in churned account post-mortems. Product teams hear it in feature requests that pile up under a "reporting" or "insights" label.
If analytics appears in your competitive loss analysis, your churn data, or your expansion blockers – it's a revenue problem, not just a product problem. That changes the urgency and the budget conversation.
Not all products generate data that users want to see. But most SaaS products – especially those that manage workflows, track activity, handle transactions, or coordinate teams – generate data that users could act on if they could see it clearly.
The test: could a user make a better decision about how to use your product if they had visibility into patterns in their own data? If yes, you have the raw material for analytics. If your product is mostly a content tool or a communication tool with little behavioral data, the case is weaker.
Embedded analytics is a significant engineering investment, even when you're using a platform like Luzmo that handles the data infrastructure. It requires design work, integration work, ongoing iteration, and someone who owns it.
If your engineering team is in firefighting mode on the core product, adding analytics will either be underfunded (resulting in a feature nobody uses) or will pull capacity from things that matter more right now.
Analytics features without a clear owner become the feature that nobody updates, nobody iterates on, and nobody champions internally. The first version gets shipped and then sits unchanged for 18 months while users quietly stop using it.
Good analytics is a product discipline, not a one-time build. Someone needs to be thinking about what questions users are trying to answer, what they're not finding, and how the analytics should evolve as the product does.
"Our users want analytics" is not a product spec. "Our operations managers need to see team utilization by week to run their Monday standups" is a product spec.
The teams that ship analytics features that get used have a specific user persona in mind and a specific job-to-be-done. The teams that ship features nobody uses built analytics for "users" generically.
Embedded analytics requires data that can be queried in near-real-time (or at a refresh rate that meets user expectations). This typically means a database, a data warehouse, or an API that exposes structured data.
If your data is locked in disparate systems, requires manual exports, or is only accessible via internal tooling, you have a data plumbing problem that needs to be solved before or alongside the analytics build. Luzmo Foundation handles query optimization and caching once you have accessible data, but it can't fix an upstream data architecture problem.
If you serve multiple customers, each customer should only see their own data. This sounds obvious, but implementing row-level security correctly (at scale, without performance degradation, without security gaps) is one of the hardest parts of embedded analytics architecture.
If your data model doesn't cleanly separate customer data, you'll either need to solve this before embedding analytics, or you'll need a platform that handles tenant isolation as a first-class concern. Luzmo includes multi-tenant data isolation built in, which removes this from your engineering backlog, but you still need a data model that can support it.
Different analytics use cases have different latency requirements. A weekly executive summary can tolerate data that's 24 hours old. A real-time operations dashboard for a logistics team cannot.
Know what your users need before you design the architecture. Real-time or near-real-time data adds significant infrastructure cost and complexity. If your users' decisions happen on a daily or weekly cadence, you may not need it, and overshooting on data freshness is a common source of unnecessary cost.
Standard embedded dashboards give users a view. Composable analytics gives users control – the ability to customize, configure, and build their own views within boundaries you define.
The signal for composable readiness is users who go beyond "I want to see the data" to "I want to see it my way." Power users who build their own reports in Excel after exporting. Users who send feature requests for specific chart configurations. Enterprise customers who want branded, custom-layout reporting for their own clients.
If your users want a reporting tool, not just a reporting widget, composable analytics is the right direction. The Luzmo Flex SDK and Analytics Component Kit (ACK) are designed for exactly this level of customization, building analytics experiences in code, composing individual components into fully custom layouts.
In 2026, analytics is no longer a "nice to have" feature in most SaaS categories. It's becoming a baseline expectation; and in some categories, a source of competitive differentiation. Competitors who ship deeper, more flexible, more intelligent analytics experiences are winning deals and retaining accounts on the strength of those features.
If you're in HR tech, fintech, MarTech, supply chain, or proptech (categories where data density is high and user sophistication is growing) the bar has moved. Customer-facing analytics that felt impressive in 2022 may feel table stakes in 2026.
The adoption ceiling for traditional dashboards is well-documented: users who don't know what to look for don't look. They open a dashboard, see charts they don't immediately understand, and close it.
If your analytics adoption data shows users who open the analytics section once and don't return, or who request ad-hoc data pulls from your team despite having access to self-serve analytics, you have a discoverability problem that a better dashboard won't fix. This is the signal for Luzmo IQ: an embedded AI analyst that lets users ask questions in plain language and get explained answers, not just charts.
Agentic analytics is the next step beyond conversational AI. Instead of waiting for a question, the agent monitors data, detects patterns, and pushes relevant insights to users in their workflow: a weekly briefing, an anomaly alert, a summary that appears when they open a key view.
The readiness signal isn't technical. It's about whether your users' jobs are meaningfully impacted by things they don't know to look for. Operations managers who need to catch problems before they escalate. Account managers who need to know when a customer account shows churn signals. Finance teams who need to be alerted when spend patterns deviate from plan.
If your users would benefit from data that finds them, rather than data they have to find; agentic analytics belongs on your roadmap.
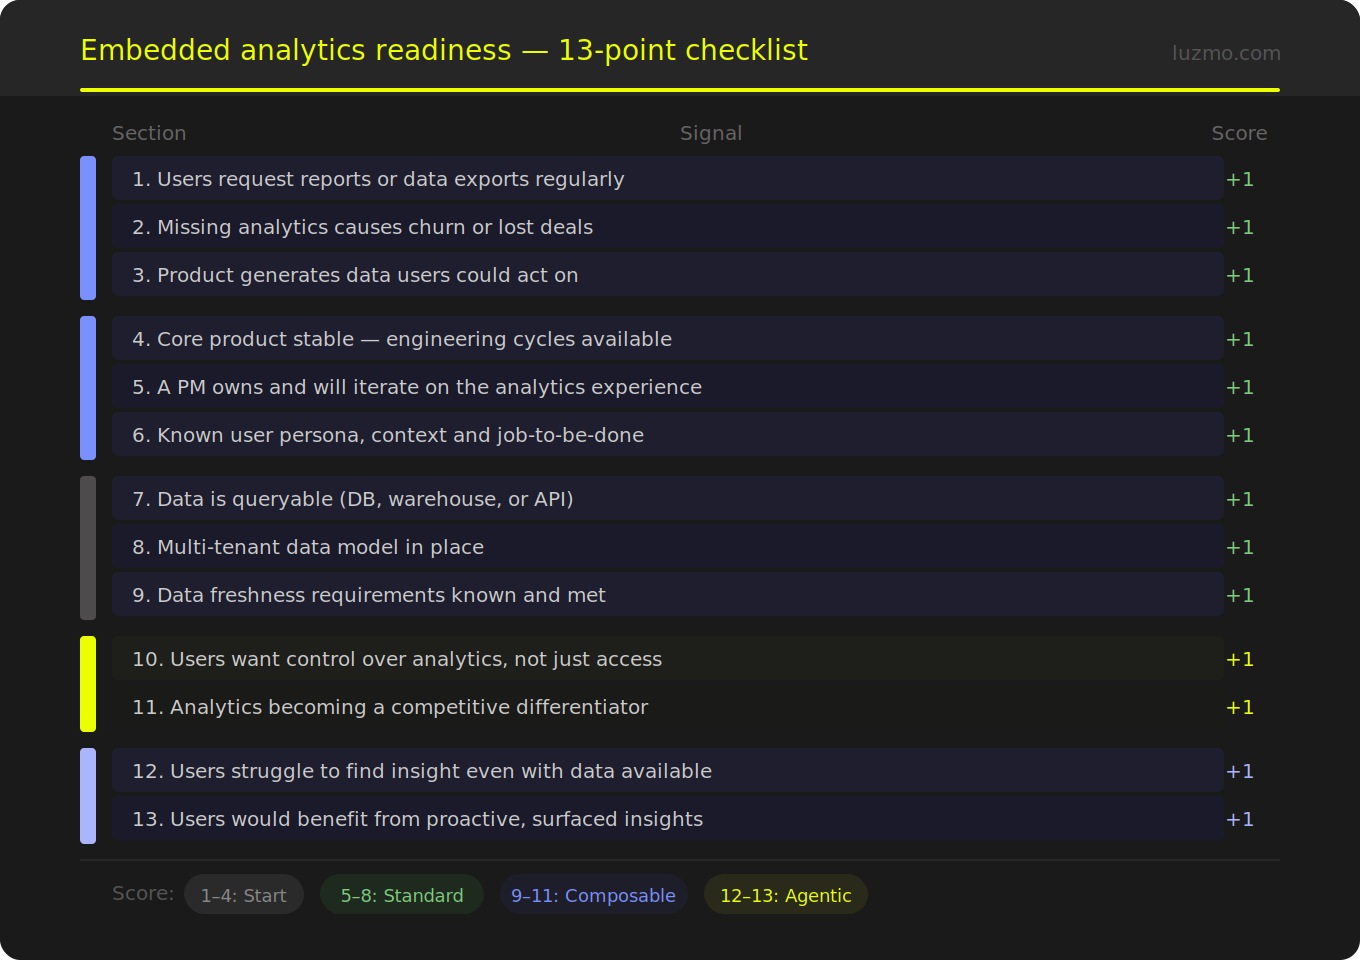
Count your "Ready signal" answers:
Your priority is validating that users actually want analytics in your product. Start with a basic embedded dashboard: a handful of predefined views covering your most common use cases. Don't over-engineer. Ship something, measure adoption, and let that data guide the next step.
You have a clear use case, organizational ownership, and data readiness. Build a proper embedded analytics experience with Luzmo Studio: one that inherits your design system, responds to user context, and handles multi-tenant data isolation correctly. Add self-service analytics if your power users want to explore beyond predefined views.
You're past the "do users want analytics" question and into "how do we build analytics that's genuinely differentiated." The answer at this level is composable analytics with ACK – building the analytics experience in code, composing individual components into custom layouts, wiring analytics into your application state. Add Luzmo IQ for the users who struggle to navigate even a well-designed analytics experience.
You're building a data product, not an analytics feature. The full stack (composable components, AI-powered natural language querying, and proactive agentic insights) is appropriate. This is what separates category leaders from the rest in 2026. The Luzmo AI suite covers the full capability set.
The checklist above identifies readiness signals. But there's a deeper question underneath all of them: what would change for your users if they had better visibility into their data?
If the honest answer is "not much", then your users aren't data-driven, their decisions don't depend on patterns in their activity – then analytics is likely the wrong priority right now, regardless of your score.
If the honest answer is "they'd catch problems earlier, prioritize better, justify decisions more confidently, spot opportunities they're currently missing", then analytics isn't just a product feature. It's a value driver. And the question isn't whether to build it, but how fast.
Want to talk through where you are on this checklist and what the right starting point looks like for your product? Book a 30-minute call with our team – we do this conversation a lot, and we'll be direct about what we'd recommend.

All your questions answered.
Build your first embedded data product now. Talk to our product experts for a guided demo or get your hands dirty with a free 10-day trial.


