 ChatGPT
 Perplexity
.png)
.png)
.png)
Build your first embedded data product now. Talk to our product experts for a guided demo or get your hands dirty with a free 10-day trial.

.png)
The head coach's tablet lights up mid-game. Player 7's GPS data shows a sprint velocity drop of 12% in the last 10 minutes. Heart rate elevated. High-speed running distance 15% above weekly average. The dashboard flashes yellow: injury risk detected.
This isn't post-game analysis. It's happening in real-time, on the sideline, during the match.
If you're building a sports analytics platform, this is the experience your customers expect. Not next-day reports. Not static PDFs. Real-time insights that coaches can act on during the match.
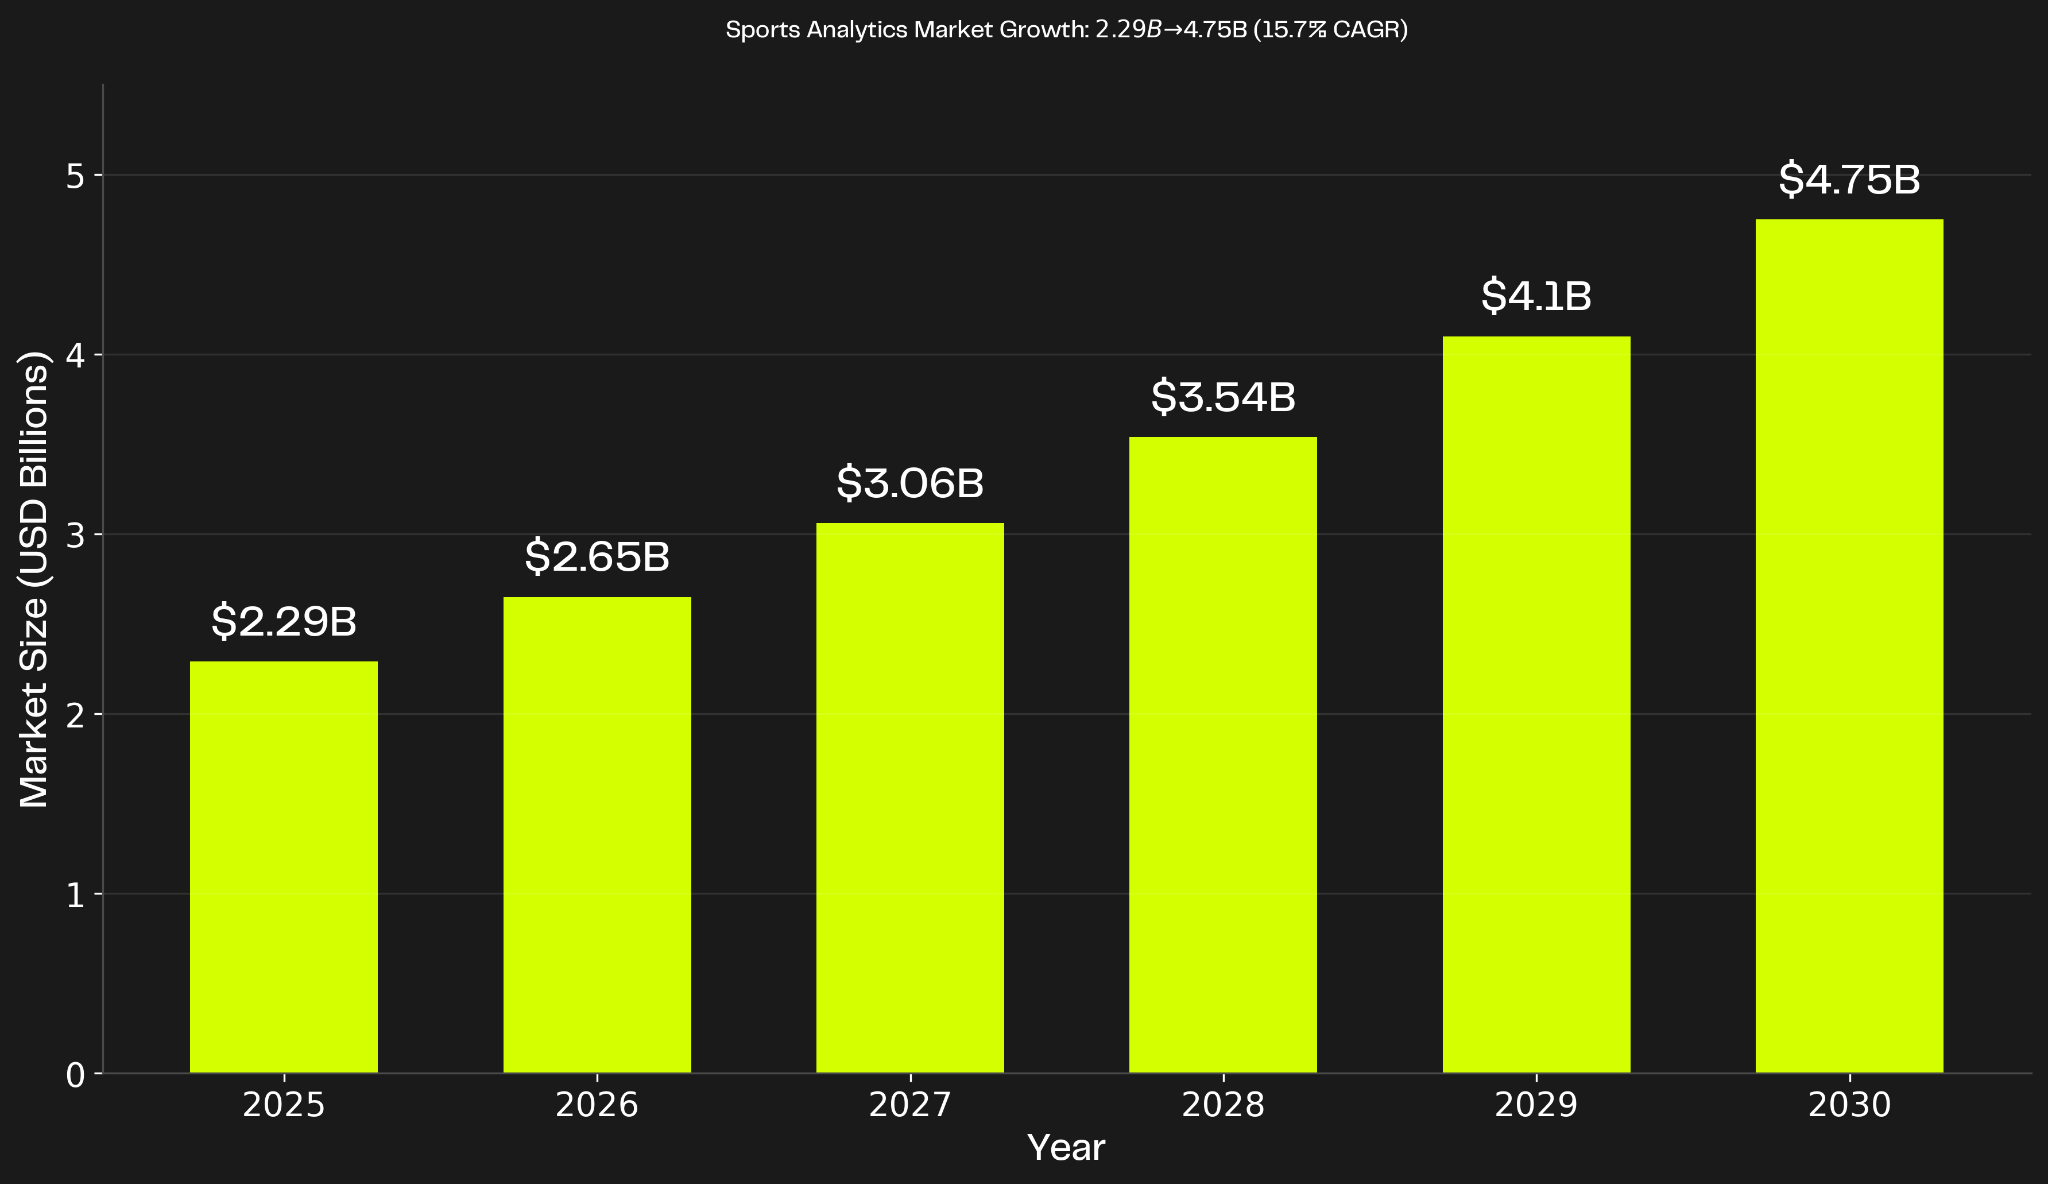
The sports analytics market is growing from $2.29 billion in 2025 to $4.75 billion by 2030—a 15.7% CAGR driven by one fundamental shift: coaches now expect live insights embedded directly in their platform workflow. The US market alone is projected to reach $5.30 billion by 2033, with North America holding 35.3% of global market share.
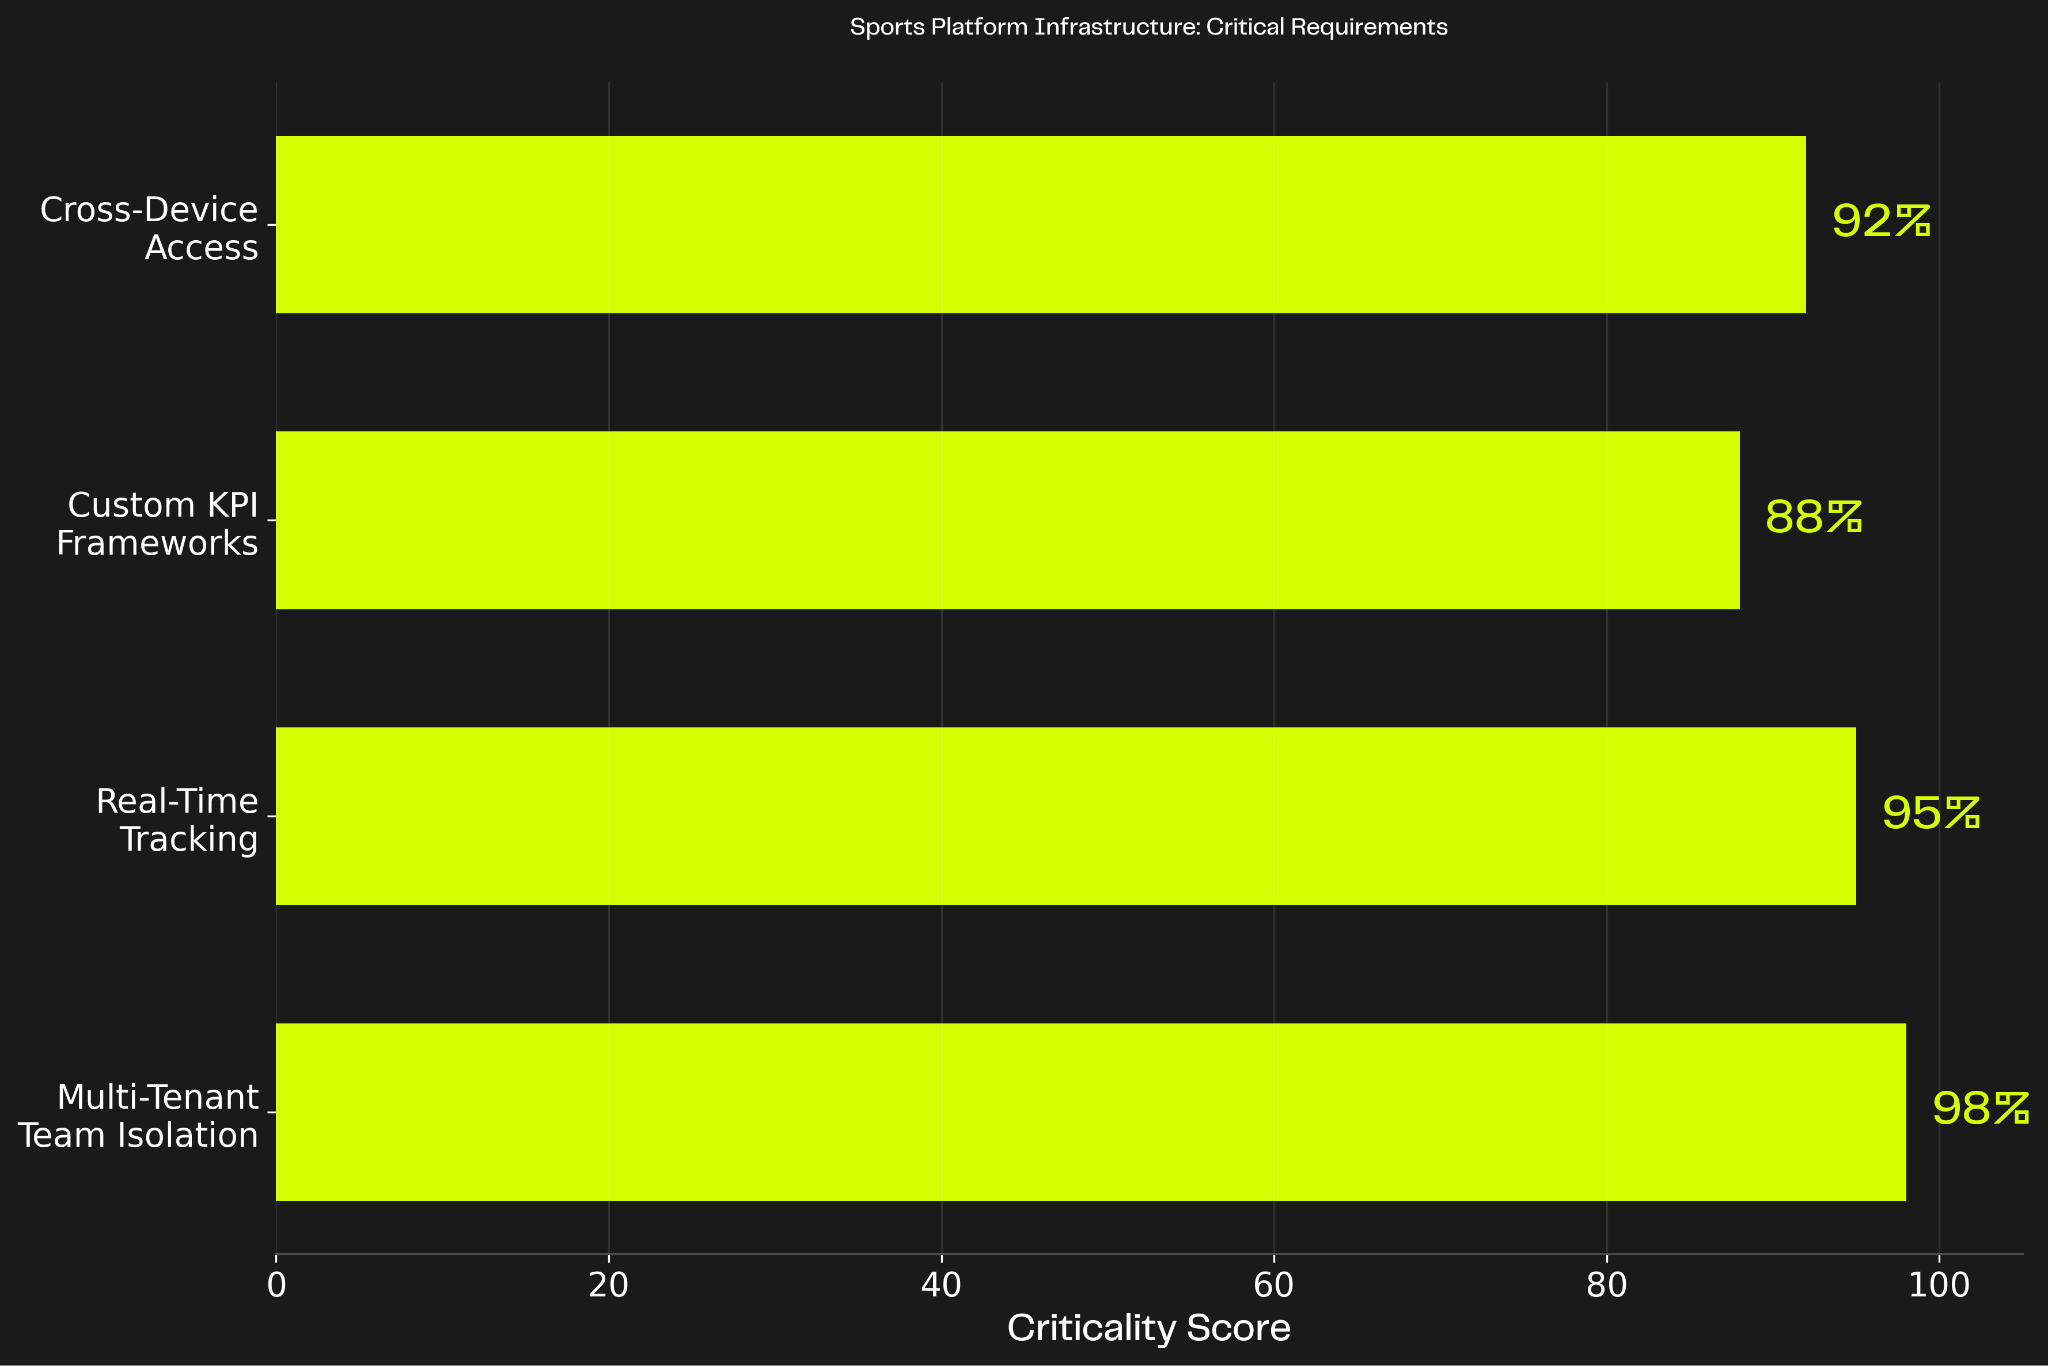
Your platform faces a technical challenge that separates market leaders from laggards: multi-tenant team isolation at scale. A single league platform might serve 50 to 500+ teams across amateur, semi-pro, and elite levels. Each team demands isolated data views. Each coach expects real-time performance tracking. Each rival team's data must remain completely segregated.
When team isolation fails or analytics lag, coaches churn to competitors. The switching decision isn't about video quality anymore—it's about which platform delivers better insights when those insights actually matter.
Your platform operates a business model fundamentally different from traditional SaaS. A youth soccer league with 20 teams, a professional basketball association with 30 franchises, a national rugby federation managing 100+ clubs—all run on the same platform instance.
Each team sees only their data. Coaches can't access rival team's GPS tracking, injury histories, or tactical patterns. League administrators need cross-team visibility for competition-wide benchmarking and compliance monitoring. Players access personal performance metrics through self-service portals. Medical staff track injury trends and workload management across their squad.
The technical architecture requires perfect data segregation. A misconfigured permission letting Team A see Team B's player readiness scores doesn't just violate competitive integrity—it ends contracts. One data leak and the entire league switches platforms.
Your analytics layer must handle strict tenant isolation while enabling teams to integrate video, physiological data, and tactical analysis. Coaches need collaborative workflows where they can share annotated clips and generate custom reports while maintaining complete separation between organizations. Medical teams need centralized health, performance, and availability data with role-specific access preventing unauthorized exposure.
Platform teams building for sports face four infrastructure challenges that determine whether their analytics become indispensable or ignorable.
True multi-tenancy in sports requires more than database partitioning. Each team needs isolated dashboards, permissions, and reporting configurations while the league administrator manages all teams from a unified control panel.
Row-level security becomes critical. When a league admin pulls up cross-team injury trends, the dashboard enforces access controls preventing individual team data exposure. When a coach logs in, they see only their squad's metrics rendered in team branding with sport-specific KPIs.
The complexity multiplies with privacy compliance. Player biometric data requires GDPR compliance in Europe, varying state privacy laws in the US, and specific athlete data protections that differ by sport and level. A platform serving professional leagues, college athletics, and youth organizations must enforce different privacy frameworks per tenant.
Your platform needs enterprise-grade security, complete data isolation between clubs, role-based access control, and full audit trails. Role-based interfaces must protect sensitive player data while maintaining compliance standards that satisfy league legal teams.
Sports data doesn't batch well. During a match, GPS devices on players transmit location data every 0.1 seconds. Heart rate monitors stream continuous biometric readings. Accelerometers capture every sprint, jump, and change of direction. Video cameras capture tactical positioning in real-time.
All of this data must flow into dashboards that coaches actually monitor during games. Dashboard lag isn't just annoying—it's tactically useless. A coach making substitution decisions based on data delayed by 30 seconds might as well wait for post-match reports.
Your platform needs behavior-based analytics to detect fatigue patterns and injury risks that human observation misses. Predictive models must identify injury risks days or weeks in advance by detecting subtle biomechanical changes invisible to the naked eye. Professional clubs expect injury prevention capabilities that protect player value worth tens of millions.
The technical challenge is handling millions of data points per game while maintaining sub-second query latency across hundreds of concurrent users. A 20-team league with coaches, medical staff, and analysts all accessing dashboards during Saturday fixtures generates massive concurrent load that standard BI tools can't handle.
Football metrics differ fundamentally from basketball analytics. Rugby tracking emphasizes contact load and collision impacts. Baseball focuses on biomechanical throwing data. Each sport requires sport-specific templates.
Within each sport, every coach has a unique performance philosophy. One football coach prioritizes pressing intensity and high-speed running distance. Another focuses on positional play and passing network density. A third emphasizes transition speed and counter-attack efficiency.
Your platform must support custom KPI frameworks without requiring engineering work per request. Coaches need no-code dashboard builders where they can define custom metrics, set alert thresholds, and configure real-time notifications based on their tactical philosophy.
Injury risk models also vary by sport and position. A pitcher's workload calculation differs entirely from a goalkeeper's. A rugby forward's contact load monitoring has no equivalent in tennis. Your platform needs sport-specific templates with flexibility for team-level customization.
The analytics layer must support centralized data and technology connections enabling performance analytics, tactical analysis, and injury prevention across different team sports. Amateur coaches need intuitive analysis tools while elite analysts demand comprehensive performance insights with advanced customization options.
Coaches access analytics on tablets from the sideline during matches. Analysts work on desktop workstations in the office building detailed tactical reports. Players check performance metrics on mobile phones. Medical staff review injury data on tablets in treatment rooms.
All these users need the same underlying data presented in device-appropriate interfaces. The coach's sideline tablet prioritizes live readiness scores and substitution recommendations. The analyst's desktop shows detailed heatmaps and passing network visualizations. The player's mobile app focuses on personal metrics and recovery guidance.
Responsive design isn't enough. A dashboard optimized for 27-inch monitors doesn't work on 10-inch tablets when a coach needs to make split-second decisions. The platform needs device-specific interfaces that maintain data consistency across all access points.
Mobile-first design becomes critical. Coaches spend more time on sidelines than in offices. If the mobile experience lags or requires constant zooming and scrolling, they'll switch to platforms with better tablet optimization.
Your platform competes in a market where GPS accuracy and video quality have largely commoditized. The differentiation comes from the analytics layer and how those analytics influence coaching decisions—which platform turns raw data into better coaching decisions faster, more accurately, and with better multi-tenant isolation.
Basic offerings provide video analysis only. Pro tiers add performance analytics with GPS and biometric tracking. Elite packages include full bio monitoring with predictive AI for injury prevention and tactical recommendations.
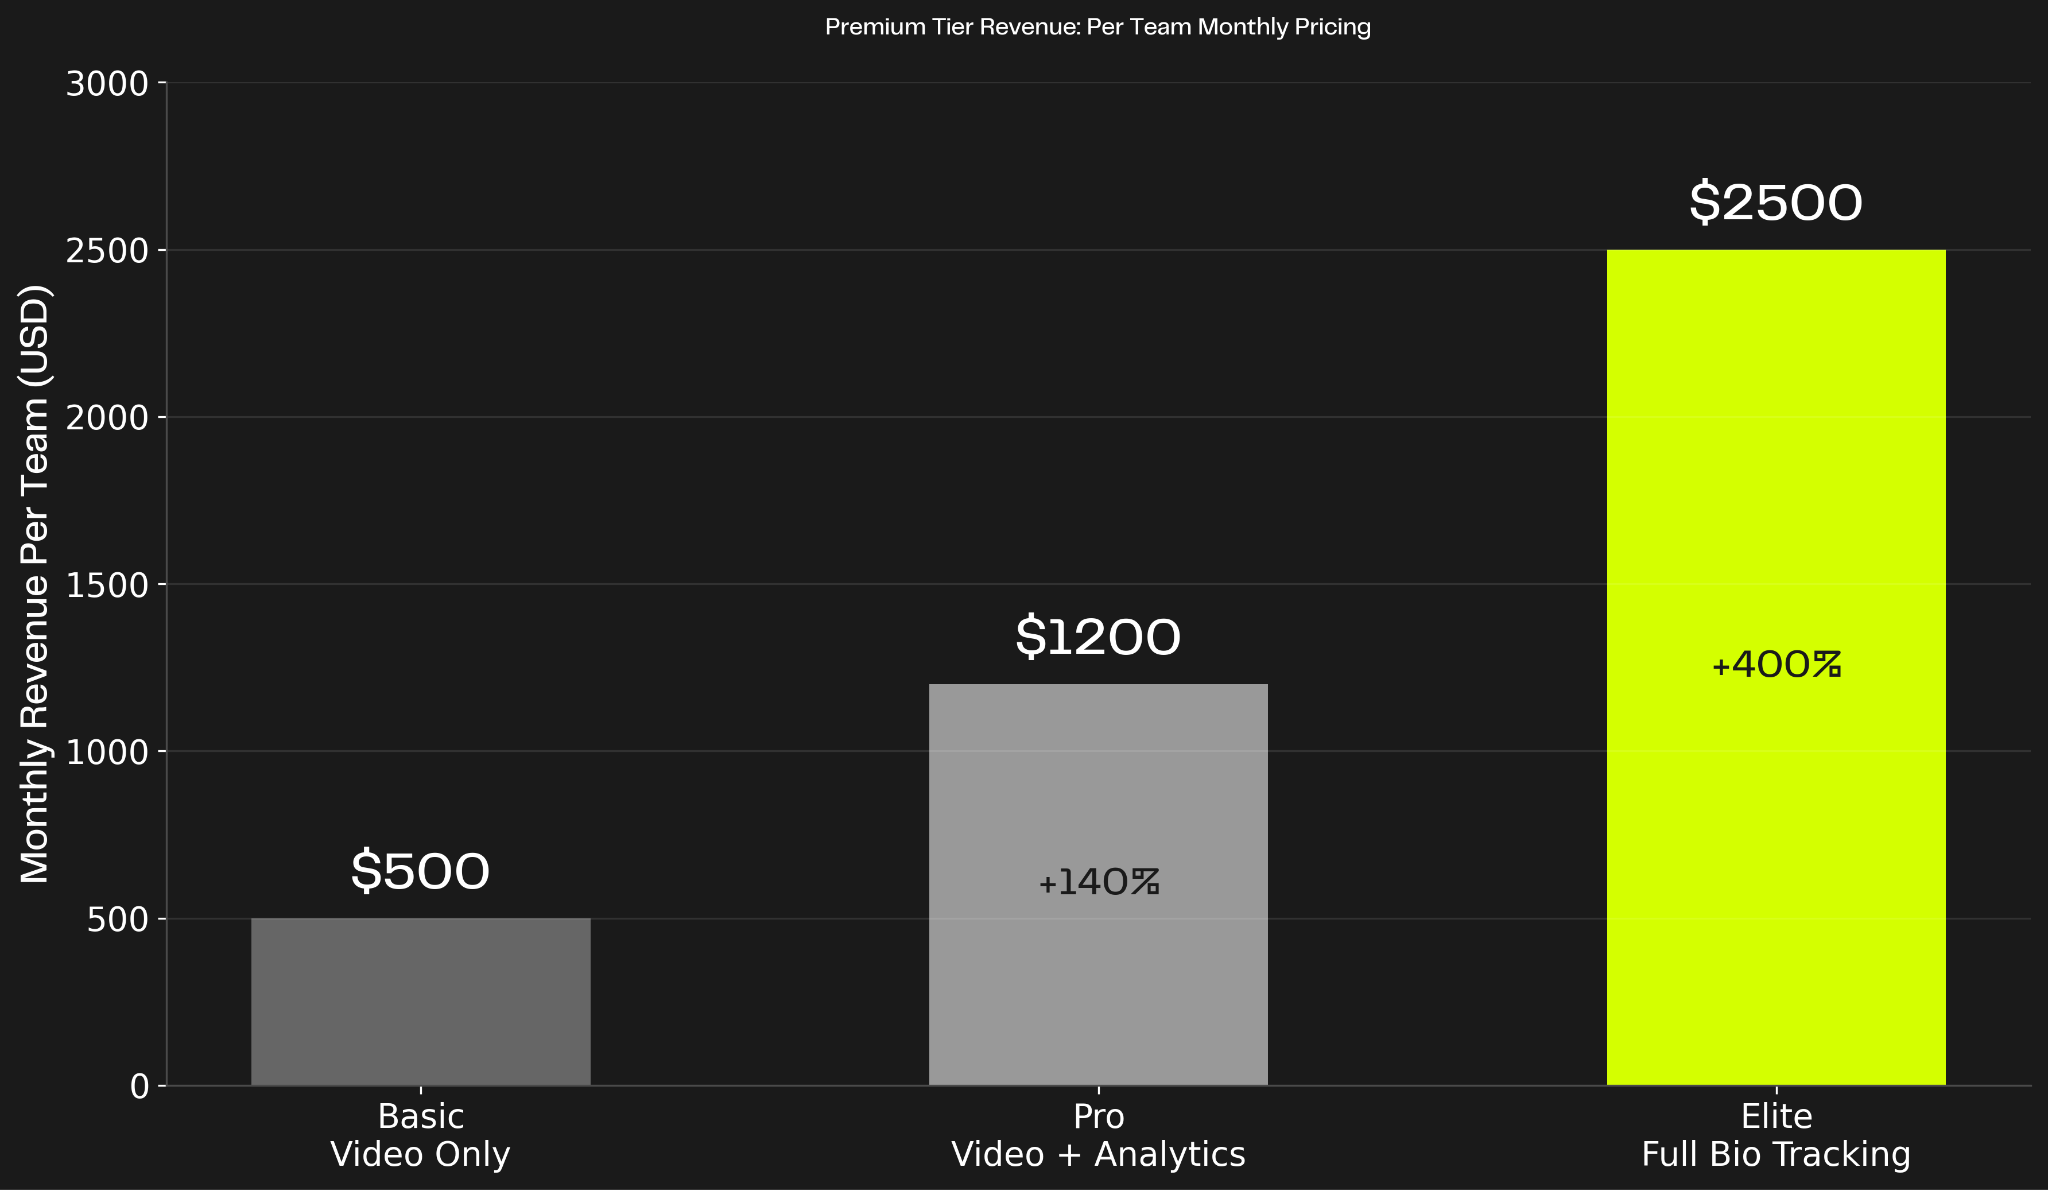
The pricing spread is substantial. Basic video analysis: $500 per team per month. Pro with analytics: $1,200 per month. Elite with AI-powered insights: $2,500 per month—a 400% revenue increase for capabilities that cost the platform marginally more to deliver once infrastructure is built.
The analytics tier creates natural upsell paths. A youth academy starts with basic video. They experience their first serious injury and realize they need better workload monitoring. They don't switch platforms—they upgrade to pro analytics within the existing relationship. An elite club starts with pro but wants AI-powered tactical recommendations. They upgrade to elite tier.
Successful platforms expand their analytics capabilities to deliver integrated tactical breakdowns, workload analysis, and post-match insights. Advanced AI-driven tagging and real-time collaboration features enable coaches to streamline analysis and refine strategic planning without switching tools.
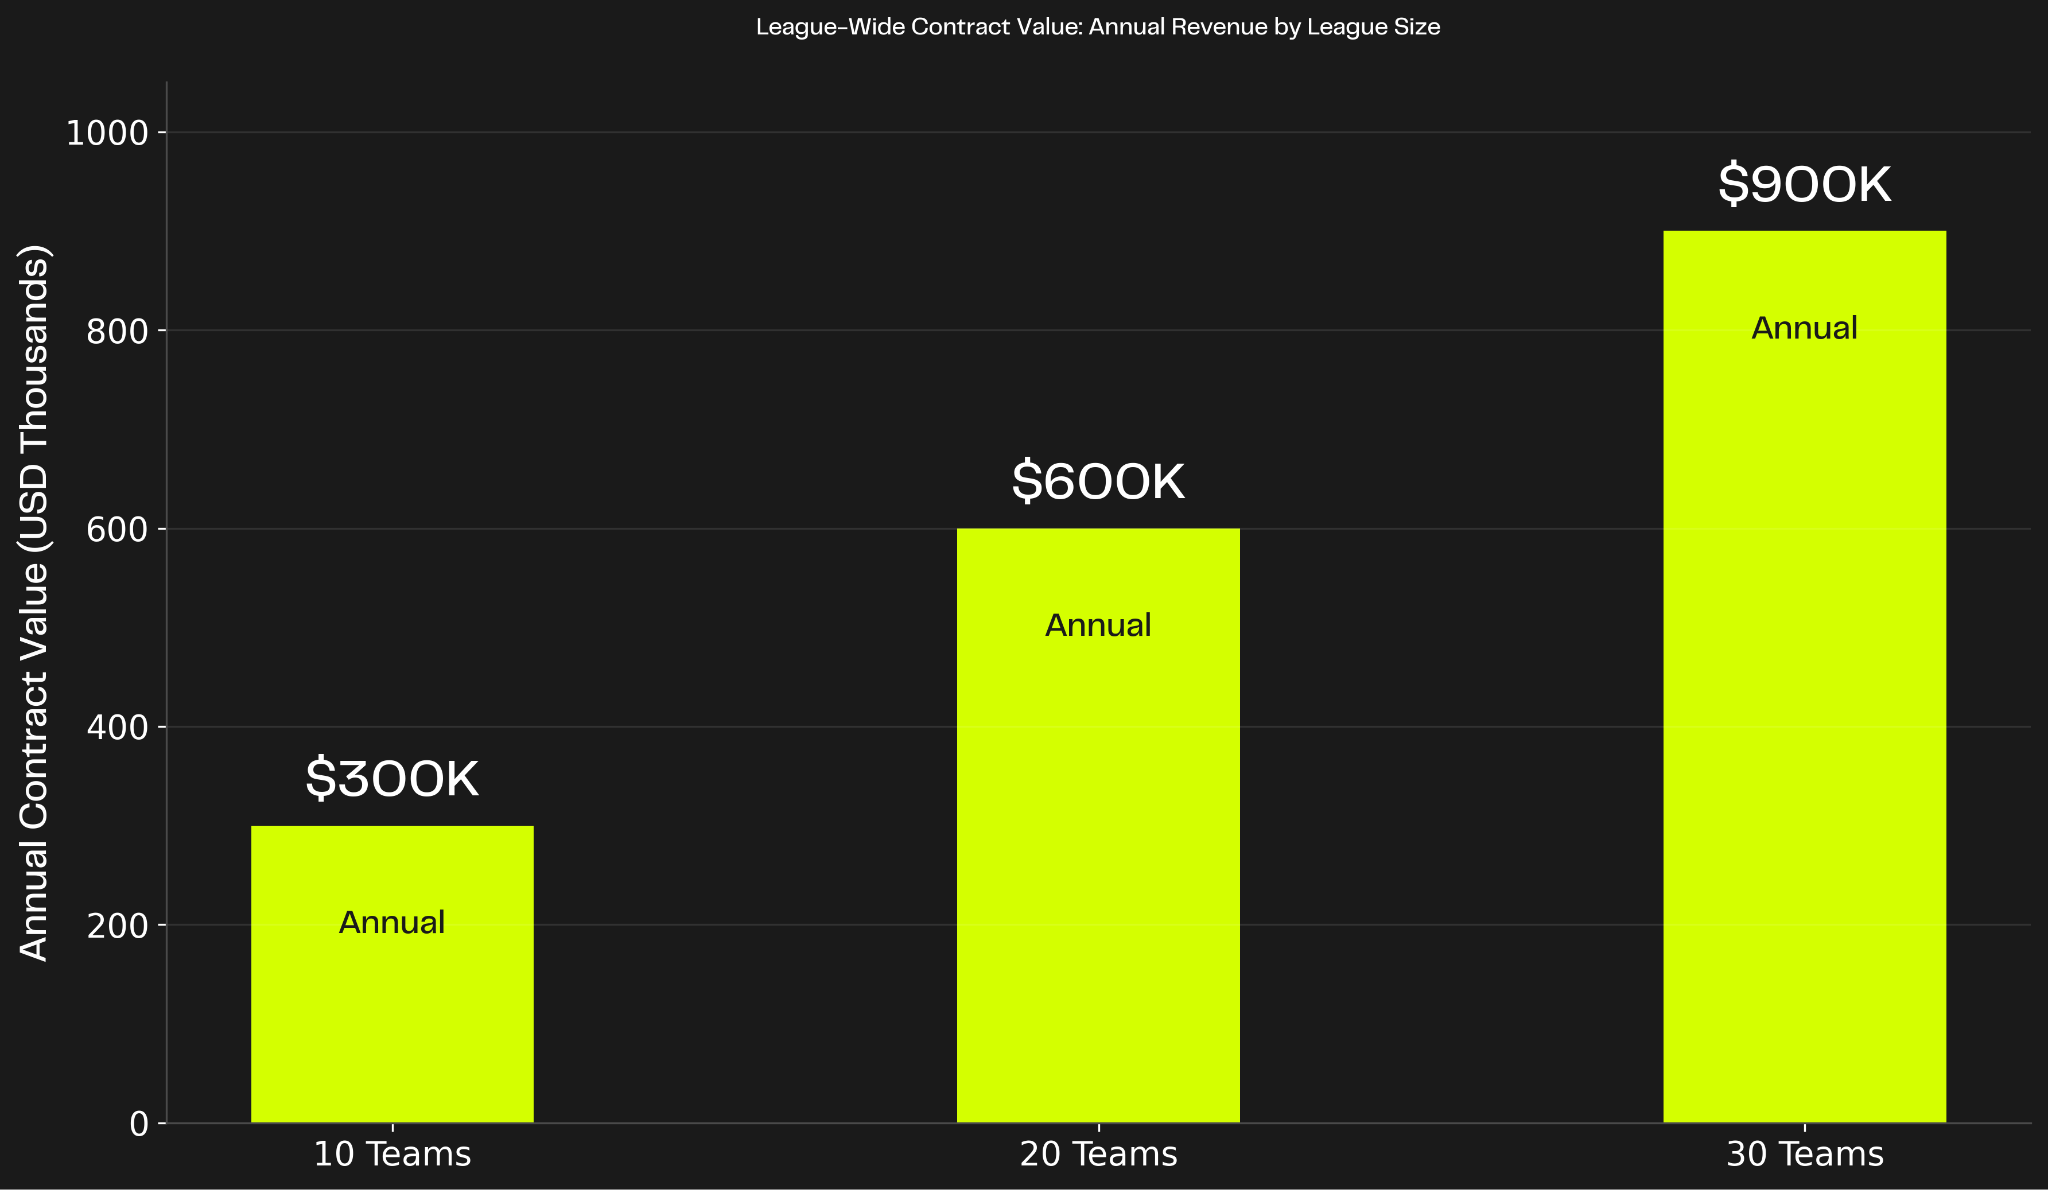
Selling to individual teams generates recurring revenue. Selling to entire leagues generates transformational contracts. A 20-team professional league at $2,500 per team per month equals $600,000 in annual recurring revenue from a single customer.
League-wide contracts create lock-in through standardization. When all 20 teams use the same platform, they can share tactical analysis formats, injury data protocols, and player development frameworks. The network effects make switching increasingly difficult as more teams join.
Leagues also enforce platform adoption. When a professional association standardizes on a GPS tracking or video analysis platform, individual teams comply regardless of preference. This top-down adoption eliminates bottom-up sales cycles and accelerates implementation across the entire league.
Multi-year partnerships with professional leagues demonstrate the revenue concentration possible when platforms win at the association level—securing all teams simultaneously rather than selling to individual clubs one at a time.
Sports analytics platforms achieve 85-90% annual renewal rates not through contracts but through data accumulation. After three years, the platform holds three seasons of player performance history, injury records, tactical evolution, and coach-specific KPI configurations.
Switching platforms means abandoning this continuity. Historical comparisons break. Trend analysis resets. Custom dashboards require rebuilding. Coaches resist losing institutional knowledge embedded in years of data.
The switching cost isn't purely technical—it's operational and psychological. Coaches build their entire analytical workflow around specific dashboards. Medical staff structure injury prevention programs around platform-specific risk models. Players track personal development against historical baselines.
One platform serving a professional club for five years holds more institutional knowledge than many staff members. That data becomes irreplaceable, and renewal becomes automatic.
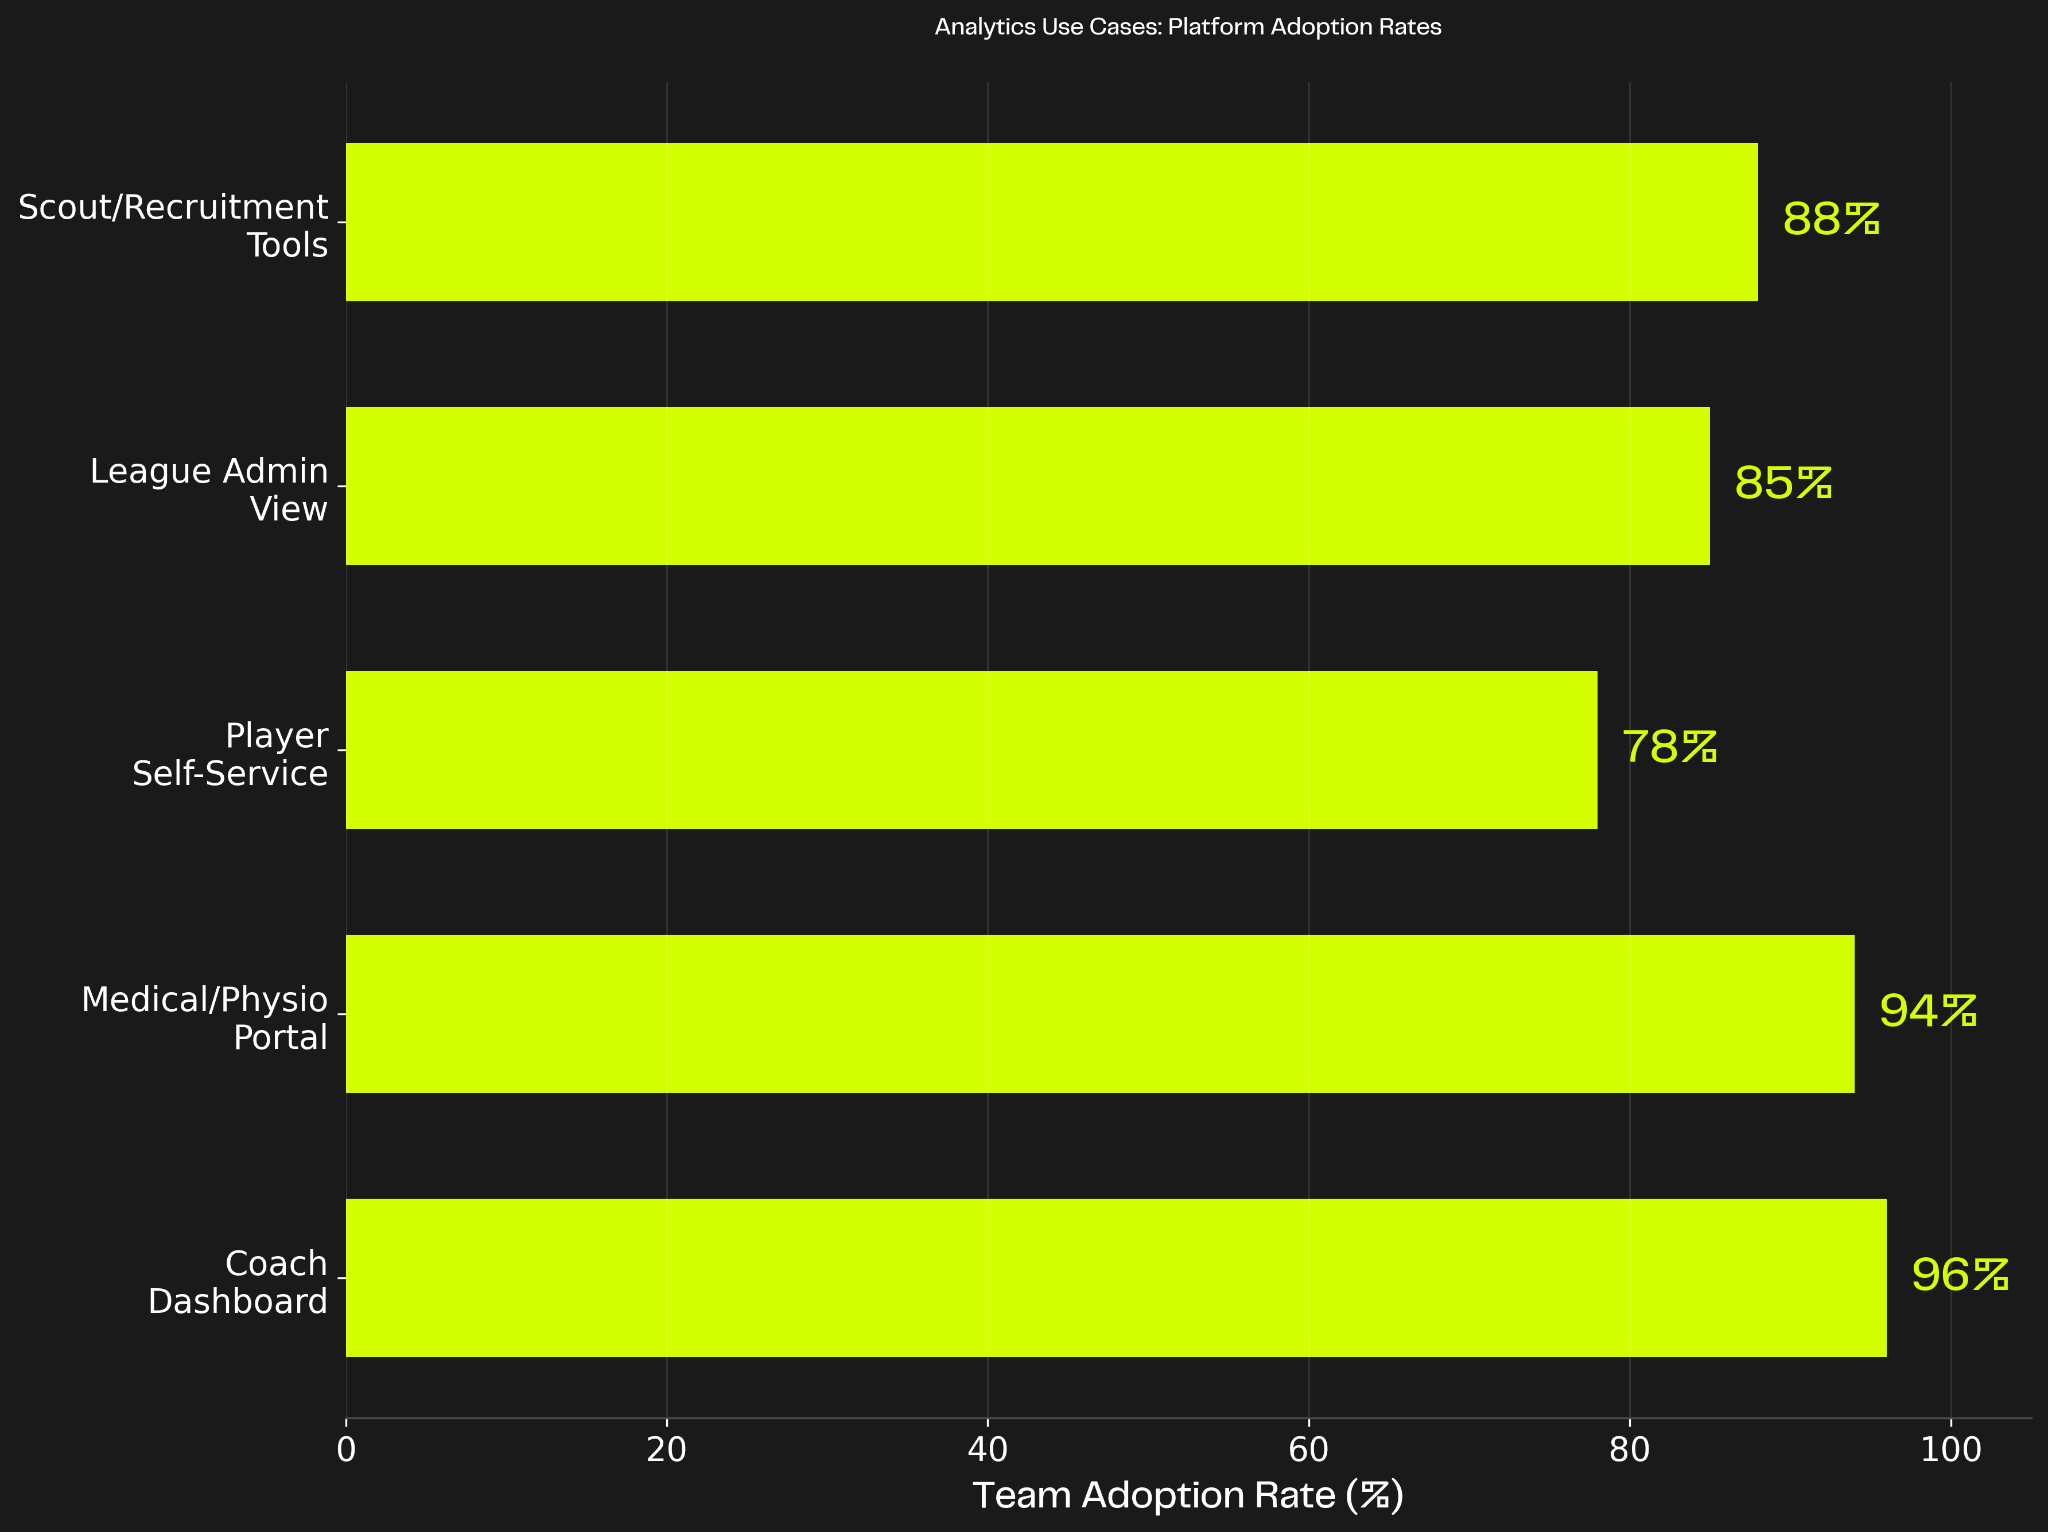
Platform teams building for sports should focus on five core use cases that drive adoption and retention.
This is the primary interface where coaches interact with team data. It needs player readiness scores synthesizing sleep quality, training load, injury status, and recovery metrics into actionable recommendations. Training load versus injury risk indicators flag players approaching dangerous workload thresholds. Tactical pattern analysis displays heatmaps, passing networks, and positional play breakdowns. Opponent analysis shows rival team tendencies and exploitable weaknesses.
The dashboard must update in real-time during training and matches. Readiness scores reflect morning weigh-ins and wellness questionnaires completed hours before kickoff. GPS data streams during sessions showing which players hit high-speed running targets. The coach sees everything relevant without information overload obscuring critical signals.
Medical staff need injury tracking and return-to-play protocols managing rehabilitation timelines and clearance criteria. Workload monitoring tracks GPS metrics, heart rate data, and accelerometer readings identifying fatigue indicators before injuries occur. Treatment history per player documents every intervention, medication, and therapy session. Fatigue indicators combine subjective wellness data with objective biometric measurements.
The medical dashboard prioritizes prevention over treatment. By identifying players approaching injury risk thresholds, physios intervene with modified training loads or additional recovery protocols. Predictive analytics powered by machine learning detect subtle patterns invisible to human observation.
Platforms with sophisticated injury prediction models demonstrate measurable ROI by preventing injuries that would cost clubs millions in lost player value. Professional sports teams using predictive analytics report reducing injury rates by identifying at-risk players and adjusting training protocols before problems occur.
Players access personal performance metrics tracking their development against individual goals and position-specific benchmarks. Training program assignments outline daily workouts, recovery protocols, and tactical homework. Recovery recommendations specify sleep targets, nutrition guidance, and treatment schedules. Goal tracking visualizes progress toward contract incentives, national team selection criteria, or transfer market value.
Self-service portals reduce coach workload while increasing player engagement. Instead of asking coaches about their performance data, players access dashboards showing exactly where they stand. This transparency builds trust and accountability while freeing coaches to focus on tactical preparation.
The player experience must be mobile-first. Professional athletes check metrics on phones between training sessions, not desktop computers in offices. The mobile interface prioritizes clarity over complexity, showing key metrics without overwhelming detail.
League administrators need cross-team benchmarking showing anonymized performance comparisons enabling teams to assess their relative standing without exposing individual data. Competition-wide injury trends identify sport-level patterns requiring rule changes or safety interventions. Usage analytics track which teams engage with platform features and which need additional support. Compliance monitoring ensures teams meet league-mandated reporting requirements and data quality standards.
The admin view serves a governance function that individual team dashboards can't provide. When a league sees injury rates spiking across multiple teams, they can investigate whether rule changes or playing surface issues are contributing factors. When usage data shows certain teams not utilizing injury prevention features, the league can mandate training or support.
Scouts need player comparison tools enabling side-by-side analysis of prospects across multiple performance dimensions. Performance trend analysis identifies improvement trajectories separating late bloomers from early peakers. Video highlight reels with stats overlay combine tactical footage with quantitative performance data. Transfer market insights estimate player values based on objective performance metrics.
The recruitment portal helps clubs make data-informed signing decisions rather than relying purely on subjective scouting reports. When a scout identifies a promising player, they can validate the assessment with GPS data, injury history, and tactical fit analysis.
Comprehensive player databases democratize scouting by giving smaller clubs access to performance data previously available only to elite organizations with large scouting networks. Platforms that integrate opponent scouting with player recruitment analysis provide clubs with unified talent identification workflows.
Platform teams at sports analytics companies face a fundamental question: build analytics infrastructure internally or embed a specialized analytics platform?
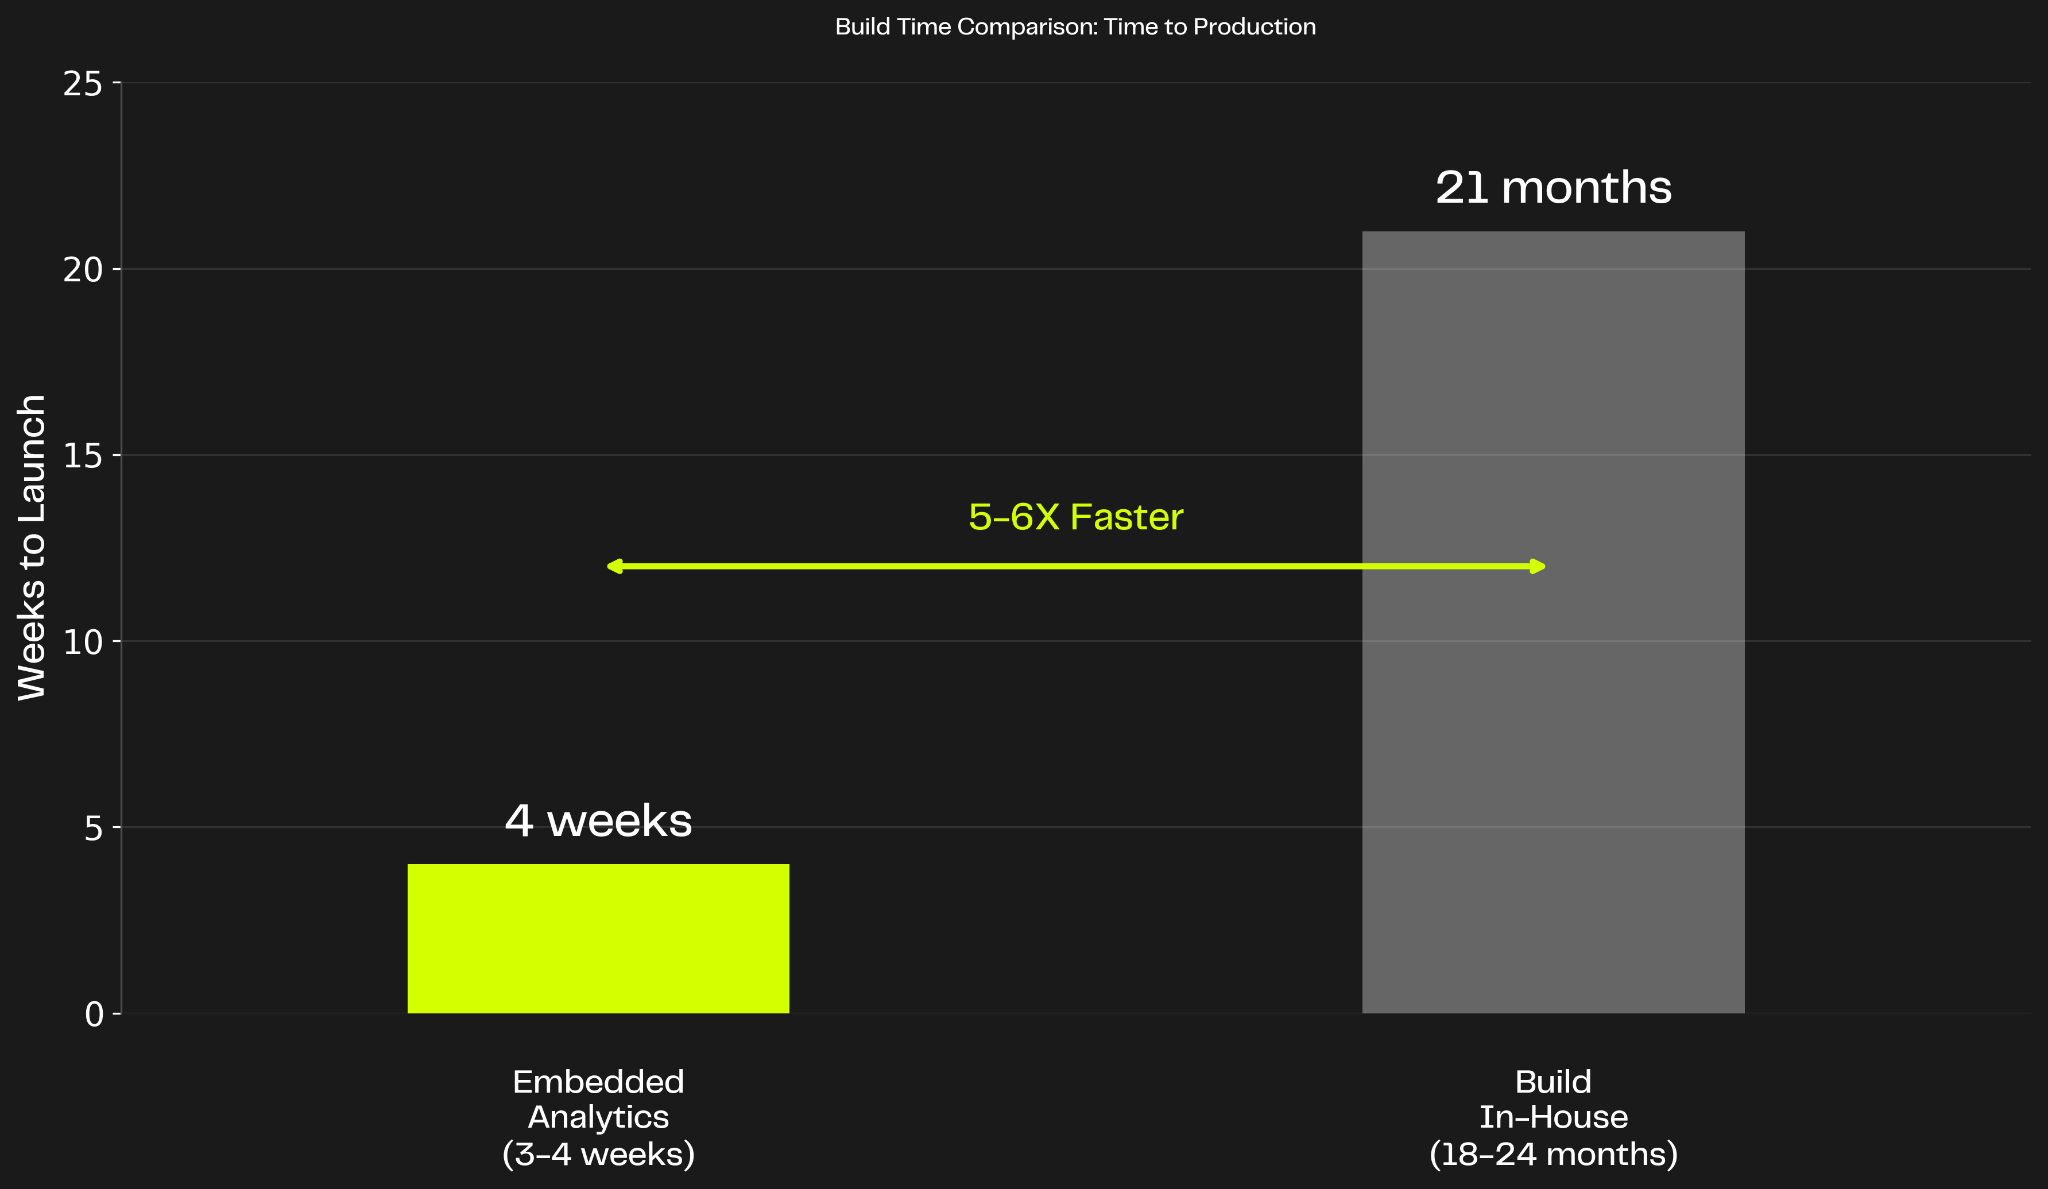
Building internal analytics for multi-tenant sports platforms means assembling a comprehensive stack: a modern BI layer handling millions of GPS data points per game, multi-tenant architecture with perfect team isolation, real-time data pipelines ingesting streams from wearables and video, sport-specific KPI templates for football, basketball, rugby, and more, and mobile-optimized interfaces for sideline coaching.
The timeline stretches 18-24 months from concept to production-ready. Initial development costs run $1.2 million to $2 million in engineering time. The team needs specialized skills: sports domain expertise understanding tactical metrics, real-time data engineering handling GPS and biometric streams, multi-tenant architecture design ensuring team isolation, and mobile-first frontend development optimizing for tablets and phones.
Ongoing costs compound. You need a dedicated team for maintenance, sport-specific feature development, and performance optimization. Every new sport requires custom metric development. Video integration with real-time sync demands continuous work as source formats evolve.
Opportunity cost hits hard. Those 18-24 months could have been spent on GPS hardware improvements, AI-powered injury prediction models, or automated video analysis that actually differentiates your platform. The engineering team building dashboards isn't building the sports technology that creates competitive advantage.
Embedding specialized analytics platforms like Luzmo offers a dramatically different timeline and cost structure.
Week 1-3 covers data integration—API connections to GPS devices, wearable sensors, and video platforms, historical data import from existing systems, and team roster setup with player hierarchies. Week 4-5 handles multi-tenant configuration establishing team isolation rules, role-based permissions for coaches, medical staff, and players, and custom KPI templates per sport. Week 6-7 focuses on dashboard customization with sport-specific metrics and visualizations, team branding, and mobile/tablet interface optimization. Week 8 completes pilot and rollout through beta testing with 2-3 teams, coach training sessions, and full league deployment.
Total time: 3-4 weeks to production-ready analytics. Total cost: $60,000-$100,000 annually depending on data volumes and team count.
The vendor handles updates, performance optimization, new sport templates, and mobile interface improvements. Your team focuses on GPS accuracy, injury prediction algorithms, and video analysis automation that actually differentiates your sports platform.
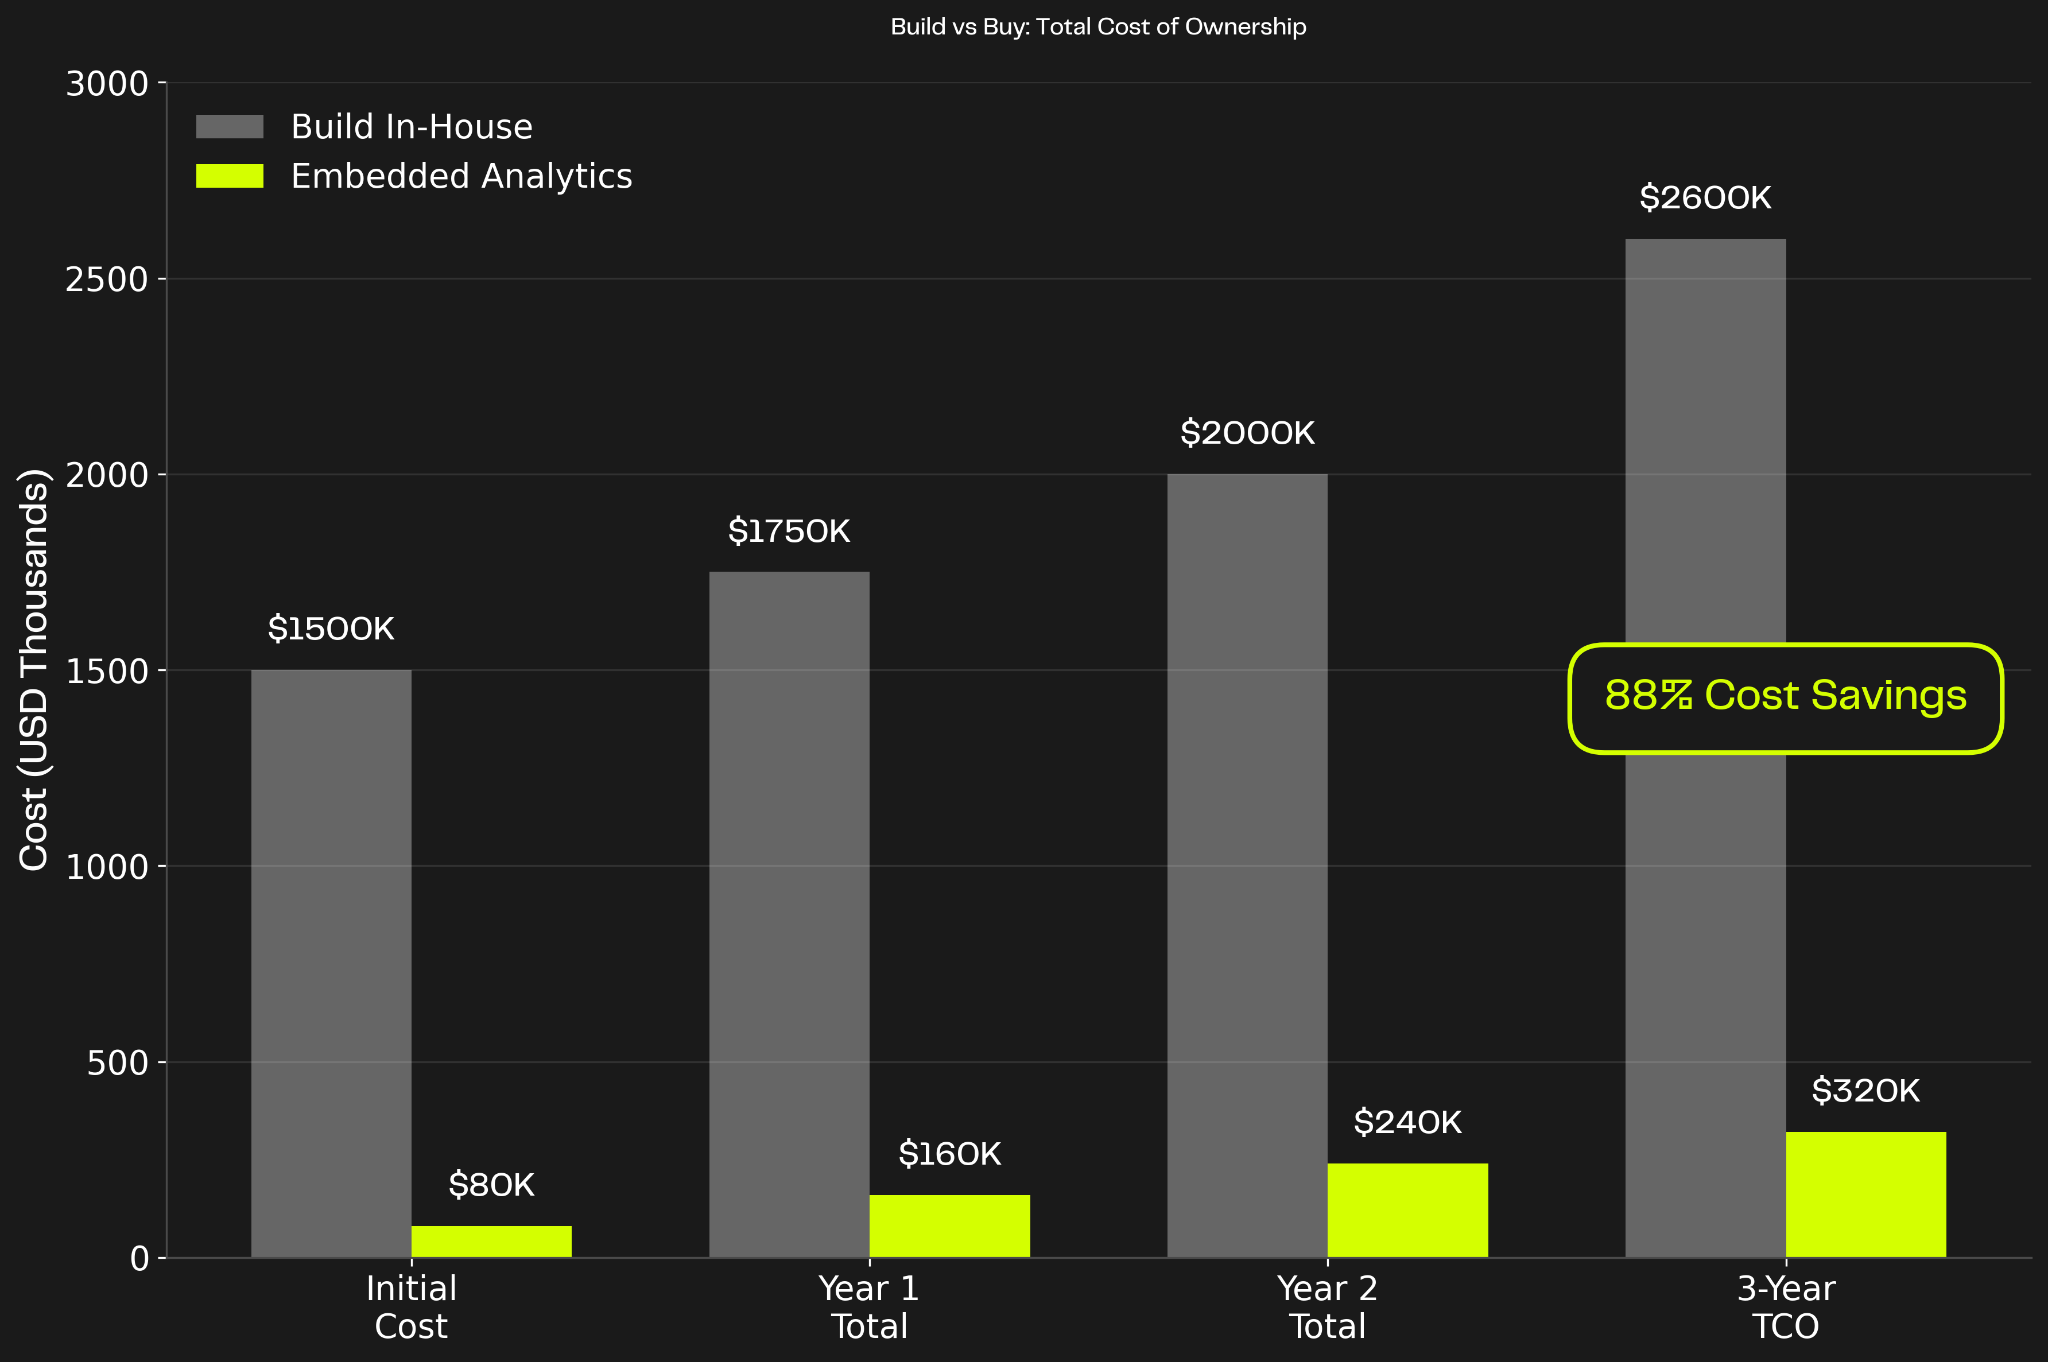
The cost comparison is stark. Build in-house: $1.5 million initial plus $300,000 annual maintenance. Embed specialized platform: $80,000 annually. The embedded solution achieves 88% cost savings while delivering 5-6X faster time-to-market.
Luzmo was built for exactly this use case: product teams at B2B platforms that need to embed analytics without becoming analytics companies themselves.
Row-level security ensures perfect data segregation between teams. Each team gets isolated dashboards, custom permissions, and separate reporting—all managed from a single deployment. Coaches never worry about seeing rival team data, and league admins get cross-team visibility without compromising team privacy.
Sub-second query latency handles millions of GPS data points without lag. Pre-built connectors integrate with major GPS tracking systems, wearable sensor platforms, and video analysis tools used across professional and amateur sports. The coach's sideline tablet updates in real-time as player metrics stream from the field.
Interfaces automatically adapt to tablets, phones, and desktop monitors. The coach's 10-inch tablet shows readiness scores and substitution recommendations. The analyst's 27-inch monitor displays detailed heatmaps and tactical breakdowns. The player's phone presents personal metrics and recovery guidance. All powered by the same data, optimized per device.
No-code interface lets coaches build sport-specific metrics without engineering support. A football coach creates a "pressing intensity" KPI combining high-speed running distance, defensive actions, and positional heatmaps. A basketball coach builds a "defensive impact" metric synthesizing contested shots, deflections, and opponent shooting percentage. The platform handles the calculation and visualization.
Pre-built dashboards for football, basketball, rugby, baseball, and other major sports accelerate deployment. Each template includes standard metrics (sprint distance, heart rate zones, injury risk indicators) while supporting customization for team-specific tactical philosophies.
The same architecture serves youth academies with 5 teams and professional leagues with 100+ franchises. Multi-tenant performance doesn't degrade as team count increases. League administrators manage hundreds of teams from a single control panel.
Security certifications ensure player data protection meets professional league standards. Compliance with GDPR for European clubs, state privacy laws for US organizations, and athlete-specific data protections gives legal teams confidence in platform security.
You're building in a market where hardware specs have commoditized. GPS accuracy, video resolution, wearable sensor quality—these are table stakes. The competitive differentiation happens in the analytics layer: which platform turns raw data into coaching decisions faster, more accurately, and with better multi-tenant isolation.
Your platform competes on four dimensions: data integration breadth (how many wearables, video sources, and tactical systems connect seamlessly), real-time performance (latency kills coaching decisions), team isolation quality (data leaks end contracts), and mobile experience (coaches use tablets on sidelines, not desktop computers).
Market consolidation shows analytics quality drives M&A activity. Platforms recognize that embedded analytics capabilities—not hardware specifications—determine competitive advantage and exit valuations.
Without embedded analytics infrastructure, your platform delivers:
With embedded analytics infrastructure, your platform delivers:
The platform choice determines your business model. Generic tools support basic video analysis subscriptions. Sophisticated analytics enable premium pricing tiers, league-wide contracts, and retention through data lock-in that compounds over seasons.
If you're building a sports analytics platform, you face a decision point. The market is growing—projected to reach $4.75 billion by 2030 with Asia Pacific advancing fastest at 28.69% CAGR through 2031 as cricket franchises and esports organizations adopt professional-grade analytics infrastructure.
Your customers' expectations are accelerating. Real-time insights during matches are now standard at elite levels and rapidly becoming expected at semi-professional and amateur levels. Multi-tenant isolation requirements are non-negotiable as leagues demand perfect data segregation.
Option 1: Build analytics infrastructure in-house
Option 2: Embed proven analytics infrastructure
The question isn't whether your platform needs embedded analytics. The market has answered: coaches switching between platforms cite analytics quality as the top decision factor—not GPS accuracy, not video resolution, but which platform delivers better insights when those insights matter.
The winner in sports analytics will be whoever makes team isolation seamless, real-time performance tracking instant, and coach decision-making data-driven without 24-month build timelines diverting engineering from core differentiation.
The technical foundation exists. The business case is clear. The only question is whether your product team will deploy it before competitors do.
Coaches don't switch platforms for better video. They switch for better insights.

All your questions answered.
Build your first embedded data product now. Talk to our product experts for a guided demo or get your hands dirty with a free 10-day trial.


