Data Analytics Strategy: What it Is and How to Build One

For most companies, becoming data-driven doesn’t happen overnight. No CEO or CTO wakes up one day and decides that more or better data will help them crush their business goals. In reality, data can do a lot for your decision-making processes. But you have to put in the hard work first.
You need to create a data analytics strategy before you set metrics for every imaginable process and role. This shapes how you collect data, why you collect and analyze it, and what your end goal is.
What is a data analytics strategy?
A data analytics strategy is a plan that outlines how an organization collects, analyzes, and uses data to empower data-driven decision-making to achieve business goals.
A data analytics strategy is the key difference between an organization that collects data for the sake of collecting data and one that uses it for strategic insights and ways to improve day-to-day operations.
For example, a data analytics strategy for your business could be to collect customer feedback (in the form of in-app NPS surveys) to improve customer satisfaction and increase retention.
What does a data analytics strategy include?
Before we give you a full blueprint of a data analytics strategy, let’s discuss what it should include to provide insights for your business.
Business objectives: the main goals the organization wants to achieve through data analytics.
Data collection: methods, tools, stakeholders, and other details on data collection.
Technology and tools: analytics, visualization, data integration sources, etc.
Data governance: policies for data security, privacy, and data control.
Analytics approach: determining the type of data analytics to use: descriptive, diagnostic, predictive, or prescriptive.
Talent and skills: who you have on your team to help you build out a strategy.
Execution and scaling: how the strategy will be implemented and scaled over time, with tangible KPIs.
How to build a data analytics strategy, step by step
You don’t need a verifiable degree in data science or previous experience with analytics tools to build a data analytics strategy from scratch. It’s a bit like the higher education journey: students without insider knowledge often work with college admissions consultants, who help them translate strengths into winning applications and navigate the complex admissions process with confidence.
Here’s how you can go from raw data to better decisions.
1. Define your business objectives
Your analytics initiatives should align with your overarching business goals. Before deciding what to do with your organization’s data, talk to key decision-makers in your business and ask them about their biggest challenges.
Are you trying to increase customer retention, lower churn, optimize and automate operations or something else? Based on these objectives, you can set goals and key performance indicators for success.
2. Assess your existing data capabilities
In other words, take a good look at your processes around data. What data do you collect and how? Who has data access and what happens once data is collected?
Doing an audit of your processes before starting can help you prepare a better data analytics roadmap.
3. Identify the data you need
If you took care of the previous steps, you know exactly what type of data you need to power up your data analytics strategy.
For example, if you want to increase sales, these are some of the metrics you’ll need to make better business decisions:
- Total revenue
- Percentage of revenue from new business
- Percentage of revenue from existing customers
- Conversion rate
- Cost of selling
- The average length of the sales cycle
- Market penetration
- Win rate
And others. Listing out the data you need makes the data collection process easier because you’ll know which tools (or stakeholders) to reach out to when you need to collect this data.
4. Choose the right tools and technology
If you don’t already have a BI tool you’re using for data analysis and visualization, now is the time to do the painstaking task of choosing the right one. Power BI, Tableau, Domo, and Qlik, are some of the most common tools in the business.
Evaluate your business needs and choose a tool that will be easy to implement and that can scale with your business. For example, Tableau and Power BI are known as enterprise data analytics tools that can cost a pretty penny and take a long time to implement fully. Modern embedded analytics platforms like Luzmo Studio offer a faster and more flexible approach, allowing teams to build and embed dashboards directly into their applications, while Luzmo IQ and Luzmo AI help users explore data, generate visualizations, and uncover insights using AI-powered and natural language interfaces. This makes analytics more accessible across your organization without requiring complex setup or dedicated BI teams.
5. Define data governance policies
Determine how you manage data assets, especially if you collect classified information from your customers. Establish guidelines for data privacy, such as GDPR and CCPA. Define who is in charge of data security, quality assurance, and control, as well as ownership.
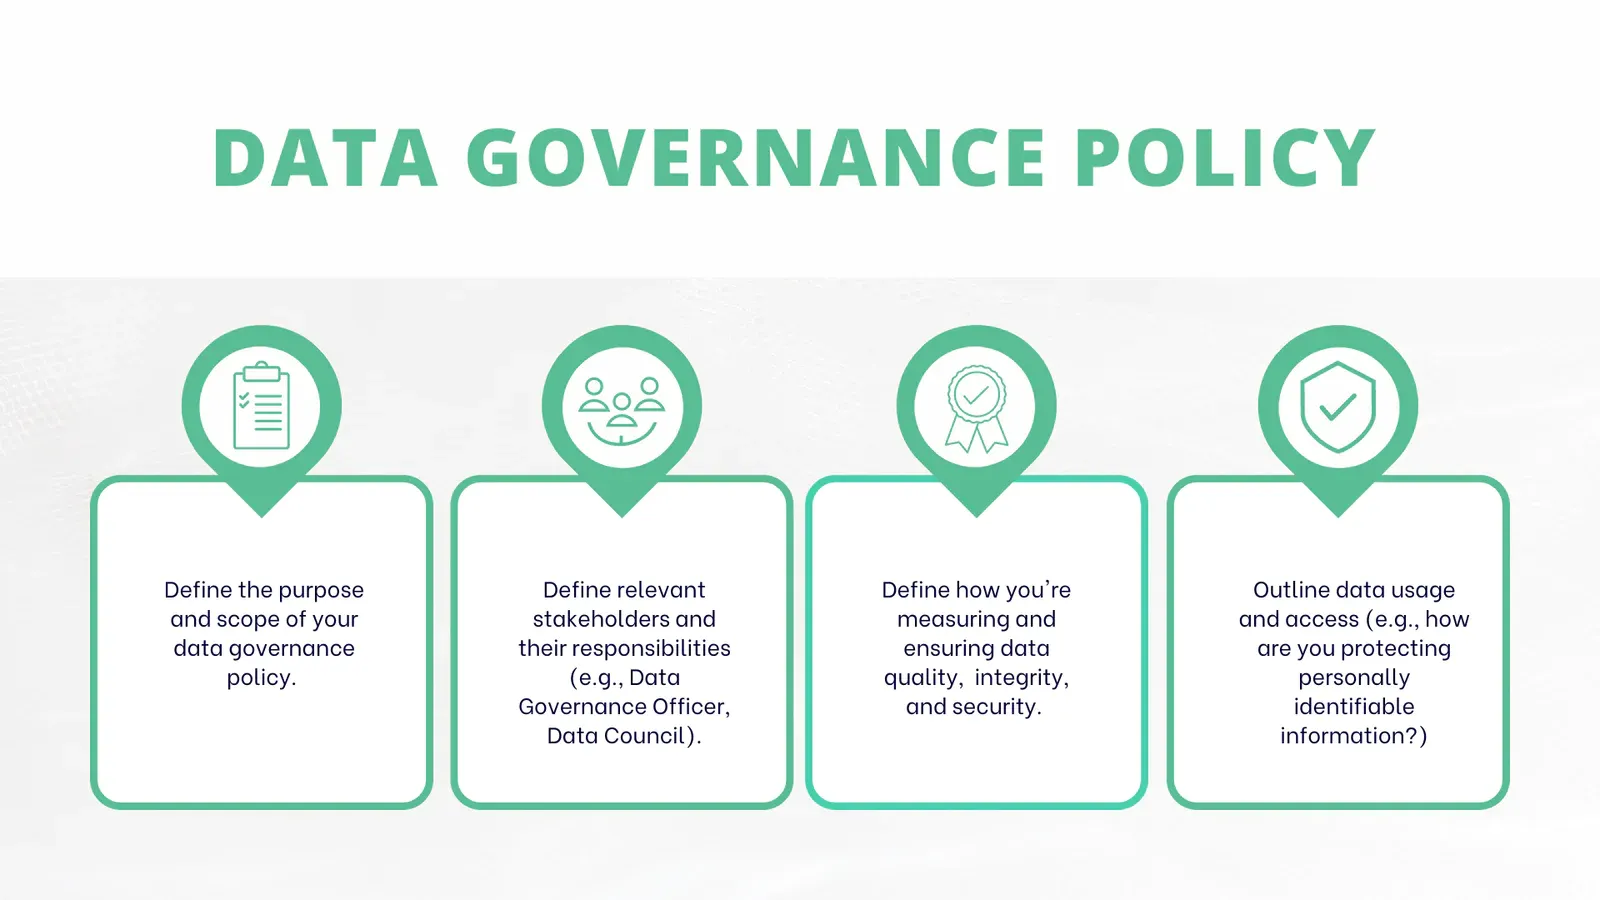
As part of your data management initiative, define roles and responsibilities in your team.
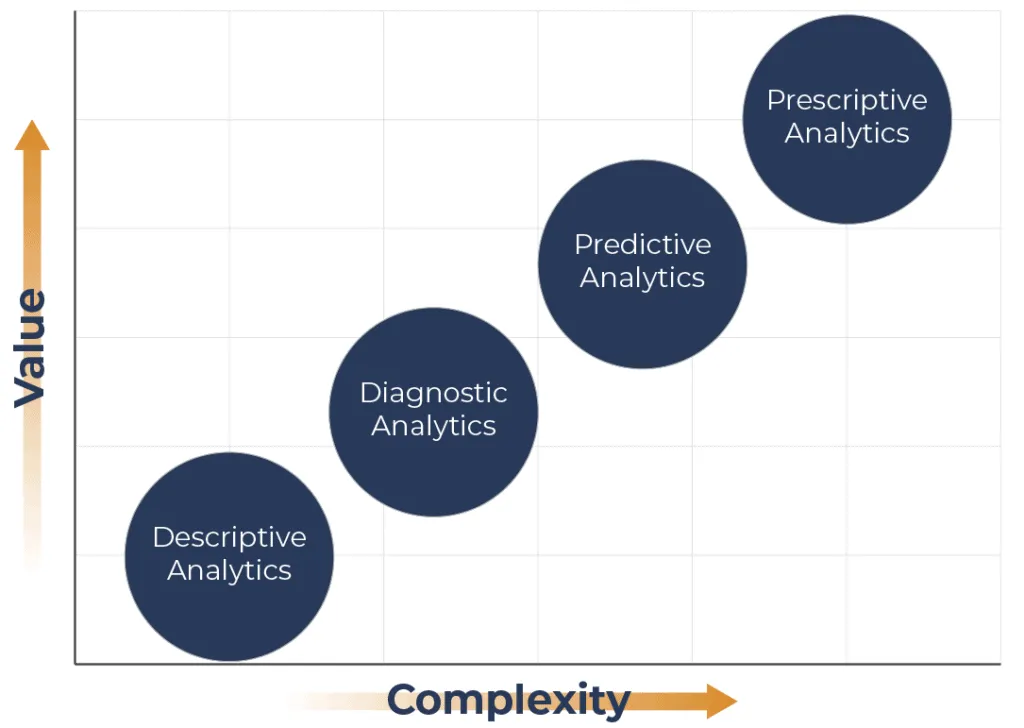
6. Choose the type of analytics
Depending on your potential use cases, you can opt for one of the many types of data analytics:
- Descriptive (describes what happened)
- Diagnostic (explains why something happened)
- Predictive (gives predictions on what will happen in the future)
- Prescriptive (gives actionable insights on what to improve in your business strategy to achieve your desired results)
7. Develop a skilled team
With all the steps so far, you can determine what skills and competencies you need to make this data analytics strategy come to life. For example, you may need a team of data scientists, engineers, and analysts if you want to tackle complex processes and business intelligence tools like Power BI.
If on the other hand, you have ready data sources and need something like real-time data visualizations, you can get by with upskilling your team and getting a tool such as Luzmo.
8. Implement data-driven processes
If your entire organization is collecting data, they need to see practical value from it. Unfortunately, just data points are not enough for actionable insights.
This is why you need to create dashboards, reports, and automated workflows to show your team the value of business analytics. This way, they can understand the numbers they’re seeing and make data-driven decisions quickly.
9. Set clear KPIs
To find out if your data analytics strategy is working, you need to set clear KPIs for success. For example, if your aim is to increase revenue, you can tie success to metrics such as sales volume, MOM growth, average customer lifetime value, and others.
You’ll get a clear overview of progress and you can use real-time data for more data-driven decision-making.
10. Scale and optimize
Over time, you can see if your new data analytics strategy has business value or if it’s collecting data for its own sake. Simply collecting data may not be enough and your data analytics strategy may not be enough to provide real value, but this is no sign to give up. Instead, you should find roadblocks and scale and optimize your strategy.
Some ways you can do this include:
- Improving the data quality
- Introducing generative AI and machine learning for easier forecasting
- Trying out new data sources
- And others
11. Foster a data-driven culture
Throughout your organization, encourage stakeholders to use data in their business processes. From the CEO to the sales rep, using the data sets from your analytics strategy gives you a competitive advantage and insights on what to improve to achieve better results and business outcomes.
5 good practices for building a data analytics strategy that actually works
Everyone wants to be “data-driven.” Investors expect it, customers assume it, and most employees—at least in theory—prefer decisions made with evidence rather than gut feel. Yet, for most organizations, “data analytics strategy” can still feel like an awkward mashup of wish lists, disconnected dashboards, and tools nobody quite trusts.
Why? Because turning raw data into real business value is a practice, not a one-off project. It’s a muscle you build and maintain, not a software you buy. Here’s how the most successful companies (from SaaS startups to global enterprises) approach building a data analytics strategy that doesn’t just gather dust, but delivers results every day.
1. Start with business questions, not with data for data’s sake
It’s tempting to start your analytics journey with what you have (“Let’s see what we can do with these 54 Salesforce fields and a giant Google Sheet”). But the best analytics strategies start from the top:
What are the burning questions your business faces right now? What decisions get stuck because the answers aren’t clear? Are you trying to break into a new market? Reduce churn? Identify your most profitable segments?
Let business strategy set the agenda. When you know which decisions you want to make smarter, you can work backward to find the data that matters. This keeps analytics from turning into an endless science project.
**Example:
**If a SaaS company’s biggest pain is slow onboarding, then metrics like “time to first value” and “activation event completion rate” should be the analytics north star—not generic web traffic stats or social media metrics.
2. Get leadership buy-in and keep it visible
No analytics strategy survives without true sponsorship from the top. Leadership doesn’t just sign the check—they set the tone. When execs ask for data in every meeting, highlight wins, and connect analytics to business performance, everyone else follows. It echoes the influence of Google values, where data-backed decisions and transparency are part of the cultural DNA.
It’s not a one-time speech. Keep leadership engaged with regular updates:
- Share stories of how analytics changed an outcome.
- Present metrics that shaped a pivot or product launch.
- Invite leaders to showcase their own “aha moments” from the data.
**Example:
**When the CEO celebrates a quarterly “Data Win”—a key customer saved by a new churn model—analytics suddenly becomes more than an IT cost.
3. Clean, map, and audit your core data before you do anything fancy
Dirty data is the silent killer of analytics. Inconsistent naming, duplicate records, missing fields, conflicting sources—all these little problems snowball fast. Before investing in flashy dashboards, start with a ruthless audit:
- Where are the holes in your CRM, product, or finance systems?
- Are definitions clear, or do teams argue about what “customer” really means?
- Are there multiple versions of the truth?
Invest time upfront to map, clean, and standardize. Set naming conventions, merge duplicates, clarify field usage, and flag unknowns. For social media marketing, reviewing insights using tools like SocialBee helps you refine your strategy, better understand your audience, and track growth while also keeping your data clean and consistent. Sometimes, fixing data flows and definitions unlocks more value than the fanciest BI tool.
**Example:
**A marketing team spent weeks automating a beautiful campaign dashboard—only to realize that 30% of leads were missing country fields, making segmentation impossible. A data cleanup sprint solved more than the tool ever could.
4. Involve business users from day one (and every step after)
Analytics is only as valuable as the decisions it influences. The most powerful dashboards are built with business users—product managers, marketers, finance, support—not just for them.
Interview frontline users about their pain points:
- What do they wish they could answer instantly?
- Where do they lack trust in current numbers?
- What reports go unused—and why?
Make it easy for these users to request changes, give feedback, and help prioritize analytics projects. The more business input you get, the more your analytics will actually get used.
**Example:
**A support manager reveals that the “ticket close rate” is meaningless, but “first reply within 30 minutes” is a game-changer for customer retention. Suddenly, the analytics roadmap shifts.
5. Match your analytics tools to your team’s actual skills and workflows
There’s always a new analytics tool on the horizon—machine learning platforms, self-serve BI, fancy visualizations. But your stack should match your team’s real capacity, not just look good in a Gartner report.
If you have a team of non-technical business users, a low-code, drag-and-drop BI tool beats a complex Python stack that nobody touches. Build for adoption, not aspiration. The best data strategy is the one people actually use.
**Example:
**A growing SaaS company ditched an expensive “data lake” in favor of Google Data Studio and a well-structured BigQuery connection. Result: faster insights, more people building their own reports, and less hand-holding from IT.
Common data analytics mistakes and why they happen more often than you think
If you’ve ever watched a simple metrics review spiral into a full-blown debate, you know: data analytics in growing companies is rarely as neat as the dashboards promise. When you peel back the layers, you’ll usually find a familiar pattern—misaligned reports, mysterious numbers, and “helpful” spreadsheets that create more questions than answers.
How does it happen? It’s not a lack of ambition or technical savvy. It’s usually the absence of standardization—the unsung hero (or missing puzzle piece) behind clean analytics and clear decision-making. Below are the most common analytics slip-ups plaguing teams of every size. If any of these sound familiar, you’re in good company—and closer to a solution than you might think.
1. Apples, oranges, and everyone’s favorite spreadsheet
You’d think “customer” or “deal” means the same thing across departments. But peek under the hood, and you’ll discover:
- Sales counts a “customer” at contract signature
- Finance only counts after the invoice is paid
- Success considers them active if they’ve logged in this month
When it’s time to report on growth, three teams show up with three numbers—each “technically” correct, and all equally useless for a CEO who wants clarity.
**Where it goes wrong:
**Without shared definitions and a master data source, your team spends more energy reconciling numbers than moving them. Standardization here means one clear rule for who counts as a customer, and one source for the final tally. Suddenly, the debate ends before it starts.
2. “Just copy and paste that for now…” (a.k.a. the manual data detour)
Let’s be honest: there’s always that one spreadsheet. The one that lives on someone’s desktop, grows by copy-paste, and occasionally sports filenames like “final_Q3_master_USETHIS_v5.xlsx.” It starts as a temporary fix and becomes a business-critical bottleneck.
**How it happens:
**When data sources aren’t standardized, teams patch holes manually—merging exports from tools, tweaking formulas, or adjusting column headers by hand. It feels efficient in the moment, but one slip or version mix-up can set you back hours (or days).
The pain:
- Data silos multiply, since only one person knows how the file works
- Errors creep in unnoticed (until the CFO calls out a $50k discrepancy)
- Historical data gets lost if the file vanishes or that teammate moves on
Standardization turns those “quick fixes” into real solutions, with repeatable processes, consistent formats, and fewer 2 a.m. email chains about which number is right.
3. The “metrics drift” dilemma
Remember when your team agreed on how to calculate monthly churn, or conversion rates? Fast-forward six months, and somehow, those metrics quietly morphed.
- The product team includes “paused” users
- Marketing counts anyone who clicked a link
- Finance, as usual, has its own gospel
Over time, this “metrics drift” means dashboards stop aligning with reality—or with each other.
**The cost:
**Leaders lose confidence in the data, and teams waste time arguing definitions instead of discussing strategy.
Standardizing metrics—complete with living documentation and clear owner—keeps everyone marching to the same tune, and lets teams focus on the why, not the “wait, which formula did you use?”
4. The Frankenstein dashboard: “Our reports say different things…”
A dashboard here, a dashboard there—everyone gets to build their own. The intent is good: flexibility, speed, tailored insights. But when dashboards aren’t built on shared data models and logic, they end up telling different stories.
What it looks like:
- Sales’ dashboard shows record-breaking growth
- Product’s report says user engagement is flat
- Finance’s chart? “We need to talk.”
Now you’re reconciling dashboards instead of acting on insights.
**Standardization fix:
**Centralized, standardized data sources and templates for reporting. Every dashboard pulls from the same definitions, time frames, and filters—no more “choose your own adventure” analytics.
5. Too many cooks, not enough recipes
When “data-driven culture” becomes a free-for-all, everyone spins up their own dashboards, reports, and tracking systems. Without agreed naming conventions, timeframes, or data dictionaries, simple questions like “How many customers do we have?” spark Slack wars instead of quick answers. This becomes especially problematic in industries like selling electronics, where accurate tracking of SKUs and returns is critical.
Common symptoms:
- Customer counts that change depending on who you ask
- Projects with half-finished tracking, abandoned columns, or undefined tags
- Confusion over which dashboard to present at the next all-hands
**Why it happens:
**With no single source of truth, good intentions lead to chaos. Standardization here doesn’t mean less ownership; it means clear recipes everyone can follow, with room for customization after the basics are set.
6. The wild west of file formats and exports
Ever tried merging data from five sources, only to realize they all use different date formats, naming conventions, and column headers?
- “2024/03/15” in one file, “15-03-2024” in another
- “Revenue” vs. “Total_Sales” vs. “NetAmount”
Before you know it, half your analytics time is spent wrangling exports, not analyzing trends.
The headache:
- Data transformation becomes a project in itself
- Mistakes slip through, because column headers look similar but aren’t
- Quarterly reporting gets delayed—not from analysis, but from data cleanup
Standardized formats and templates, agreed across teams, turn this slog into a seamless flow.
7. Manual reporting overload
Manual reporting creeps in everywhere: weekly dashboards copied from email chains, monthly numbers patched together at the last minute, ad-hoc reports for every new exec question.
Result:
- Analysts become data janitors instead of insight generators
- Reports are out of date before they’re even presented
- Leadership gets frustrated with “why does this keep happening?”
Standardized, automated reporting processes let analysts focus on what matters—finding insights and driving action, not re-inventing the wheel every month. Consider using virtual office management software to automate reporting workflows and reduce manual effort.
8. Losing sight of the “why”
Without standardization, it’s easy for analytics to become a box-ticking exercise. People update dashboards because they’re supposed to, not because the numbers actually help them make better decisions.
The trap:
- Metrics are reported for tradition, not action
- Teams spend more time gathering numbers than using them
- “Analysis paralysis” sets in—so much data, so little clarity
**Standardization impact:
**Clear, relevant metrics tied to business outcomes. Teams know what to track, why it matters, and what actions to take based on the numbers.
9. Compliance and privacy landmines
As your analytics stack grows, so does the risk of data ending up where it shouldn’t. Without standard protocols for access, storage, and naming, sensitive information can slip through the cracks—sometimes unnoticed until there’s a real problem.
Common dangers:
- Personal data included in exports shared via unsecured channels
- Reports containing outdated or incorrect privacy information
- Inconsistent deletion or retention of historical data
**Standardization fix:
**Company-wide protocols for naming, access, retention, and sharing. Make compliance the default, not an afterthought.
10. Burnout and morale drain
Perhaps the most subtle—but devastating—mistake: the hidden cost to team morale.
- Constantly chasing down the “right” number
- Redoing reports that should have been automated
- Feeling unsure if you can trust your own dashboard
Over time, talented people get frustrated and disengaged, and the organization starts to view analytics as a burden, not a competitive edge.
**Standardization antidote:
**Analytics feels like a superpower, not a chore. Teams trust their numbers, move faster, and focus on solving real business problems—because the basics just work.
The “aha” moment: standardization as a relief, not a restriction
If any of these mistakes ring a bell, you’re not alone—every growing company faces these headaches. The real insight is that standardization isn’t about making things rigid or bureaucratic. It’s about giving your teams breathing room:
- One set of definitions = fewer meetings, more decisions
- Agreed templates and formats = less cleanup, more action
- Clear metrics tied to business outcomes = everyone rowing in the same direction
Standardization isn’t a cost—it’s an efficiency engine. Once you have it, you’ll wonder how you ever survived the wild west.
Finance can start small, too—standardize billing by using a free invoice template to keep formats consistent and cut manual edits. Once the basics are repeatable, it’s far easier to automate and scale without sacrificing accuracy.
Practical steps to fix your analytics foundation
Want to start (without scaring people)? Here’s how:
- Map your metrics: Get teams to write down their definitions of key terms. You’ll be amazed at what comes out.
- Pick one KPI to standardize: Don’t boil the ocean. Choose one (e.g., “active user”) and align on a single source, formula, and owner.
- Create a shared data dictionary: Just a simple doc listing names, formulas, and intended use for your core metrics.
- Agree on formats and reporting cycles: Templates for exports, dashboards, and updates.
- Automate what you can: Even basic automation beats manual copy-paste.
- Review, revise, repeat: Make standardization a living process. Celebrate each new win (fewer debates, more insights).
**The result:
**Analytics that doesn’t just look pretty, but actually works for everyone. Less friction, more alignment, and a team that trusts their own numbers—and each other. That’s how analytics becomes a growth engine for business and eCommerce alike.
Because at the end of the day, the best analytics is the one that everyone understands, believes, and uses. And that starts with standardization.
Provide your end-users with a data analytics strategy powered by Luzmo
At Luzmo, we specialize in helping software companies give actionable insights to their end-users. With Luzmo, you can visualize the data from your product so that the business users can see the value your software provides.
Luzmo helps you visualize various types of data from your software in beautiful, functional dashboards for your customers. It’s easy to integrate, has a robust API, and is customizable so it fits into your product’s design and user experience.
Want to learn more? Get a free demo of Luzmo and we’ll answer any questions you may have. Plans start at $495/month for Starter, $1,995/month for Premium, with custom Enterprise pricing available as your data strategy evolves.
FAQ
All your questions answered.
What is the biggest challenge when building a data analytics strategy?
One of the biggest challenges is turning raw data into actionable insights that teams can actually use. Many organizations collect large amounts of data but struggle to visualize it or make it accessible to decision-makers. Tools like Luzmo Studio help solve this by providing embedded dashboards, while Luzmo IQ and Luzmo AI allow users to explore data and generate insights automatically without requiring advanced technical skills.
Do you need a full data team to implement a successful analytics strategy?
Not necessarily. While large organizations often rely on data engineers and analysts, modern analytics tools make it easier for business users to access insights independently. Platforms like Luzmo Studio allow teams to build dashboards with minimal technical effort, while Luzmo IQ and Luzmo AI enable users to analyze data, ask questions, and generate visualizations using AI-powered interfaces.
How do dashboards help organizations become more data-driven?
Dashboards help organizations track key metrics, monitor performance, and identify trends in real time. By visualizing data clearly, teams can make faster and more informed decisions. With tools like Luzmo Studio, dashboards can be embedded directly into software products, while Luzmo IQ and Luzmo AI enhance analytics by automatically generating insights and helping users explore their data more efficiently.
Written by

Ship the future of your data
Let us show you what Luzmo can do for your product.

Leave your e-mail and one of our analytics experts will reach out to you