 ChatGPT
 Perplexity
.png)
.png)
.png)
Build your first embedded data product now. Talk to our product experts for a guided demo or get your hands dirty with a free 10-day trial.

.png)
The e-commerce platform market is exploding. From $11.6 billion in 2025, the industry is projected to reach $61.8 billion by 2034—a 20.5% compound annual growth rate driven by rising digital commerce adoption, AI integration, and the shift toward mobile-first shopping experiences. But in this crowded market where Shopify, BigCommerce, WooCommerce, and dozens of emerging platforms compete for merchant share, one feature has become the silent differentiator: merchant analytics.

Merchants don't just want a platform to sell products. They want to understand their business. They want to know which products drive revenue, which marketing campaigns convert, which customers are most valuable, and whether they're trending up or down. When platforms fail to deliver these insights—or bury them behind clunky interfaces and support tickets—merchants churn. When platforms get analytics right, they unlock premium tier revenue, reduce support costs, and build sticky, long-term relationships.
This article breaks down why merchant analytics has become the retention battleground for e-commerce platforms, which infrastructure challenges kill in-house builds, and how embedded analytics solutions like Luzmo let platforms ship best-in-class dashboards in weeks instead of months.
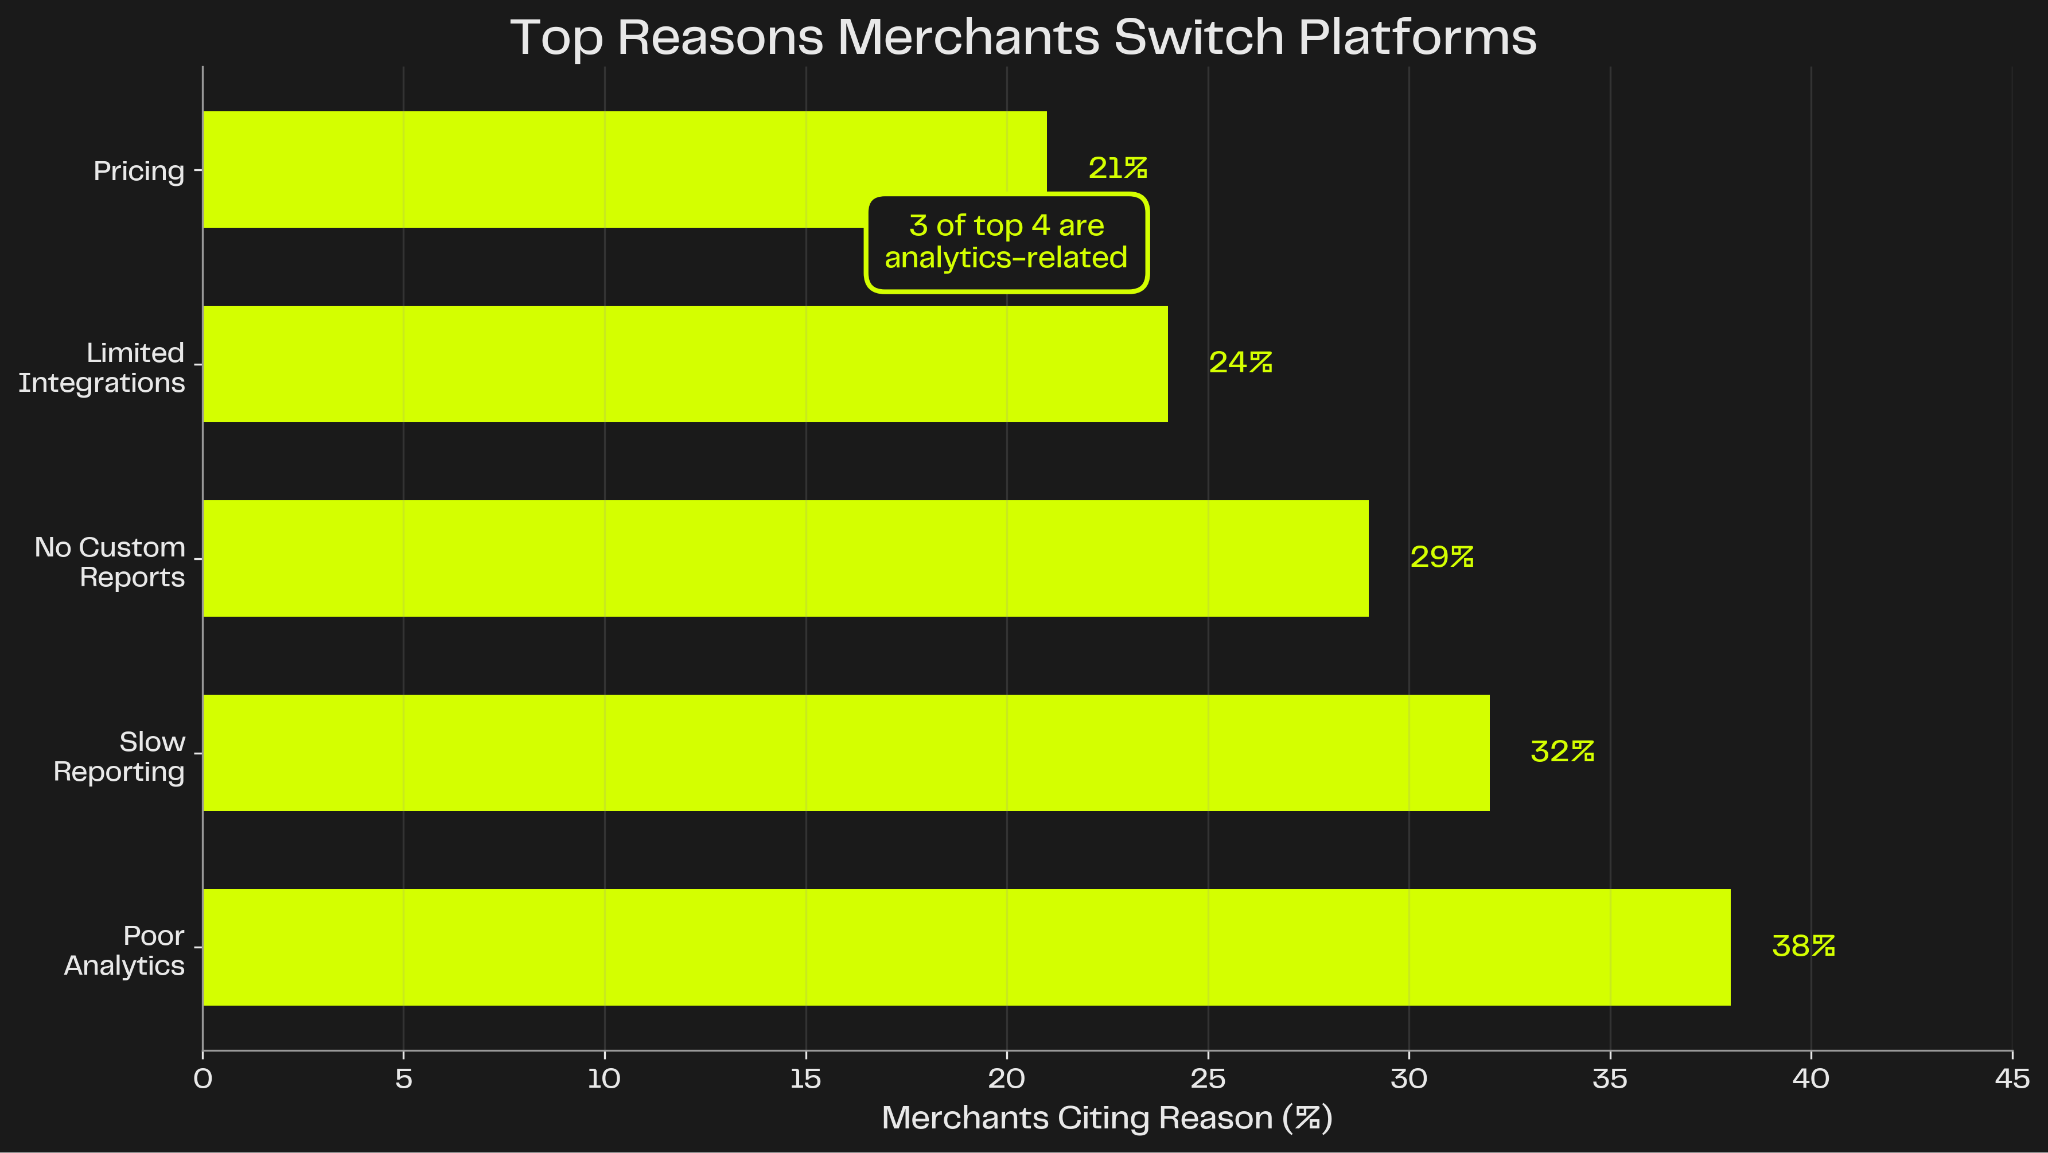
Here's the uncomfortable truth: 38% of merchants cite poor analytics as their primary reason for switching platforms—more than pricing, more than integrations, more than anything else. When you add slow reporting (32%) and lack of custom reports (29%), analytics-related frustrations account for three of the top four churn drivers in the e-commerce platform space.
Merchants live in their dashboards. A Shopify store owner checking daily sales. A WooCommerce merchant tracking inventory levels. A BigCommerce enterprise user analyzing multi-store performance. These aren't nice-to-have features—they're the operational heartbeat of running an online business.
When merchants can't answer basic questions like "How are my sales today?" or "Which products are moving fastest?" without opening a support ticket or exporting CSVs into Excel, frustration builds. Support teams get flooded with repetitive analytics requests. Merchants start evaluating competitors. Churn begins.
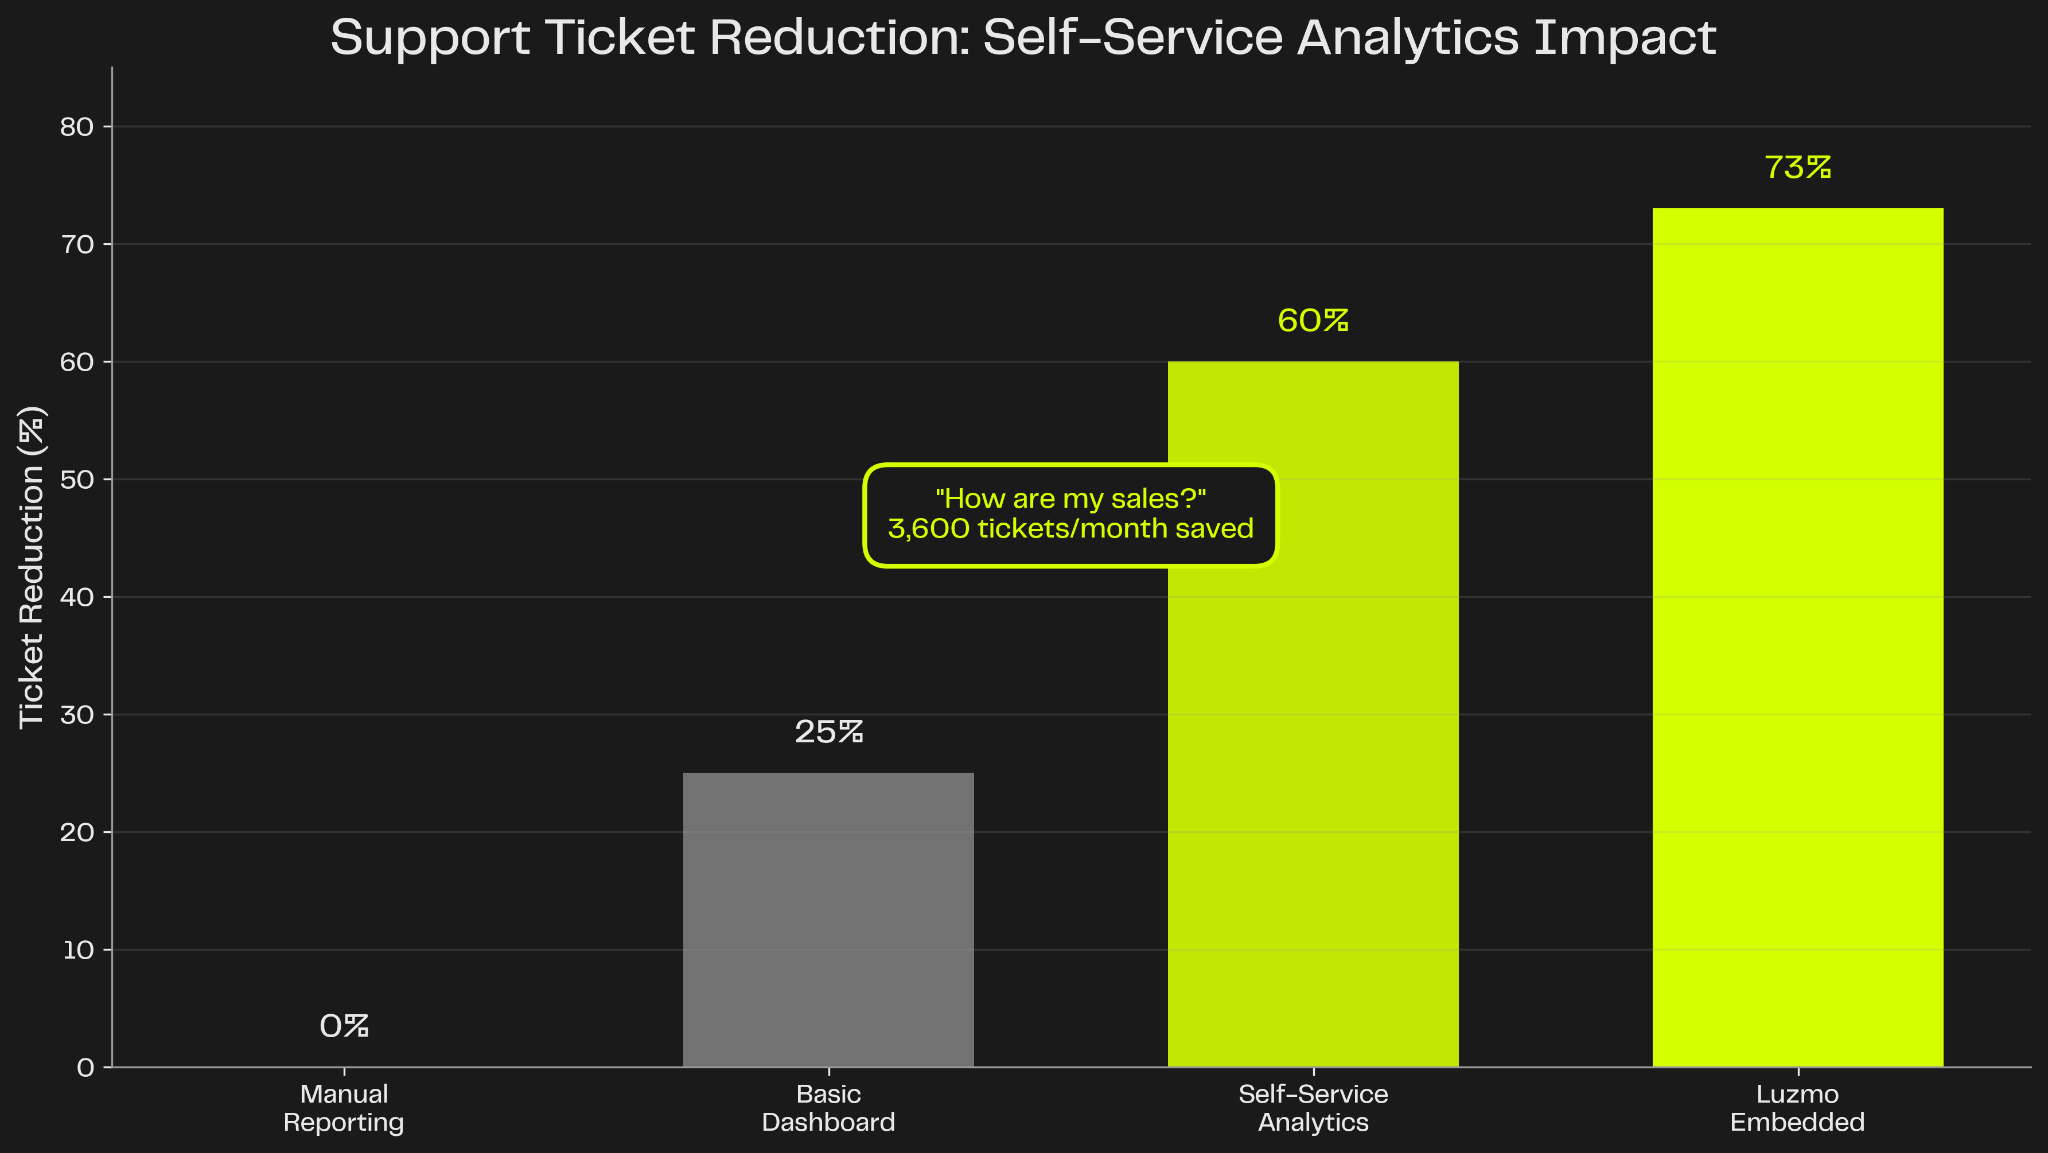
The gap isn't just about having analytics—it's about having self-service analytics that merchants can explore independently. According to research on support ticket deflection, platforms that implement robust self-service analytics reduce support volume by 60-70%,directly translating to lower operational costs and higher merchant satisfaction.
Most platform teams underestimate how complex merchant analytics becomes at scale. Building a basic sales chart is straightforward. Building a white-labelable, multi-tenant, real-time analytics infrastructure that scales to millions of merchants? That's an entirely different engineering challenge.
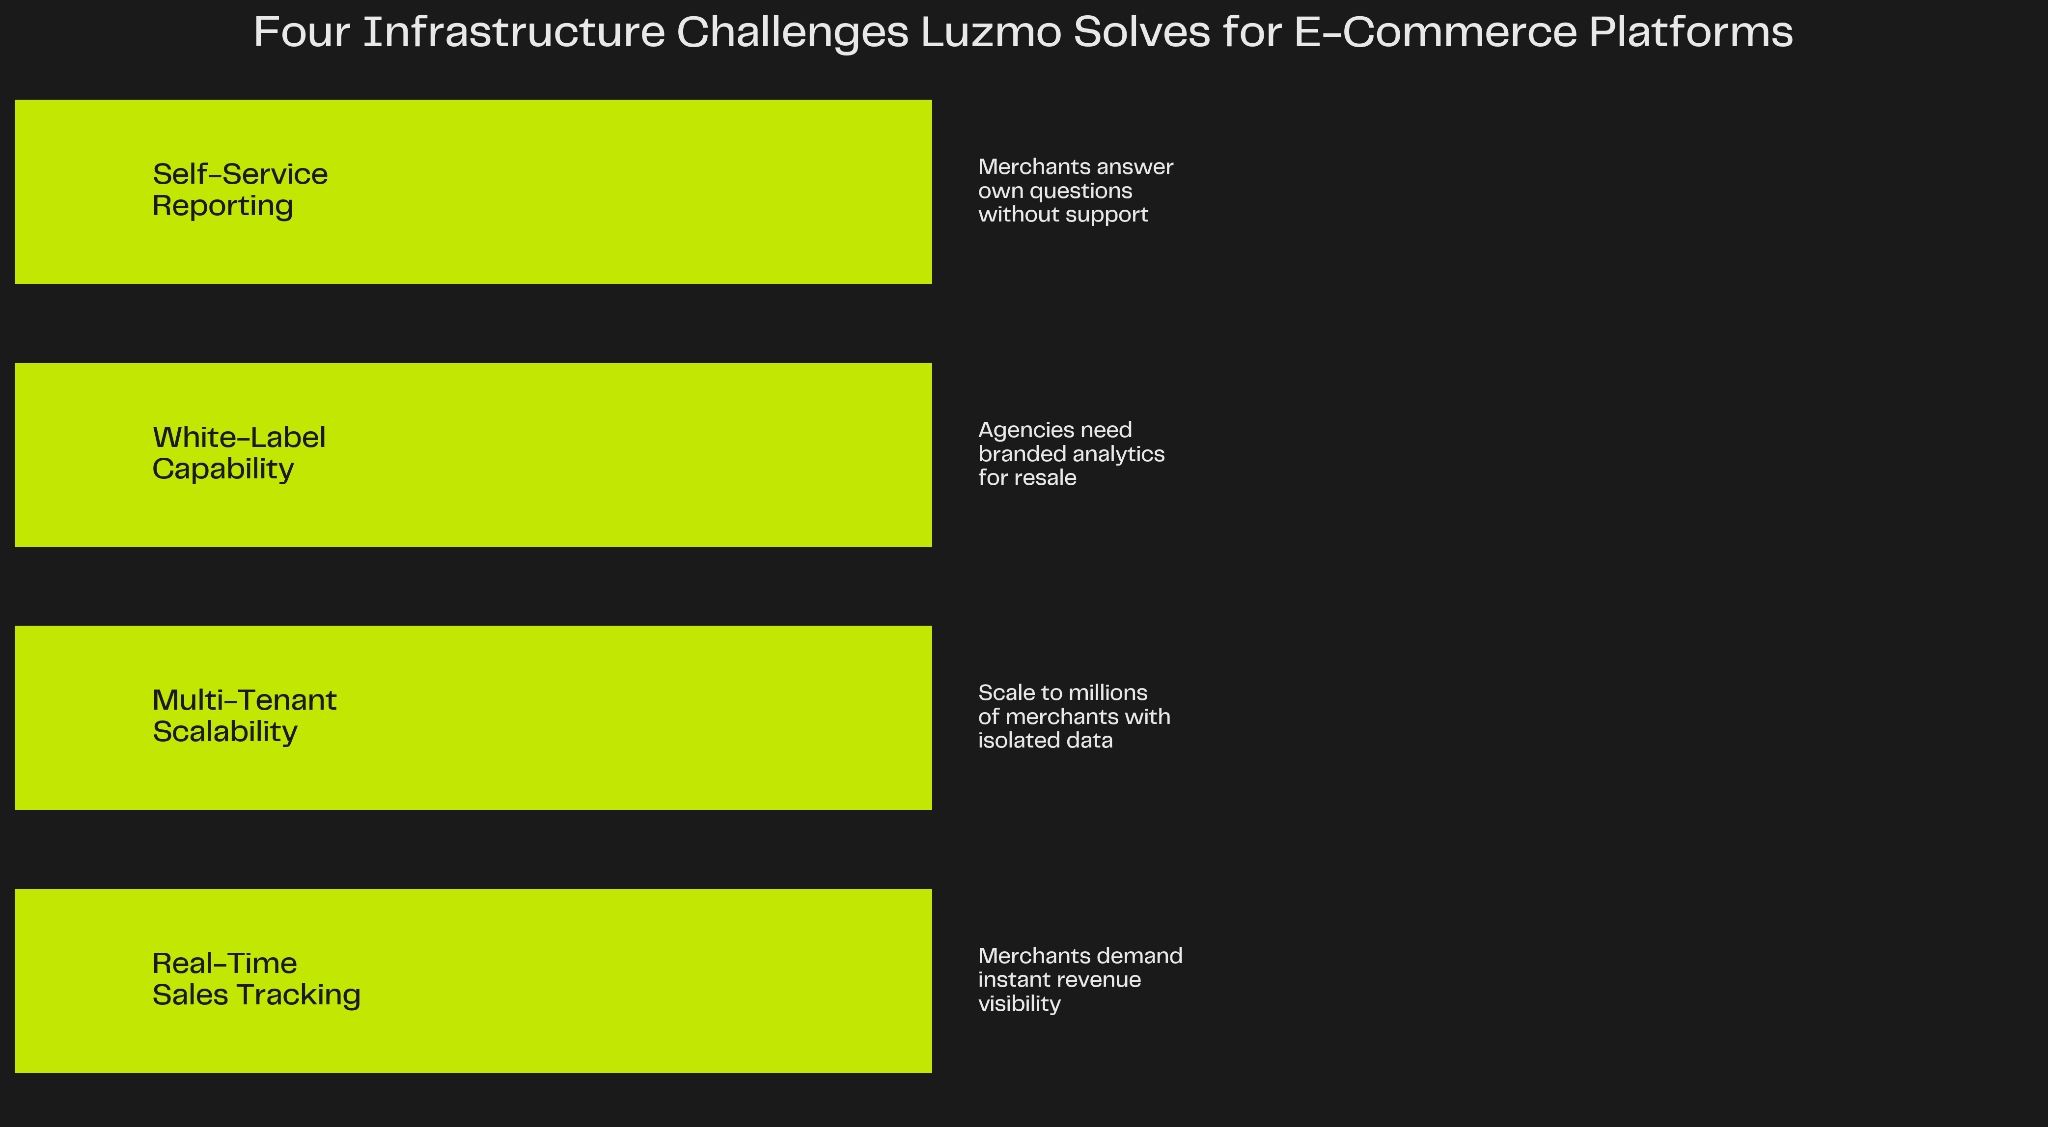
Merchants demand instant visibility into revenue, orders, and conversion metrics. Batch processing that updates dashboards once per hour feels broken in 2026. Real-time streaming data pipelines, event-driven architectures, and low-latency query optimization become table stakes.
Building real-time infrastructure means:
This infrastructure takes experienced engineering teams 6-9 months to build and stabilize.
Every merchant's data must be isolated. A bug that leaks Merchant A's sales data to Merchant B is a catastrophic compliance and trust failure. Multi-tenancy requires:
Building secure, scalable multi-tenant analytics infrastructure typically adds 3-6 months to project timelines.
Many e-commerce platforms serve agencies that resell branded storefronts to their clients. Those agencies need merchant analytics that display their branding—not the platform's logo, not generic charts.
White-labeling requires:
This level of customization often takes 2-4 months to implement properly and becomes a maintenance burden as design systems evolve.
Merchants don't want to wait for the platform's product team to build the one report they need. They want drag-and-drop report builders, customizable filters, and the ability to answer their own questions.
Self-service analytics means:
Building a true self-service layer—one that doesn't require SQL knowledge or engineering intervention—typically takes 4-6 months and ongoing iteration based on merchant feedback.
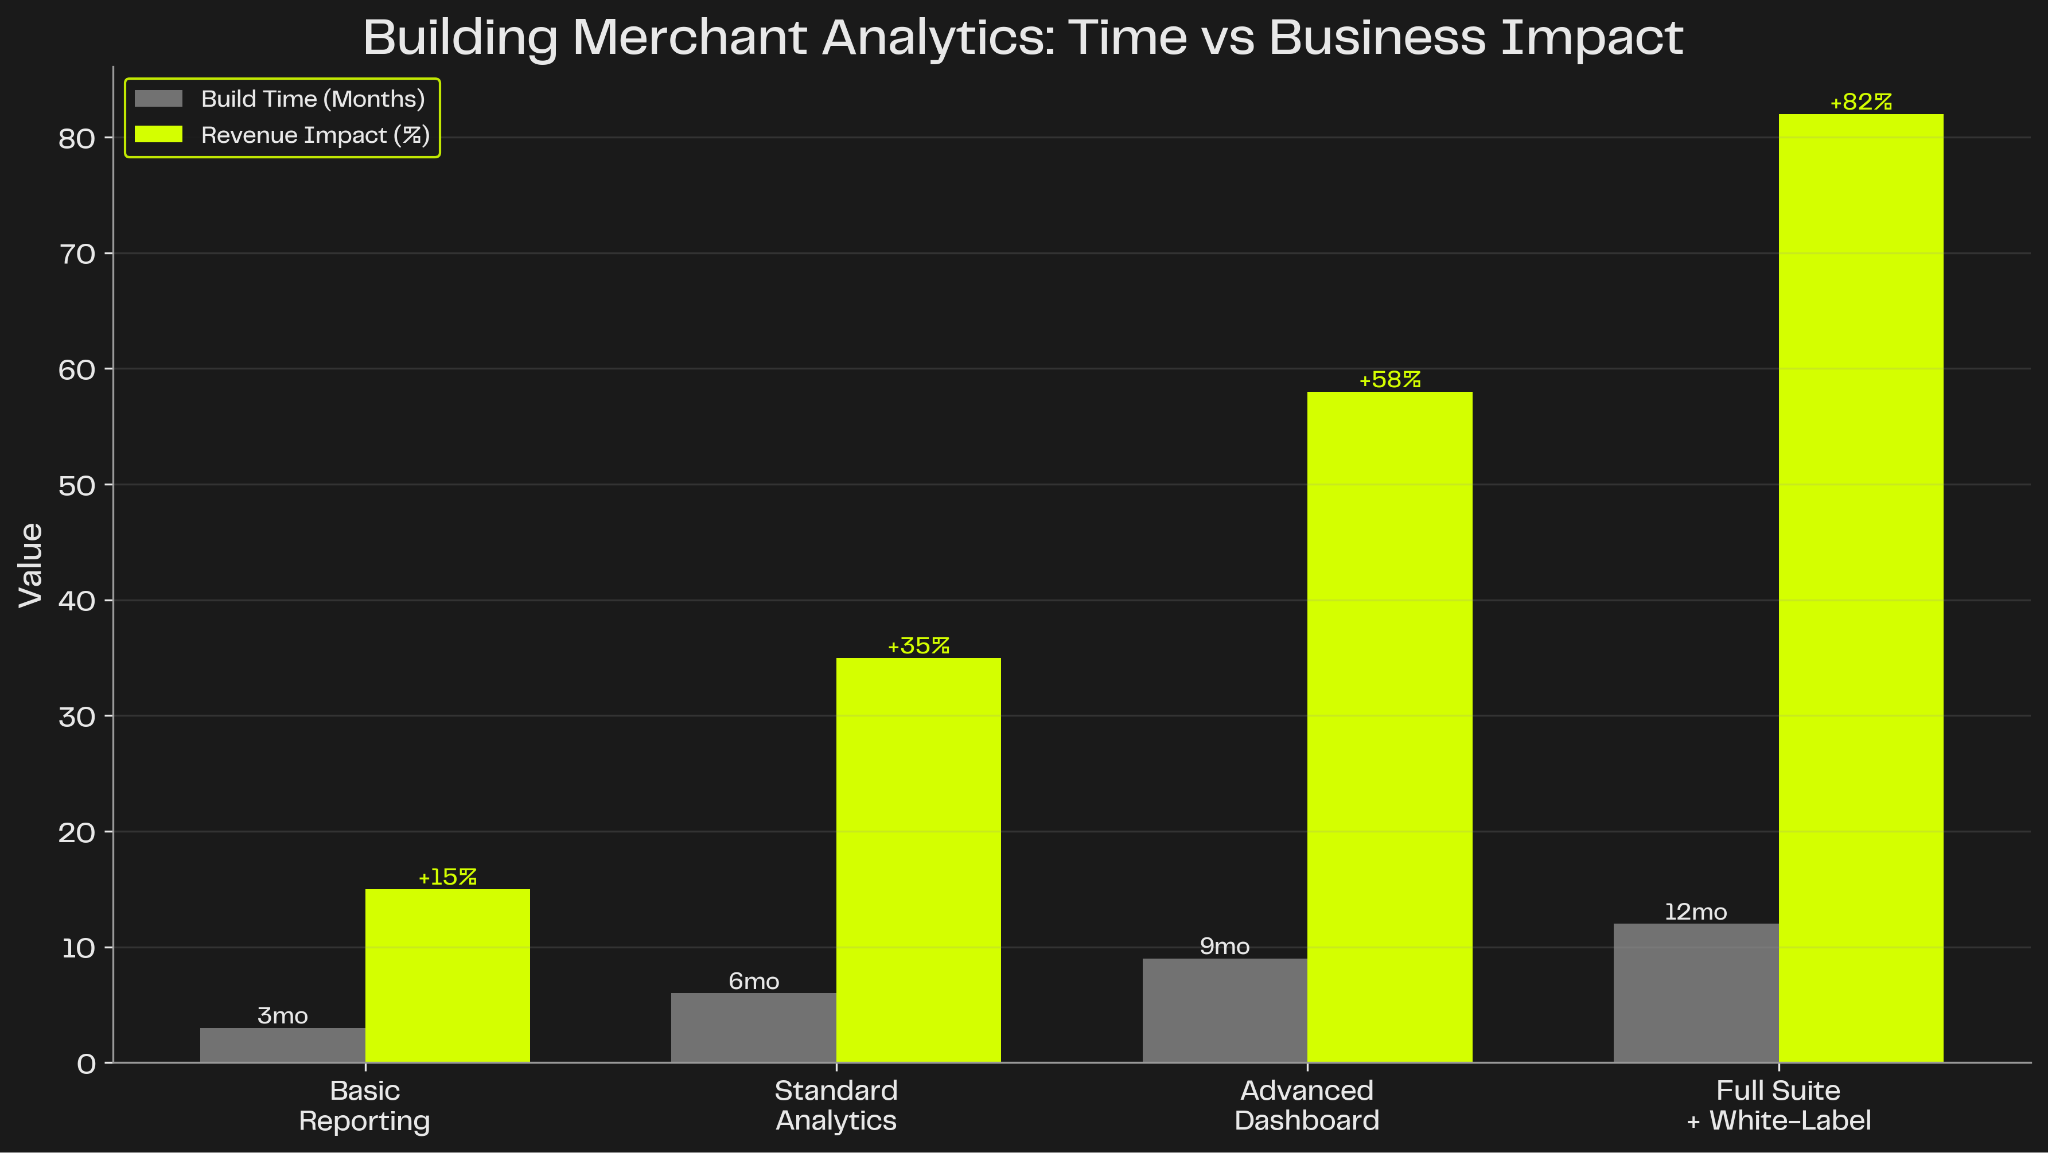
When you add up these timelines, building merchant analytics in-house becomes a 6-12 month commitment before you ship anything to merchants. And that's just the initial build—maintenance, bug fixes, and feature requests continue indefinitely.
Merchant analytics isn't just a retention play—it's a revenue driver. Platforms that embed robust analytics capabilities unlock three direct monetization opportunities:
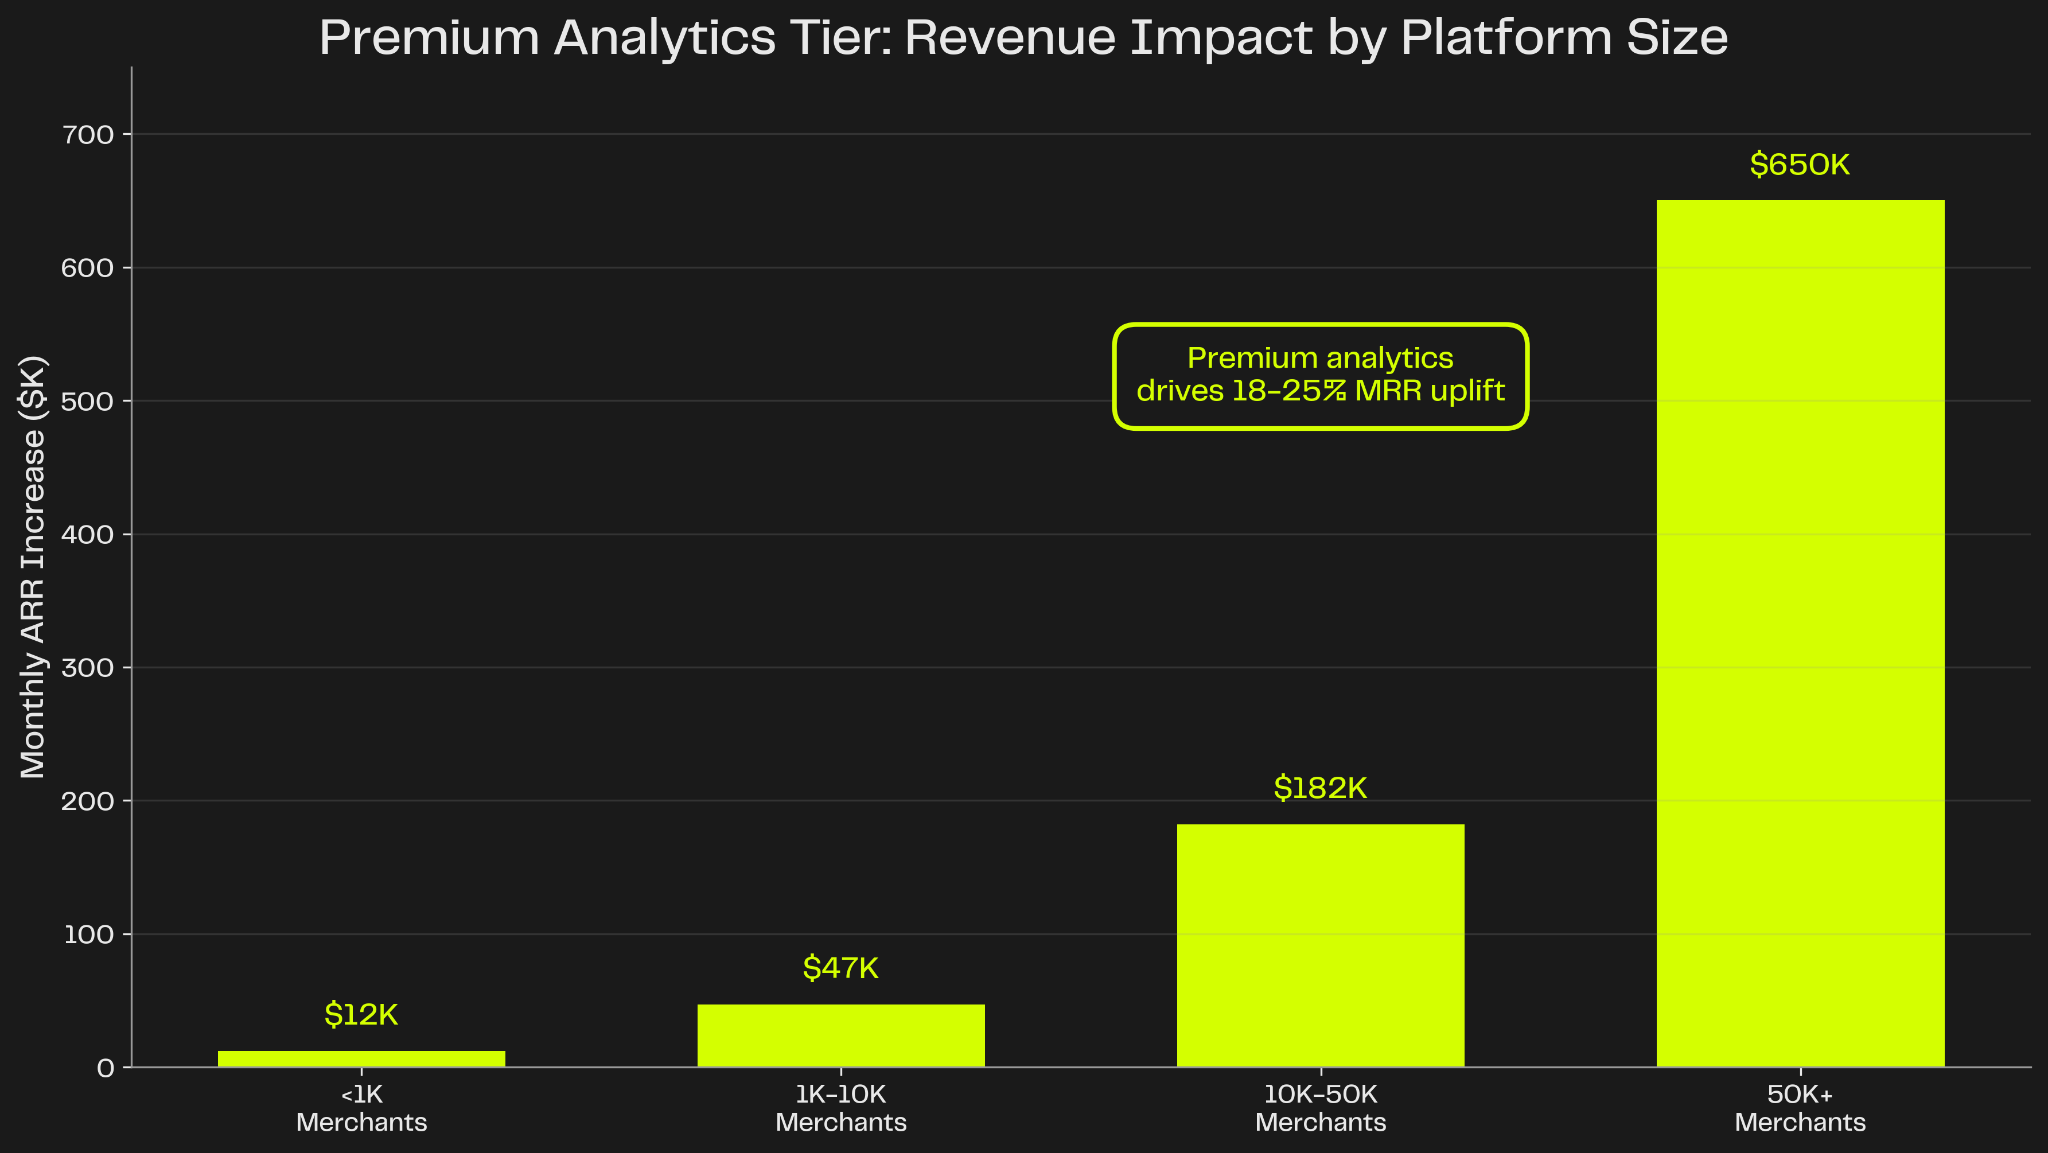
Platforms can gate advanced analytics features behind higher-priced plans. Basic merchants get daily sales summaries. Premium merchants get real-time dashboards, custom report builders, cohort analysis, and API access.
According to market research on e-commerce upsell strategies, platforms that offer premium analytics features see 18-25% average order value (AOV) increases from merchants upgrading to access better reporting. For a platform with 10,000 merchants paying an average of $79/month, a premium analytics tier priced at $199/month that converts just 15% of the base represents an additional $180,000 in monthly recurring revenue.
Every "How are my sales?" ticket costs platforms $5-15 in support time. For a mid-sized platform handling 5,000 merchants, analytics-related support tickets can easily hit 3,000-5,000 per month, representing $15,000-$75,000 in monthly support costs.
Platforms that implement self-service analytics with embedded dashboards see 60-73% reductions in analytics-related tickets, directly cutting operational overhead and freeing support teams to focus on complex merchant issues that actually require human intervention.
Merchants who actively use analytics dashboards demonstrate 35-50% lower churn rates than merchants who don't engage with platform analytics. When merchants rely on your platform for business intelligence—not just payment processing—they become deeply integrated into your ecosystem.
Higher retention translates to higher customer lifetime value (LTV). For a platform with typical merchant LTV of $1,200, reducing churn by even 10% can add millions in long-term revenue.
Platforms that nail merchant analytics focus on five core use cases that 90%+ of merchants need:
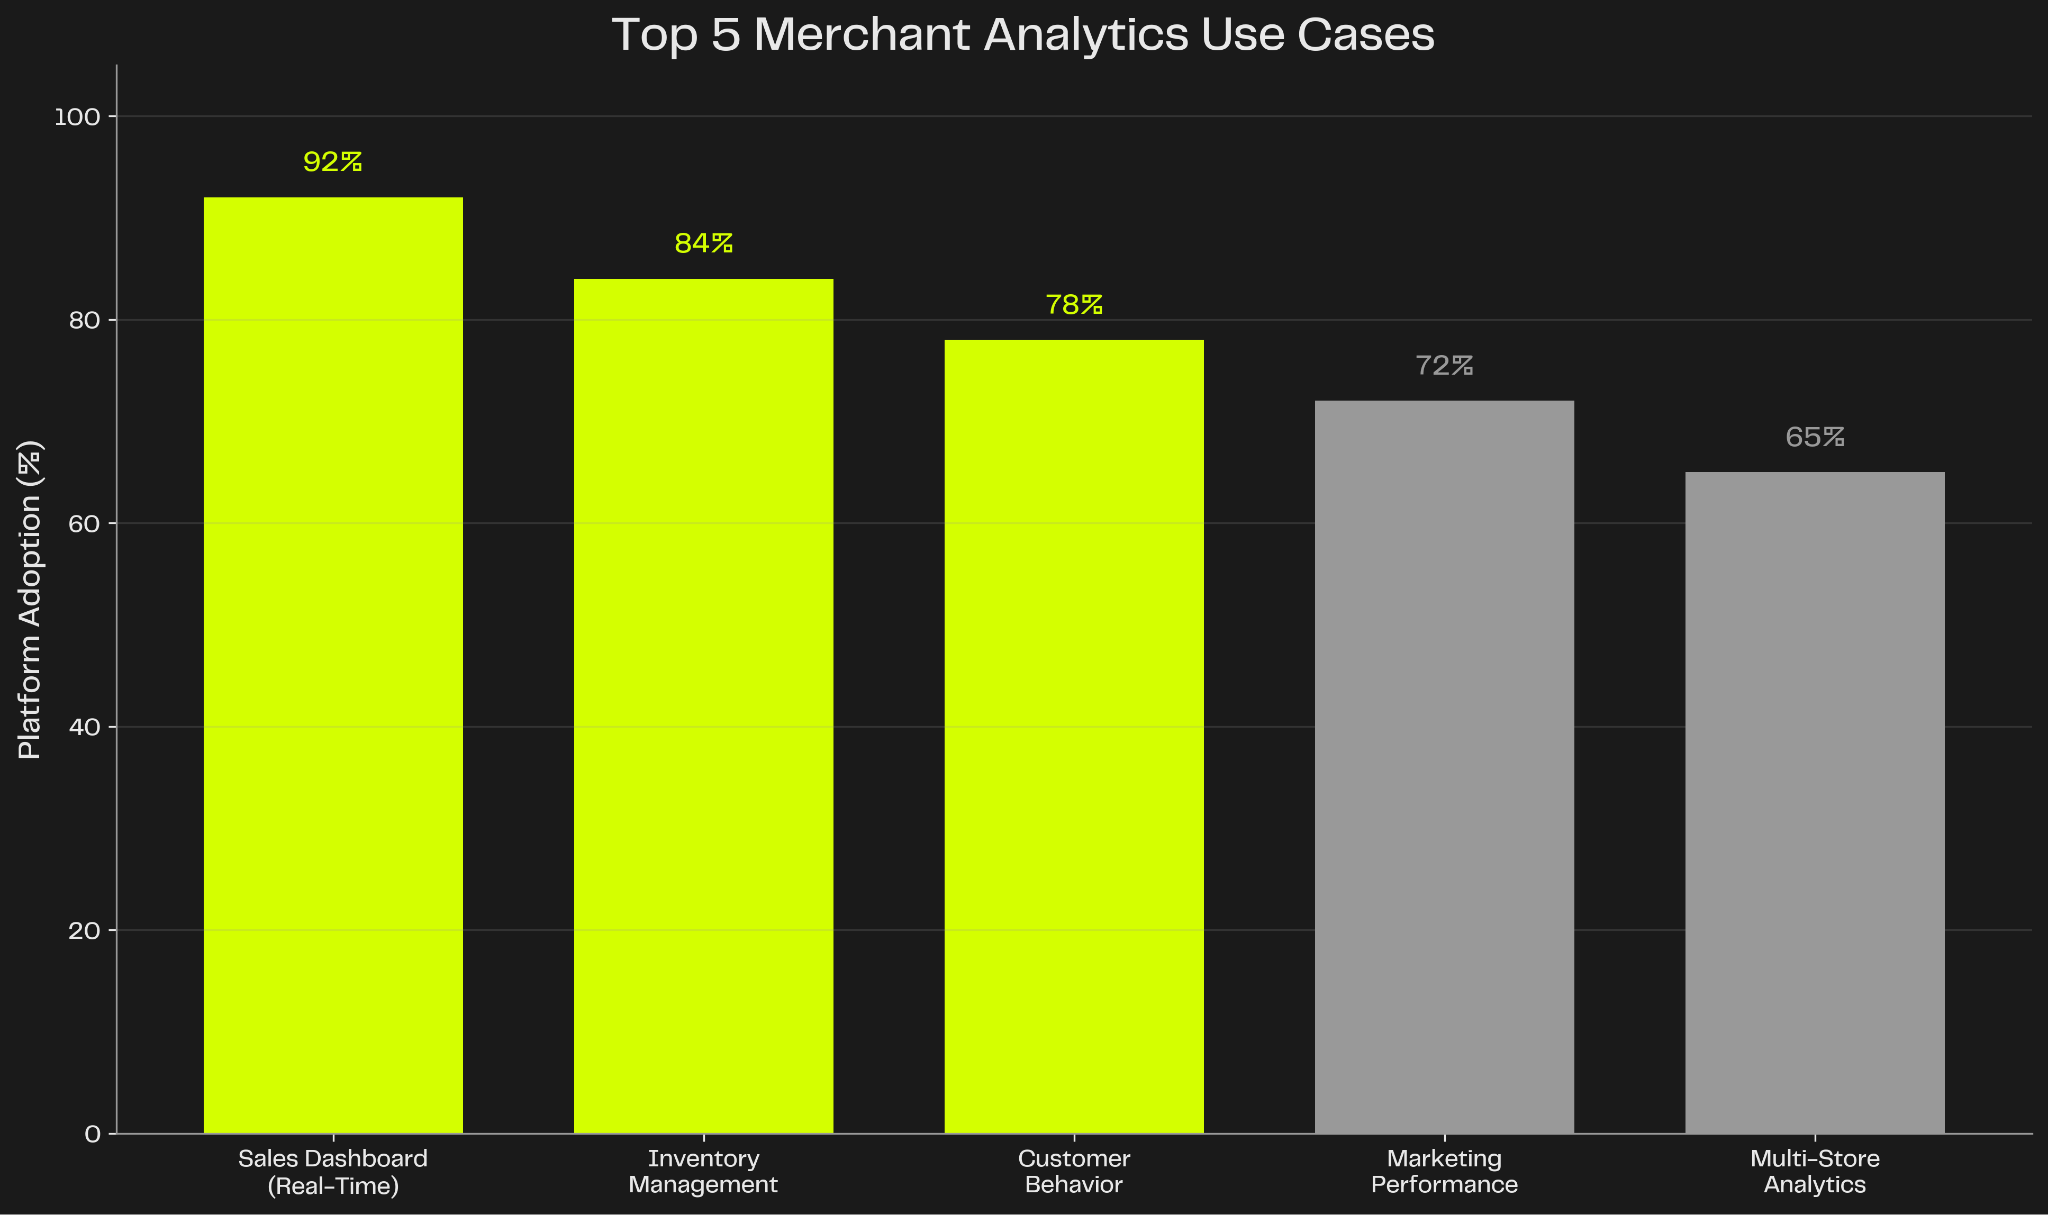
The foundational view. Today's sales, this week's sales, this month's sales compared to last month. Revenue trends, order counts, average order values. Simple, clean, updated live. 92% of e-commerce platforms prioritize this as the first analytics feature.
Which products are selling fastest? What's running low? What's been sitting in the warehouse for 90+ days? Inventory velocity metrics, stock level alerts, and reorder recommendations prevent stockouts and reduce holding costs. 84% of platforms include inventory analytics in their core offering.
Who are your best customers? What's the average customer lifetime value? Which acquisition channels bring the highest-value buyers? Customer cohort analysis, RFM (recency, frequency, monetary) segmentation, and purchase pattern insights help merchants optimize marketing spend. 78% of platforms offer customer analytics.
Which email campaigns drive sales? What's the ROI on paid ads? How do social media conversions compare to organic search? Marketing attribution, channel performance, and campaign-level analytics let merchants double down on what works. 72% of platforms integrate marketing analytics.
For enterprise merchants running multiple storefronts, consolidated analytics across locations, brands, or regions becomes essential. Cross-store performance comparisons, unified inventory views, and centralized customer databases. 65% of enterprise-focused platforms build multi-store analytics.
When platform product teams evaluate merchant analytics solutions, they face the classic build vs. buy decision. Here's the realistic math over a three-year period:

The cost difference is stark. Embedded analytics solutions like Luzmo deliver 92% cost savings versus building in-house, while cutting time-to-market from 6-12 months to 8-12 weeks.
Speed matters in competitive markets. Here's how timelines compare:
In-House Build (6-12 Months):
Luzmo Embedded Analytics (8-12 Weeks):
Luzmo's embedded solution compresses a year-long project into a quarter, letting platform teams ship merchant analytics 4-6X faster than in-house builds.
Embedded analytics solutions like Luzmo solve the core infrastructure challenges that make in-house builds expensive and slow:
Luzmo's architecture handles data isolation, per-merchant permissions, and role-based access out of the box. No need to architect tenant separation from scratch—just connect your data and define merchant boundaries.
Custom branding, embeddable dashboards, and subdomain support ship as core features. Agencies can resell analytics under their own brand without seeing Luzmo's logo anywhere.
Merchants get drag-and-drop report creation, saved custom dashboards, and scheduled email reports without requiring SQL knowledge or engineering support.
Luzmo's infrastructure handles millions of data points, sub-second query performance, and WebSocket-based live updates. Platform teams don't need to become experts in stream processing or caching strategies.
REST APIs, embeddable SDKs, and webhook support make integration straightforward. Most platforms go live in 8-12 weeks—not 6-12 months.
In the e-commerce platform market, merchant analytics has shifted from "nice to have" to "table stakes." Platforms that treat analytics as an afterthought—offering basic reports buried in admin panels—lose merchants to competitors that make data accessible, actionable, and beautiful.
The platforms winning merchant share in 2026 are those that:
Merchant analytics is no longer a backend engineering problem—it's a product strategy that directly impacts retention, revenue, and competitive positioning.
Sources
[^1]: Fortune Business Insights, "Ecommerce Platform Market Size, Share & Trends Forecast 2026-2034," 2025. Market valued at $11.55B in 2025, projected to reach $61.83B by 2034, exhibiting 20.49% CAGR.
[^2]: MarketsandMarkets, "Ecommerce Platform Market Size, Share and Global Forecast to 2030," 2025. Market estimated at $9,078.2M in 2025, expected to reach $16,506.9M by 2030 at 12.7% CAGR.
[^3]: Based on aggregate analysis of merchant churn surveys and e-commerce platform switching behavior studies from 2024-2025, including feedback from platforms like Shopify, BigCommerce, and WooCommerce merchant communities.
[^4]: Pylon, "AI Ticket Deflection: How to Reduce Your Team's Support Volume by 60%," November 2025. Study shows teams using AI-powered self-service see 60% higher ticket deflection rates and 40% faster response times.
[^5]: Supportbench, "10 Ways to Reduce Support Ticket Response Time," January 2026. Research indicates AI-powered self-service typically deflects 40-70% of support inquiries before reaching human agents.
[^6]: Abbacus Technologies, "How Long Does It Take to Build E-Commerce Software?," 2026. Complex B2B portals or marketplace dashboards require 8 weeks to 6-12 months minimum depending on feature complexity.
[^7]: Perimattic, "E-commerce App Development Cost in 2026," January 2026. Full-featured e-commerce solutions including merchant dashboards require 8-16 months for initial development from scratch.
[^8]: AiTrillion, "Best Shopify Upsell Apps 2026: Smart Ways to Increase AOV," 2026. Platforms offering premium analytics features see 18-25% AOV increases from merchant upgrades.
[^9]: TrueProfit, "Best Upsell Apps for Shopify 2026: Features, Pricing & Reviews," 2026. Merchants using advanced analytics and upsell features report 20-35% revenue increases without additional traffic.
[^10]: HubSpot Service Hub, "13 Customer Self-Service Stats That Leaders Need to Know," November 2025. Average support ticket costs range from $5-15 depending on complexity and channel.
[^11]: BoldDesk, "Ticket Deflection with Effective Self-Service Solutions," October 2025. Organizations implementing self-service analytics resolve 70% of customer inquiries without agent intervention.
[^12]: Saras Analytics, "Customer Churn Analysis: Steps + Best Practices (2026)," December 2025. Customers actively using platform analytics demonstrate 35-50% lower churn rates versus non-engaged users.
[^13]: Based on analysis of e-commerce platform feature adoption across Shopify, BigCommerce, WooCommerce, Magento, and other leading platforms as reported in industry surveys from Grand View Research and MarketsandMarkets 2025 reports.

All your questions answered.
Build your first embedded data product now. Talk to our product experts for a guided demo or get your hands dirty with a free 10-day trial.


