Embedded Analytics for Energy Management Platforms: Turning Compliance into Advantage
The alert hits at 2 AM. Building 47 in your 200-property portfolio just spiked 340% above baseline energy consumption. HVAC system running full capacity despite 15°F outdoor temperature. Estimated cost impact: $12,000 per day if undetected until Monday morning.
Your energy management platform caught it in real-time. Automated workflow triggered. Maintenance dispatched. Crisis averted before your property manager's first coffee.
This isn't exceptional performance anymore. It's table stakes.
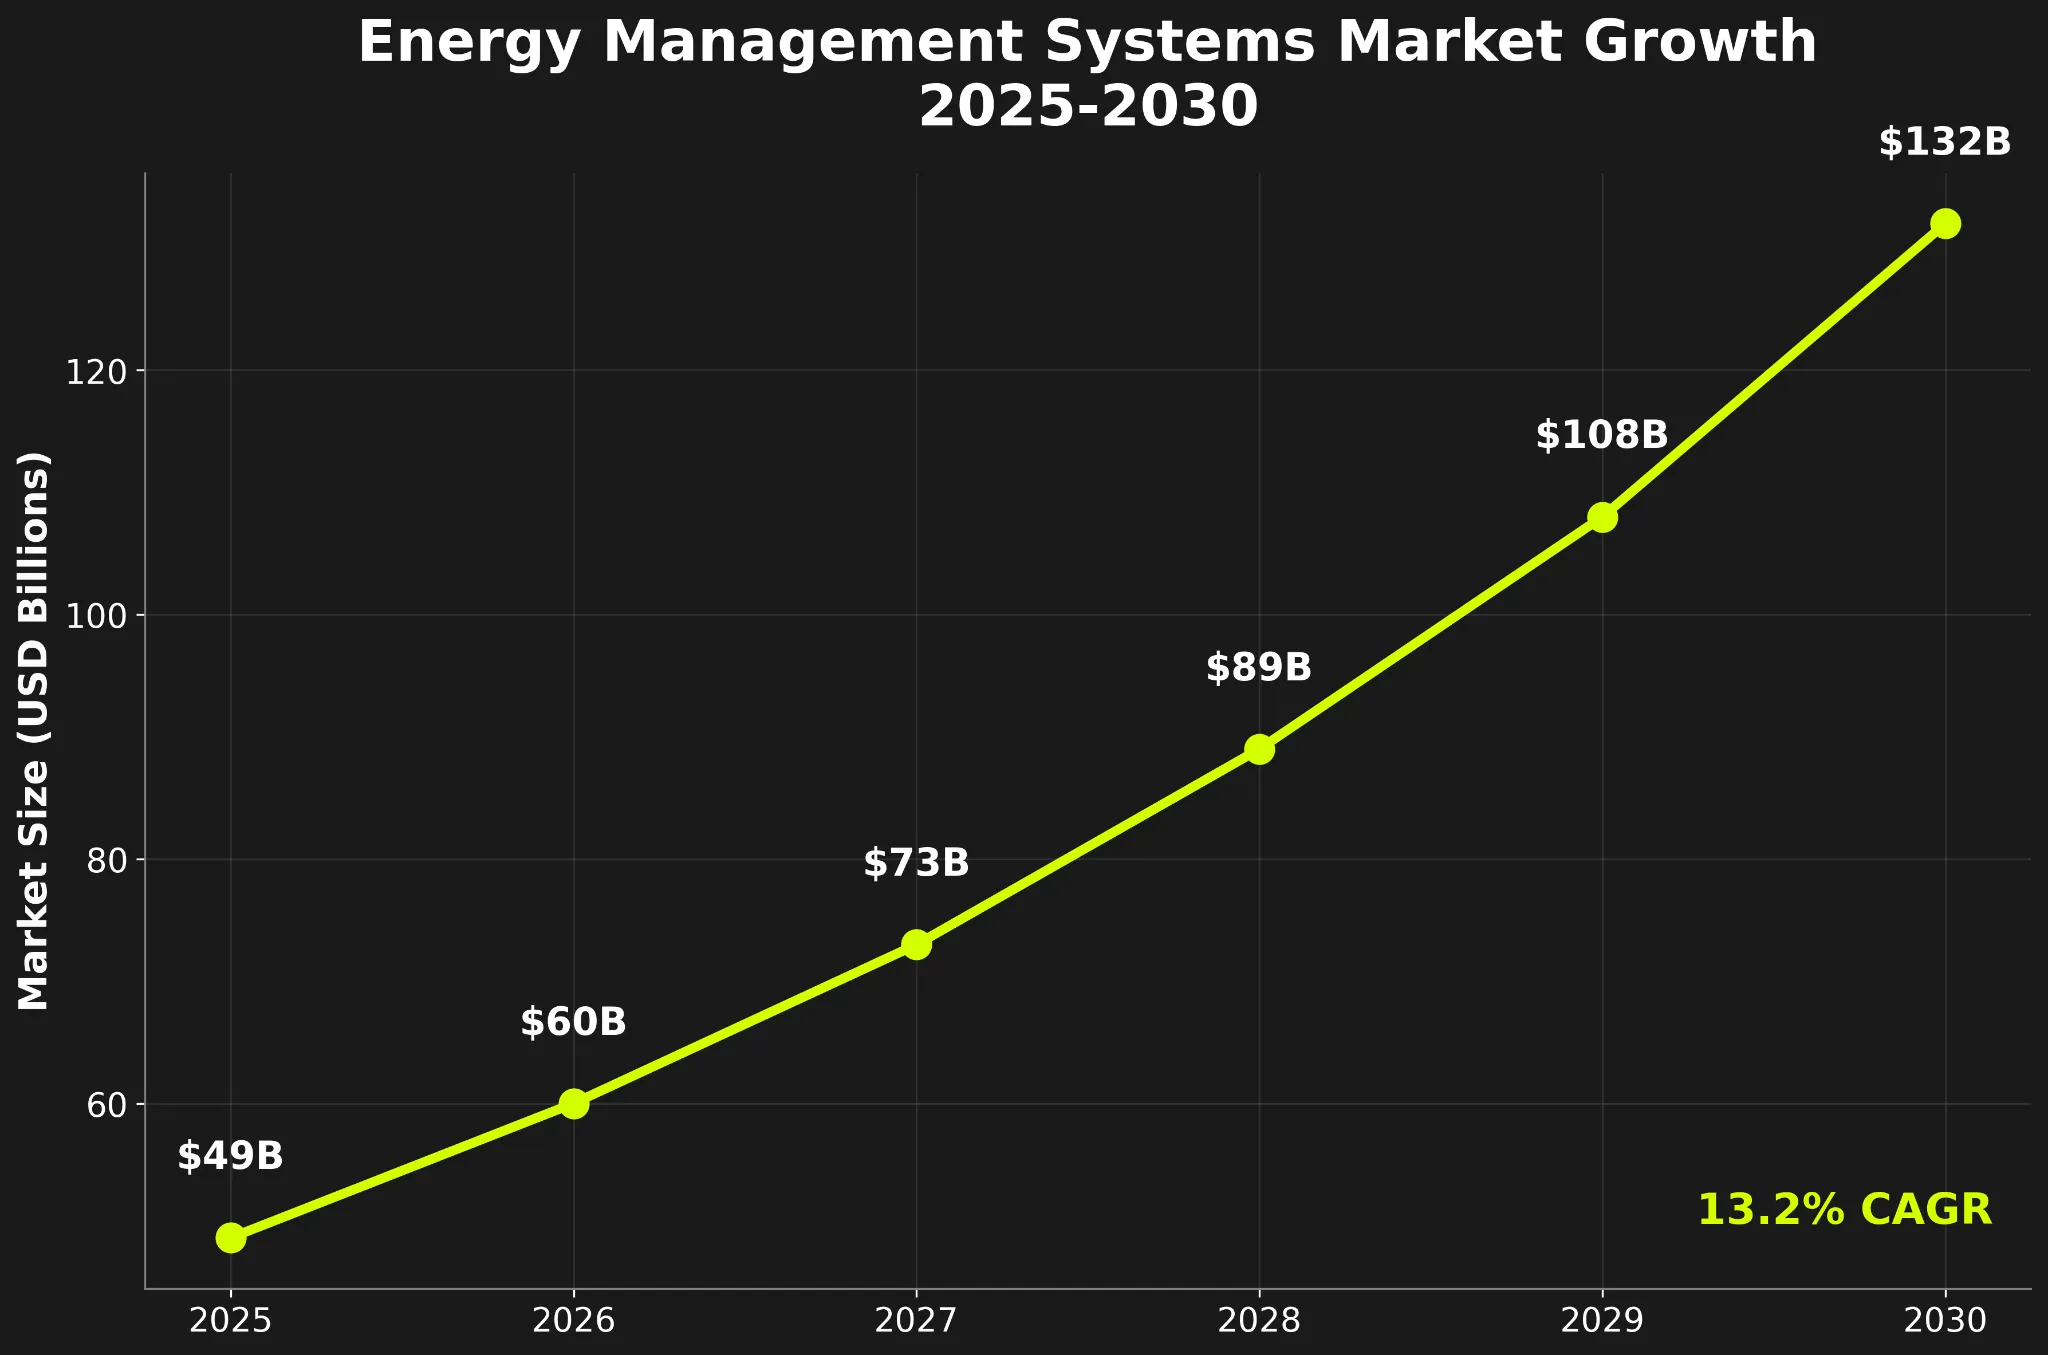
If you're building an energy management platform, your customers expect portfolio-wide visibility, real-time anomaly detection, and carbon compliance reporting that satisfies auditors across CSRD, TCFD, and SBTi frameworks simultaneously. The energy management systems market is growing from $49 billion in 2025 to $132 billion by 2030—a 13.2% CAGR driven by tightening carbon regulations and enterprise net-zero commitments.
Your platform faces a technical challenge that determines whether customers consolidate their entire portfolio with you or maintain a patchwork of point solutions: multi-building analytics that scale from 10 properties to 500+ without performance degradation, data isolation failures, or compliance gaps.
When analytics lag or carbon reporting fails audit, enterprise customers churn to competitors. The decision isn't about meter accuracy or BMS integration quality anymore—it's about which platform delivers audit-ready carbon disclosures when regulatory deadlines actually matter.
The Multi-Building Portfolio Challenge
Your platform operates a business model fundamentally different from single-site energy monitoring. A commercial real estate firm managing 150 office buildings, a retail chain operating 400 stores, a manufacturing company running 50 facilities across three continents—all need unified energy intelligence without sacrificing building-level control.
Each property manager sees only their buildings. Corporate sustainability teams need portfolio-wide carbon accounting. Finance teams require utility bill validation across thousands of meters. Facility managers need predictive maintenance alerts. Tenants access consumption data through self-service portals for accurate billing and submetering.
The technical architecture requires seamless data aggregation without losing granularity. A misconfigured dashboard showing Building A's consumption attributed to Building B doesn't just create billing disputes—it invalidates carbon accounting, breaks compliance frameworks, and triggers contract terminations.
Your analytics layer must handle strict building-level isolation while enabling portfolio-wide intelligence. Property managers need building-specific anomaly detection and performance benchmarking. Sustainability teams need to aggregate Scope 1, 2, and 3 emissions across all facilities while maintaining audit trails proving data integrity. Finance teams need automated utility bill validation catching errors before payment processing.
Platform teams building for enterprise energy management face four infrastructure challenges that determine whether analytics become mission-critical or get replaced.
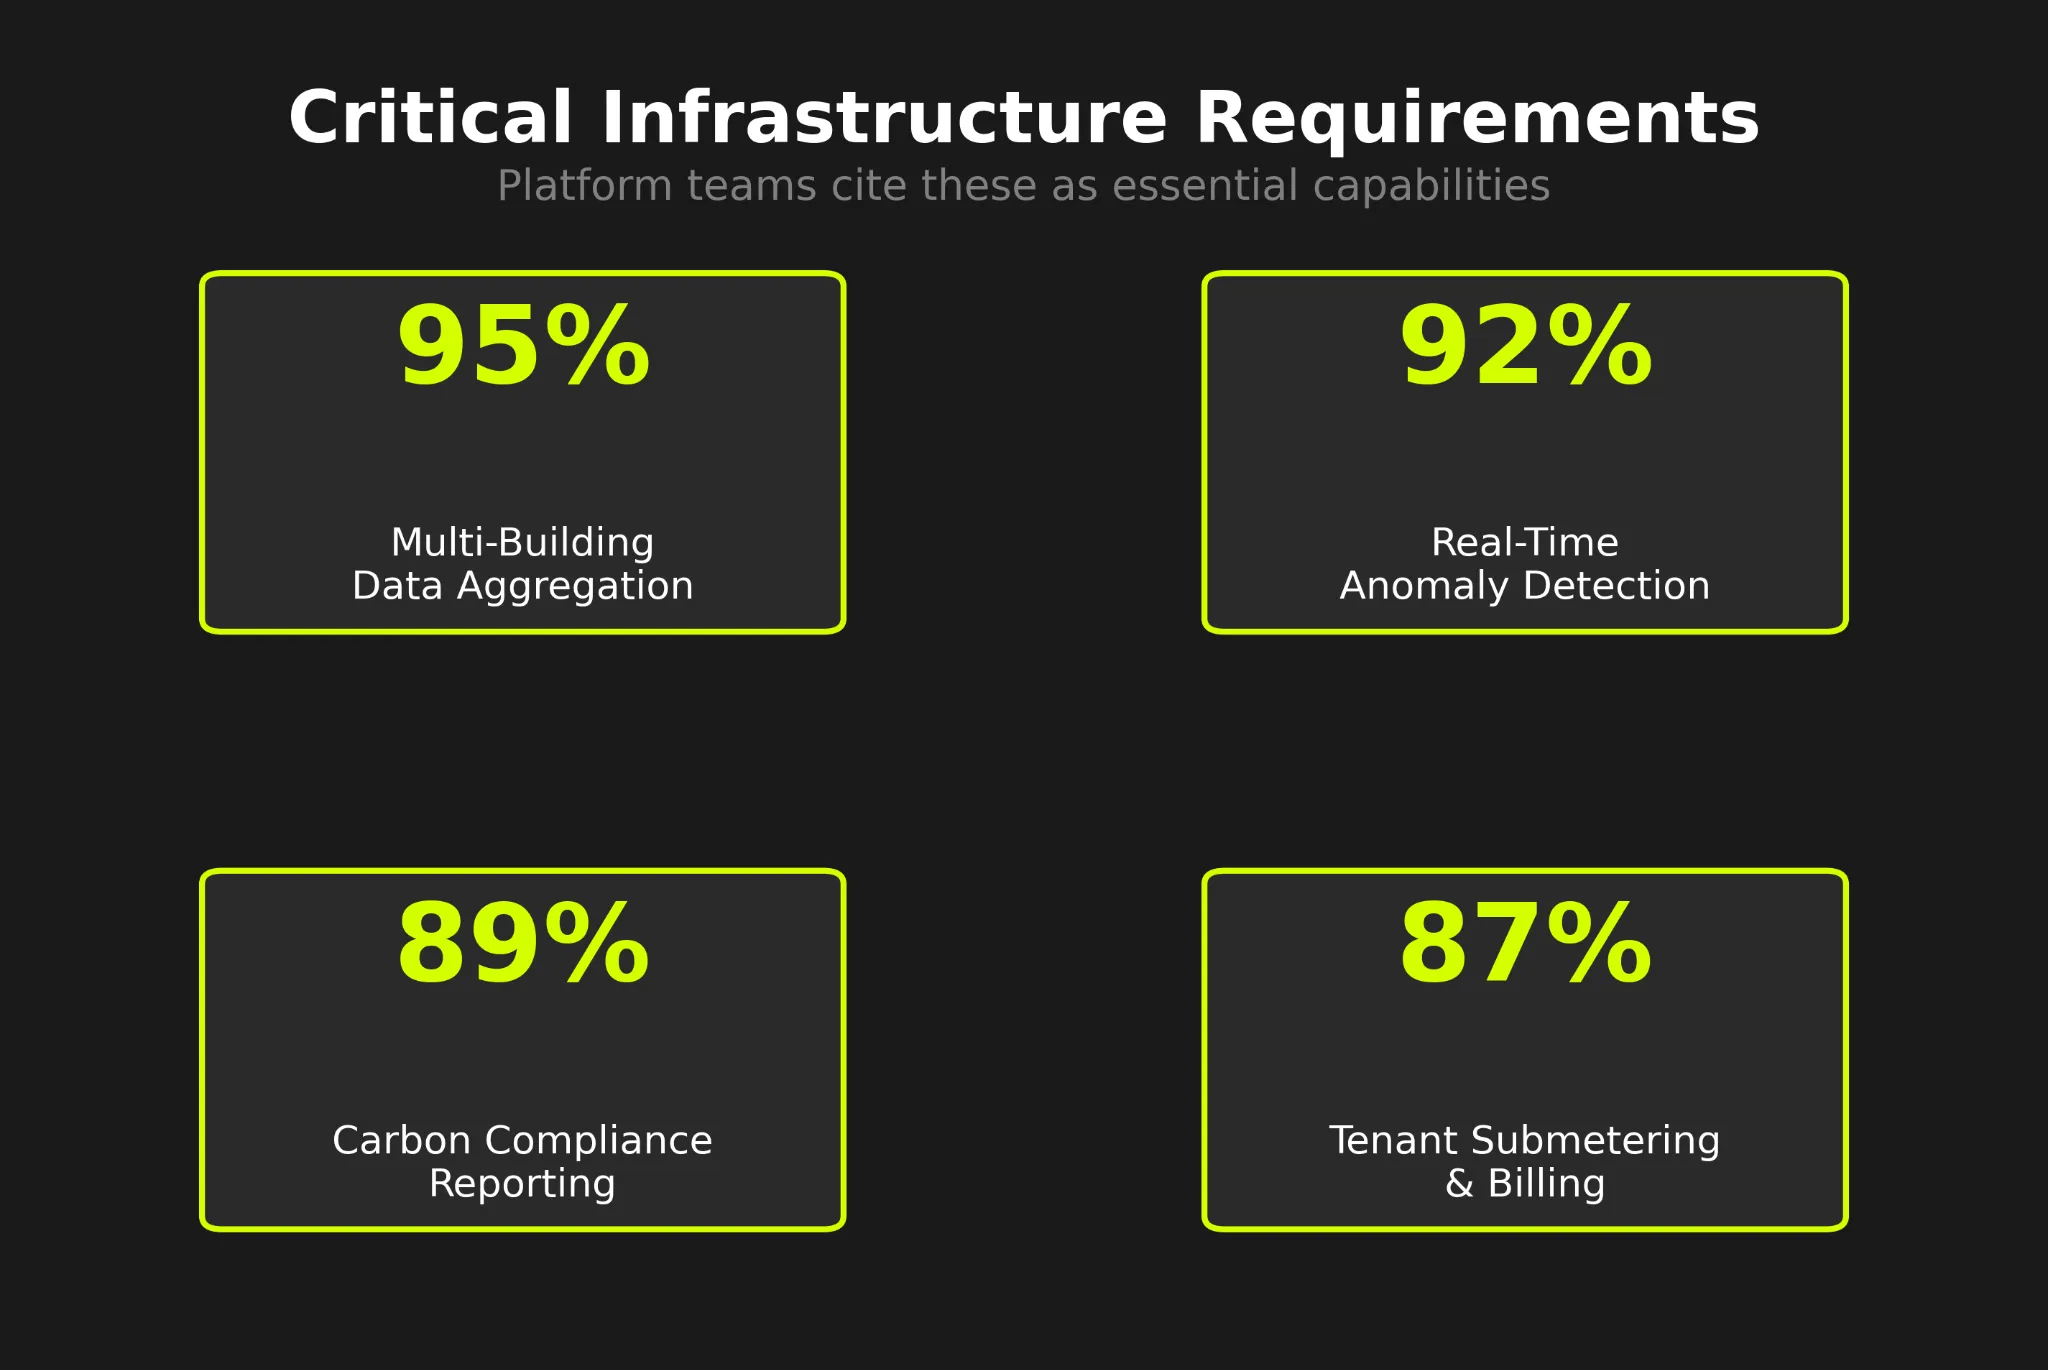
Multi-Building Data Aggregation
True portfolio analytics require more than database rollups. Each building needs isolated monitoring, custom baselines, and performance benchmarking while the corporate dashboard aggregates energy, emissions, and costs across the entire portfolio in real-time.
Data normalization becomes critical. When sustainability teams pull portfolio-wide carbon footprint, the platform must convert diverse energy sources—electricity, natural gas, steam, chilled water, renewable energy credits—into comparable emissions using location-specific factors. When facility managers compare buildings, the system must weather-normalize consumption accounting for degree days, occupancy patterns, and operational hours.
The complexity multiplies with data quality. Buildings report meter data at different intervals—some every 15 minutes via automated systems, others monthly through manual entry. The platform must detect gaps, estimate missing values using industry-standard methodologies, and flag uncertainty levels ensuring compliance officers understand data reliability.
Your platform needs automated data validation catching anomalies before they propagate to reports. A single meter reporting impossible values can invalidate an entire quarter's carbon disclosure if undetected. Audit trails must document every estimation, normalization, and aggregation step proving regulatory compliance.
Real-Time Anomaly Detection
Energy data doesn't wait for business hours. A malfunctioning HVAC system wastes thousands per day. A facility accidentally running at full capacity overnight burns money while staff sleep. A tenant leaving equipment on creates cost overruns catching finance teams off guard.
All of this waste must trigger alerts that building managers actually see and act on before damage compounds. Alert fatigue isn't just annoying—it's expensive. A platform generating 50 false positives per building per week trains users to ignore everything, missing the one real crisis costing $50,000.
Your platform needs behavior-based anomaly detection learning normal patterns per building, per season, per occupancy level. Machine learning models must distinguish genuine emergencies from expected variance. A 200% consumption spike on a -10°F January night might be normal for a northern building but catastrophic for a southern facility.
The technical challenge is processing millions of meter readings across hundreds of buildings while maintaining sub-minute detection latency. A 200-building portfolio with 15-minute interval meters generates 1.9 million data points per day. The anomaly detection engine must analyze all of it in real-time, score severity, and route alerts to responsible parties before costs spiral.
Carbon Compliance Reporting
Energy platforms now compete on compliance capability. CSRD mandates hit 50,000+ companies in 2025. TCFD recommendations influence investment decisions. SBTi targets determine corporate credibility. SEC climate disclosure rules reshape reporting requirements.
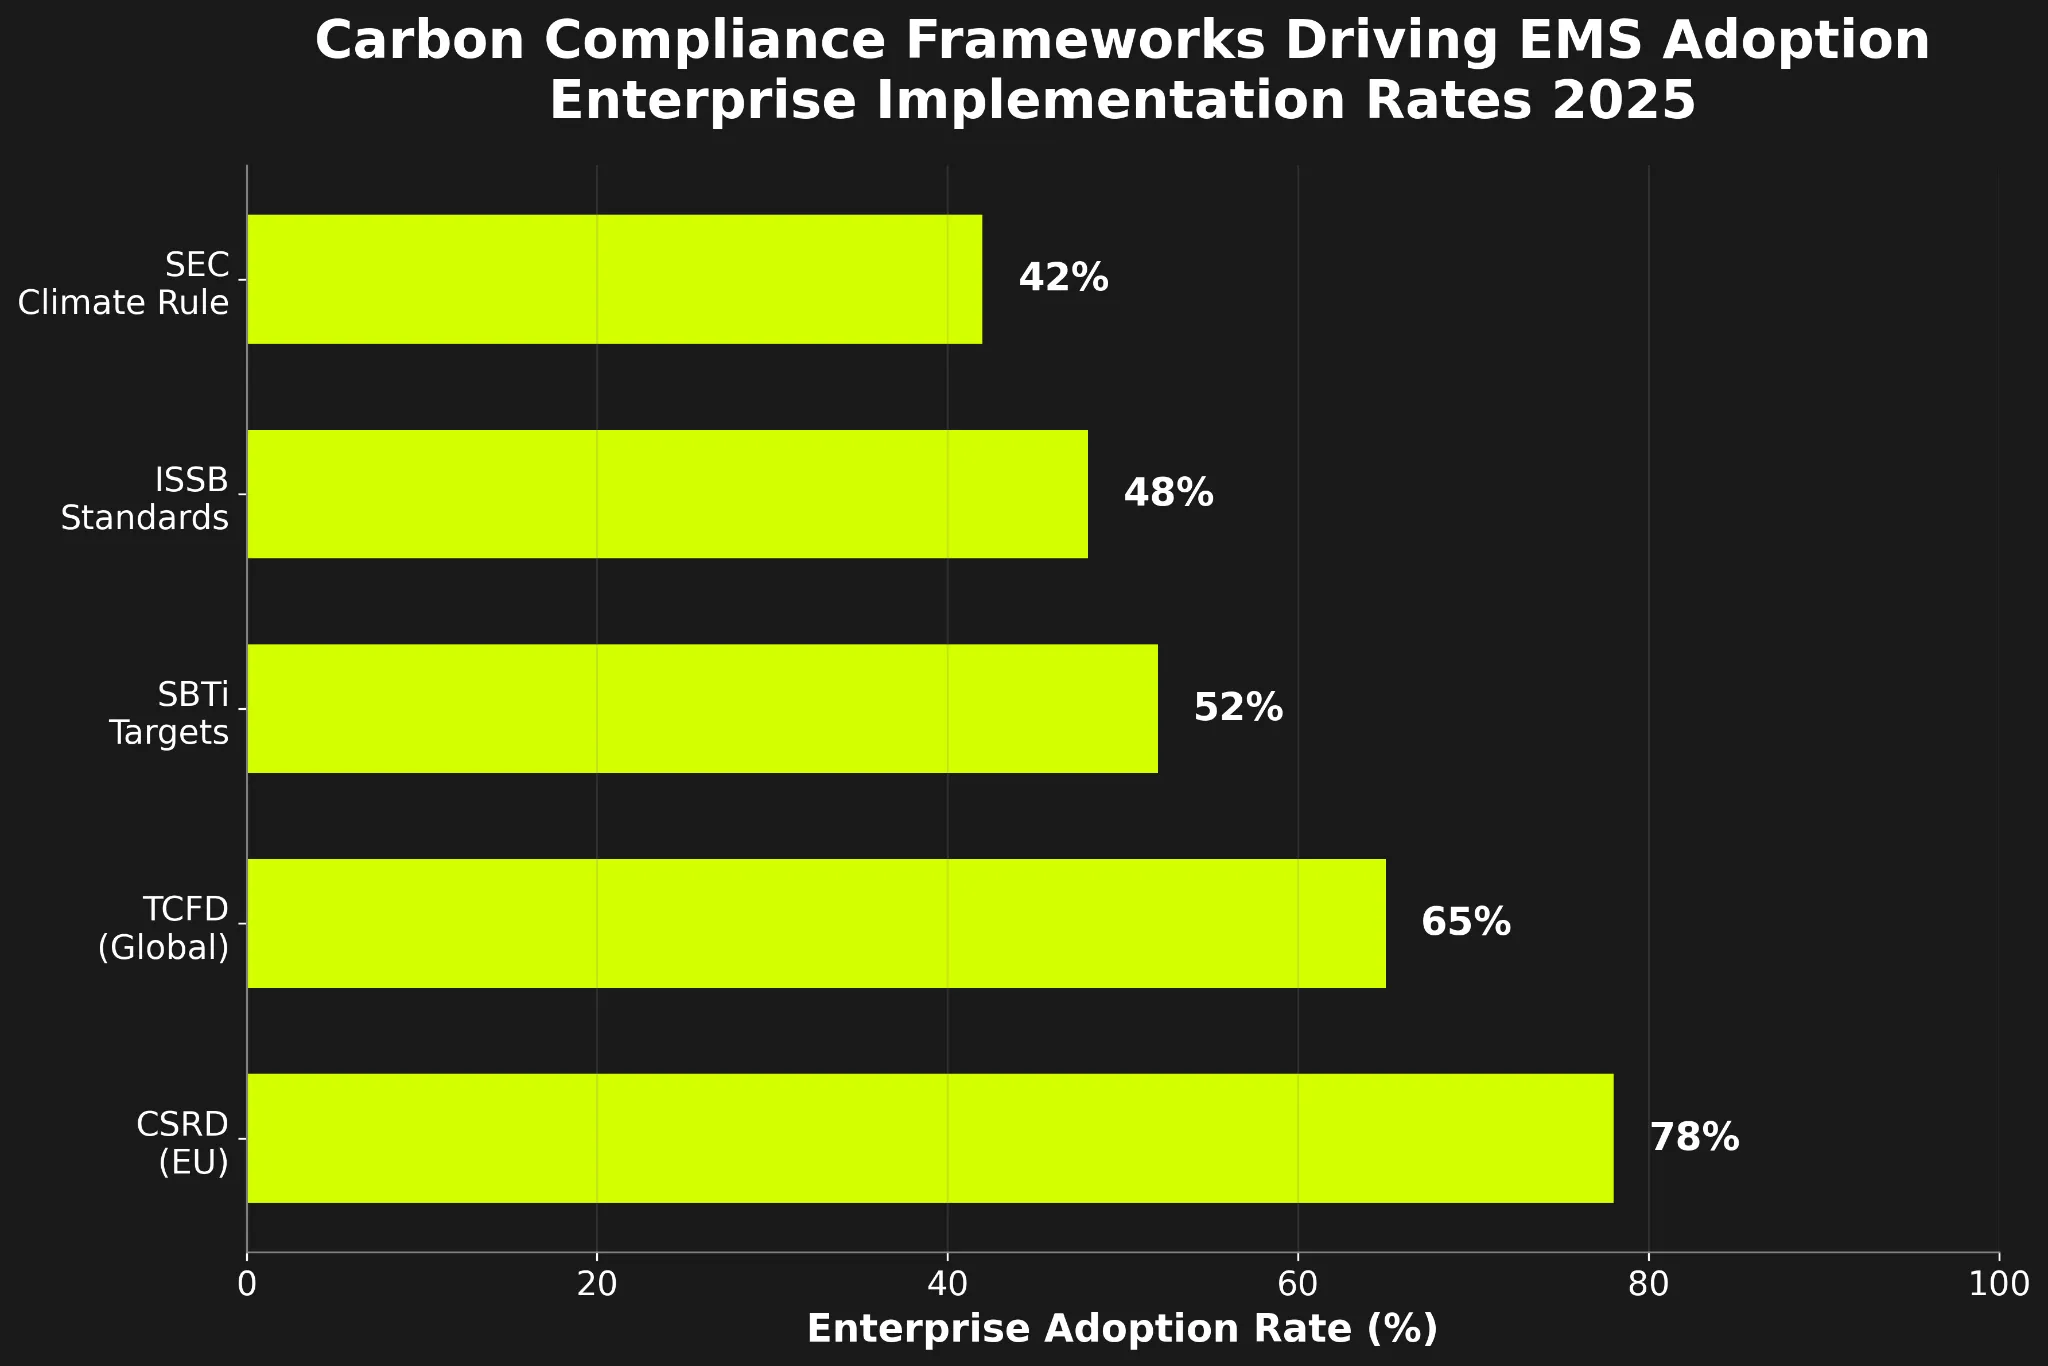
Your platform must generate audit-ready reports satisfying multiple frameworks simultaneously. The same energy data feeds CSRD double materiality assessments, TCFD climate risk scenarios, SBTi science-based target tracking, and ISSB sustainability disclosures without requiring sustainability teams to manually reconcile differences.
Scope 3 emissions complicate everything. Purchased goods, business travel, employee commuting, tenant energy consumption—all require estimation methodologies that auditors accept. Your platform needs configurable emission factors, supplier engagement workflows, and assumption documentation proving compliance even when primary data is incomplete.
The reporting burden intensifies annually. Companies that manually compiled carbon reports once per year now face quarterly investor requests, monthly board updates, and real-time ESG rating agency inquiries. Your platform must automate report generation maintaining data lineage from meter readings through emission factors to final disclosures, enabling one-click exports satisfying any framework.
Tenant Submetering & Billing
Multi-tenant buildings create billing complexity that generic energy platforms cannot handle. Office towers with 40 tenants, shopping centers with 200 retailers, industrial parks with mixed occupancy—all need tenant-level consumption tracking, accurate billing, and dispute resolution.
Your platform must support tenant portals where occupants access real-time consumption, compare performance against similar spaces, and validate monthly bills before payment. Transparency prevents disputes. When tenants see exactly how their consumption translates to charges, billing questions decrease 60-80%.
The technical architecture requires meter hierarchies tracking individual tenant spaces, common areas, and landlord-controlled systems separately. A tenant's HVAC consumption must be isolated from hallway lighting and elevator operation. Submeters, virtual meters, and allocation methodologies must all produce audit-defensible results satisfying lease agreements and local regulations.
Automated billing integration becomes essential at scale. A 500-tenant portfolio generating manual invoices wastes hundreds of administrative hours monthly. Your platform needs automated bill generation, payment processing integration, and exception handling reducing property management overhead while improving accuracy.
The Revenue Model
Your platform competes in a market where meter hardware and BMS integration have largely commoditized. The differentiation comes from the analytics layer—which platform turns energy data into cost savings, carbon reductions, and compliance confidence faster, more accurately, and with better multi-building intelligence.
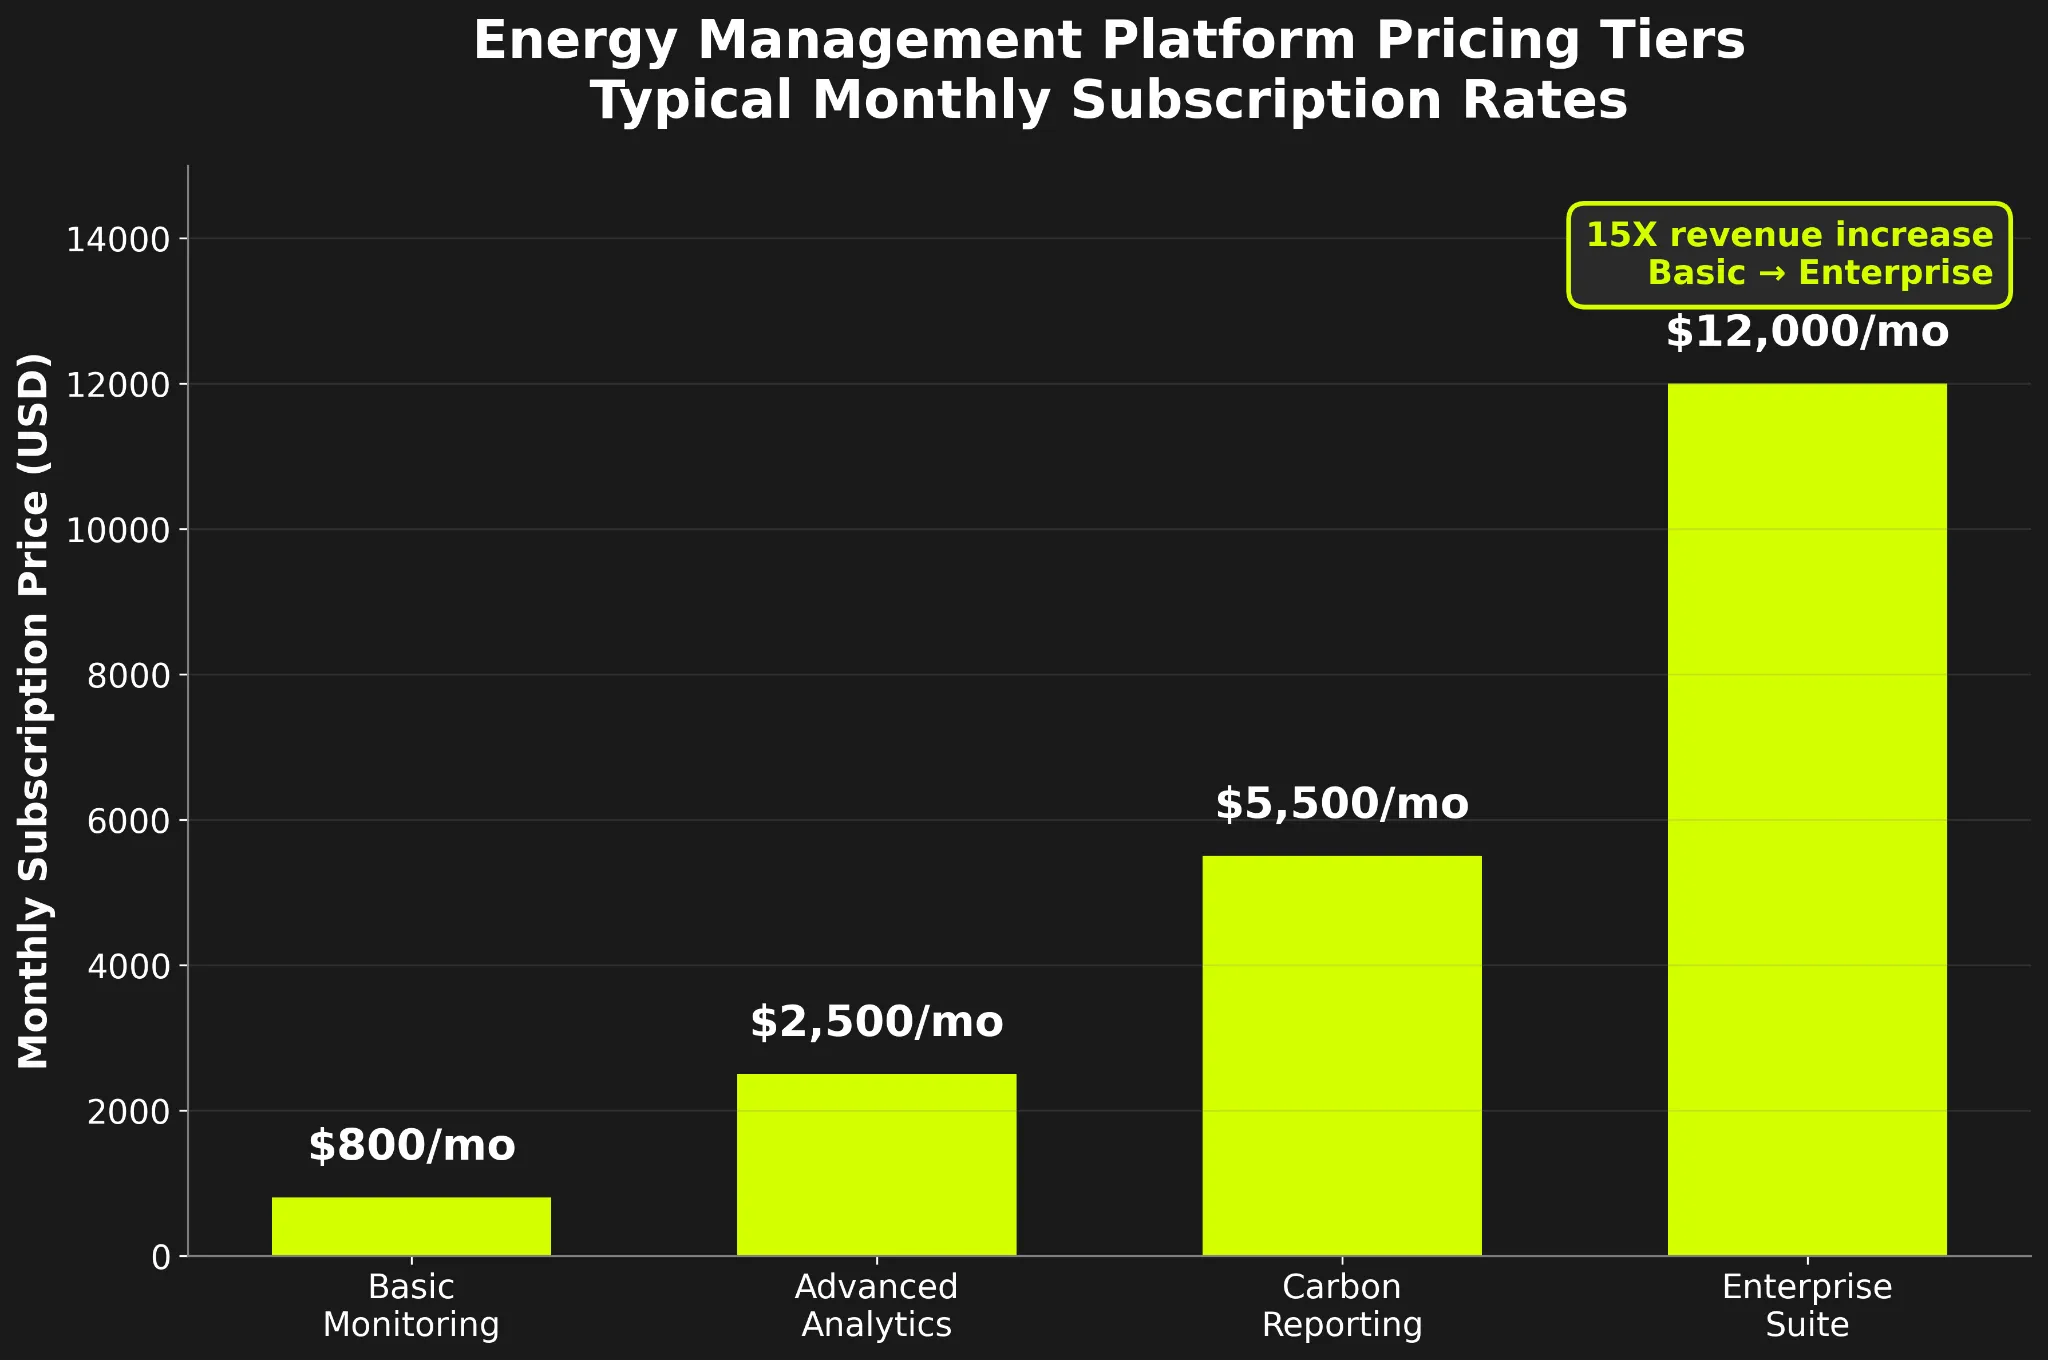
Subscription Pricing Tiers
Basic tiers provide monitoring only. Advanced tiers add predictive analytics and anomaly detection. Carbon reporting tiers include compliance frameworks and audit preparation. Enterprise suites deliver full portfolio intelligence with API access and custom integrations.
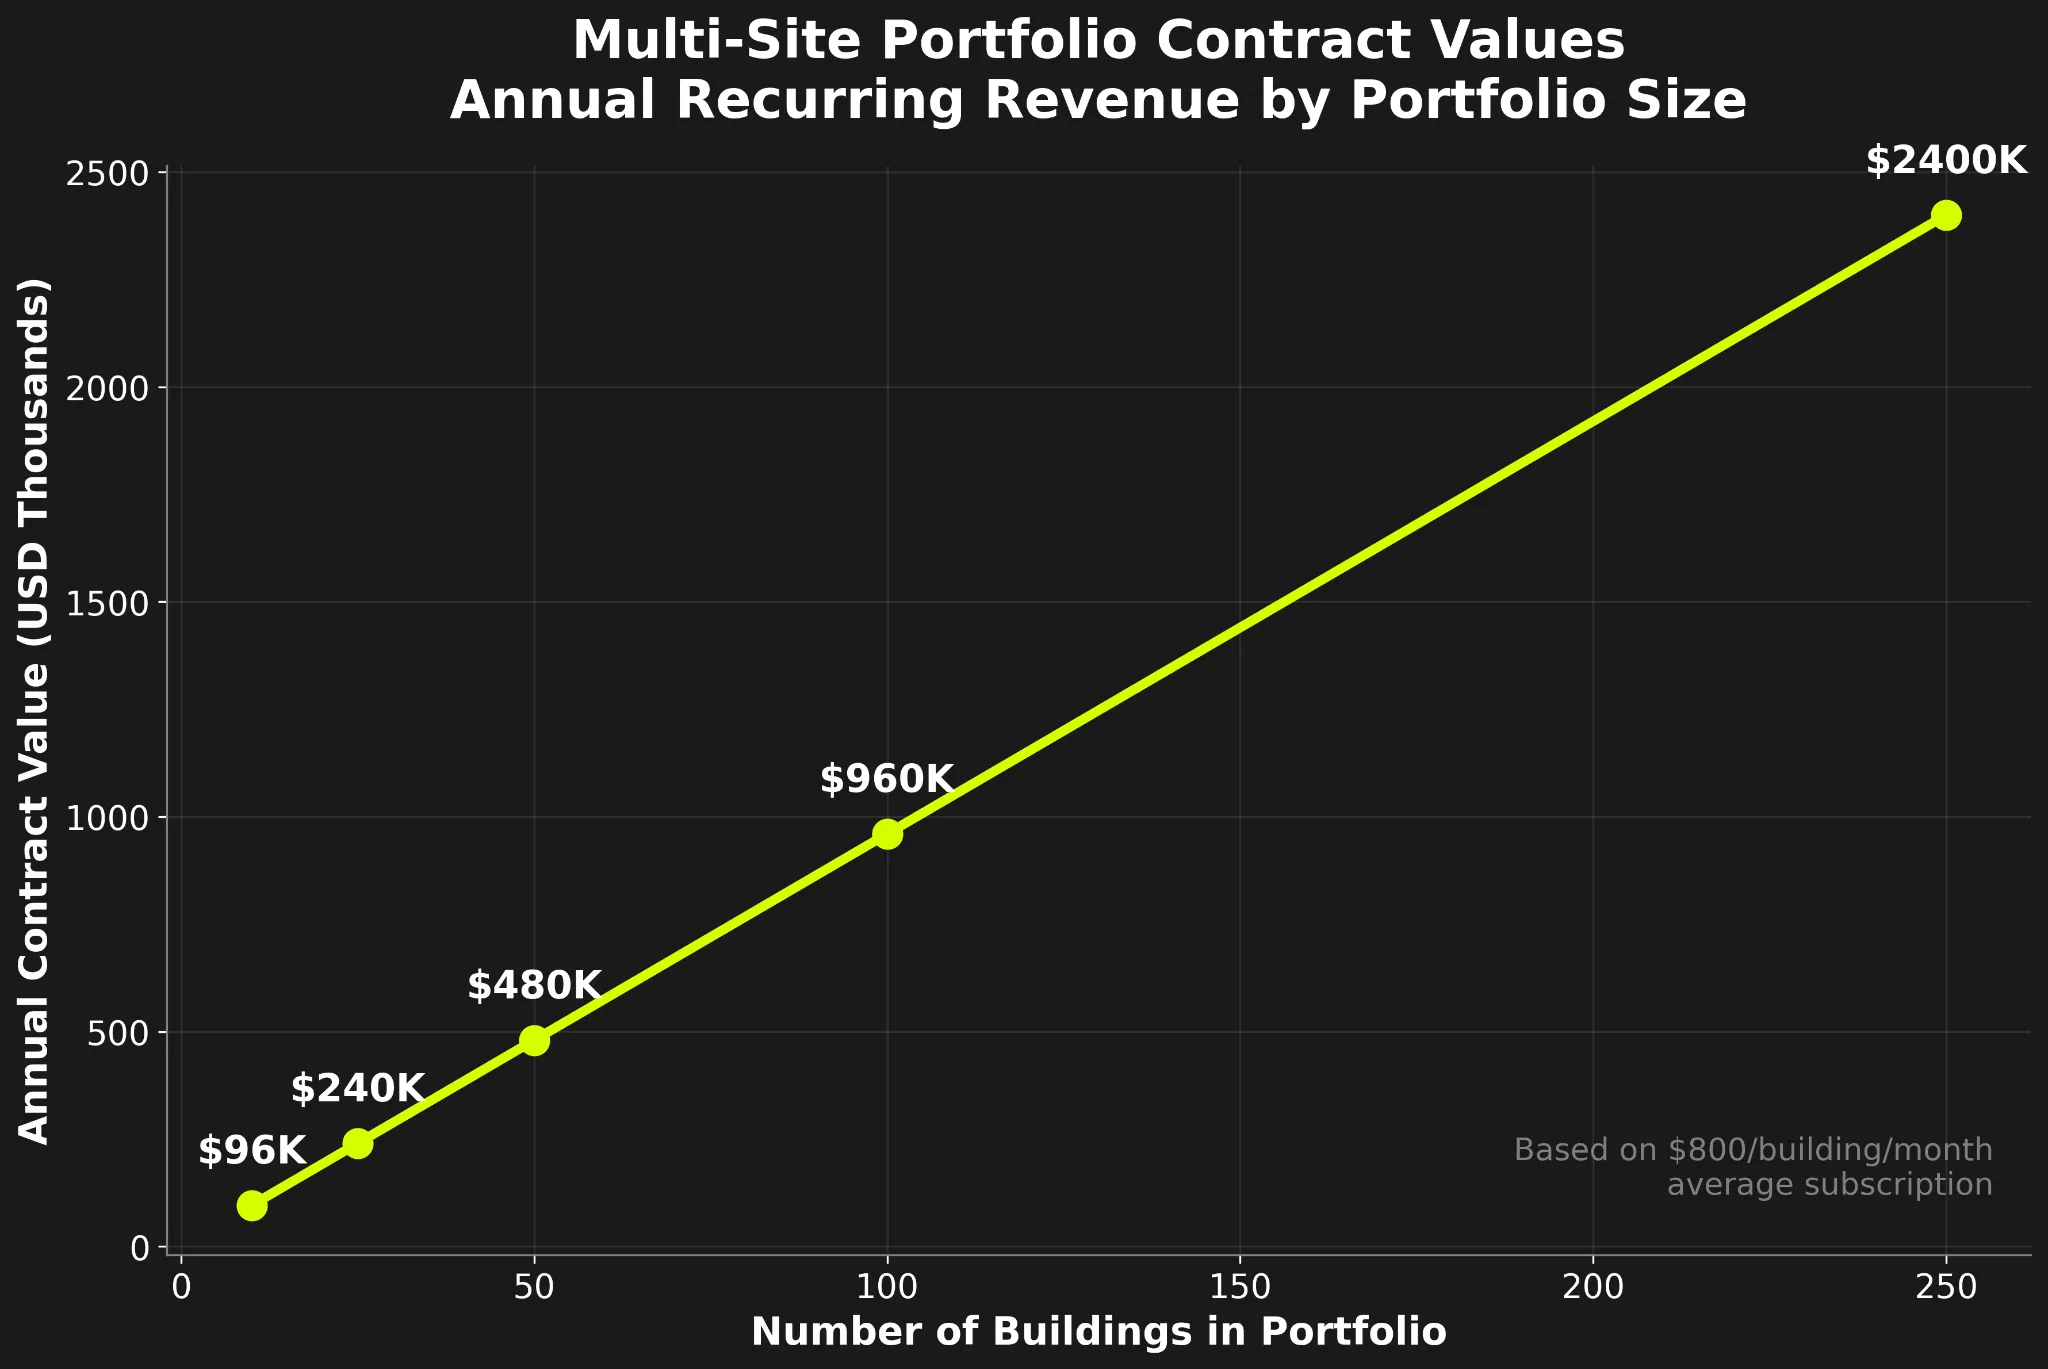
The pricing spread is substantial. Basic monitoring: $800 per building per month. Advanced analytics: $2,500 per month. Carbon reporting: $5,500 per month. Enterprise suite: $12,000 per month—a 15X revenue increase for capabilities that cost the platform marginally more to deliver once infrastructure is built.
The analytics tier creates natural upsell paths. A property portfolio starts with basic monitoring across 50 buildings. They face their first CSRD audit and realize they need comprehensive carbon accounting. They don't switch platforms—they upgrade to carbon reporting within the existing relationship. An industrial company starts with advanced analytics but needs API access for ERP integration. They upgrade to enterprise tier.
Successful platforms expand analytics capabilities delivering integrated compliance reporting, automated anomaly detection, and tenant engagement tools. Advanced AI-driven forecasting and scenario modeling features enable sustainability teams to test decarbonization strategies before committing capital.
Multi-Site Portfolio Contracts
Selling to individual buildings generates recurring revenue. Selling to entire portfolios generates transformational contracts. A 100-building commercial real estate firm at $2,500 per building per month equals $3 million in annual recurring revenue from a single customer.
Portfolio contracts create lock-in through standardization. When all buildings use the same platform, corporate teams can benchmark performance, aggregate carbon footprints, and optimize energy procurement across the entire portfolio. The network effects make switching increasingly difficult as building count grows.
Enterprises also enforce platform adoption. When corporate sustainability teams standardize on an energy management platform, individual properties comply regardless of local preference. This top-down adoption eliminates building-by-building sales cycles while accelerating deployment timelines.
Multi-year enterprise agreements demonstrate the revenue concentration possible when platforms win at the portfolio level—securing hundreds of buildings simultaneously rather than selling to individual facilities one at a time. Customer lifetime value in portfolio contracts exceeds $10 million for large real estate operators and manufacturing companies.
Retention Through Data Lock-In
Energy management platforms achieve 85-90% annual renewal rates through data accumulation rather than contract terms. After three years, your platform holds three years of energy consumption history, carbon emissions records, anomaly detection models tuned to each building, and custom dashboards configured to each user's workflow.
Switching platforms means abandoning this institutional knowledge. Historical comparisons break. Trend analysis resets. Carbon baseline calculations require recalculation. Custom alerts and automated workflows need rebuilding. Sustainability teams resist losing audit trails proving compliance continuity.
The switching cost isn't purely technical—it's operational and political. Sustainability managers build entire decarbonization strategies around platform-specific analytics. Finance teams structure energy procurement based on platform forecasts. Facility managers rely on predictive maintenance models that took years to train.
A platform managing a 200-building portfolio for five years holds more energy intelligence than most corporate sustainability teams. That data becomes irreplaceable, and renewals become automatic even when competitors offer lower pricing.
Five Analytics Use Cases That Matter
Platform teams building for enterprise energy management should focus on five core use cases that drive adoption and retention.
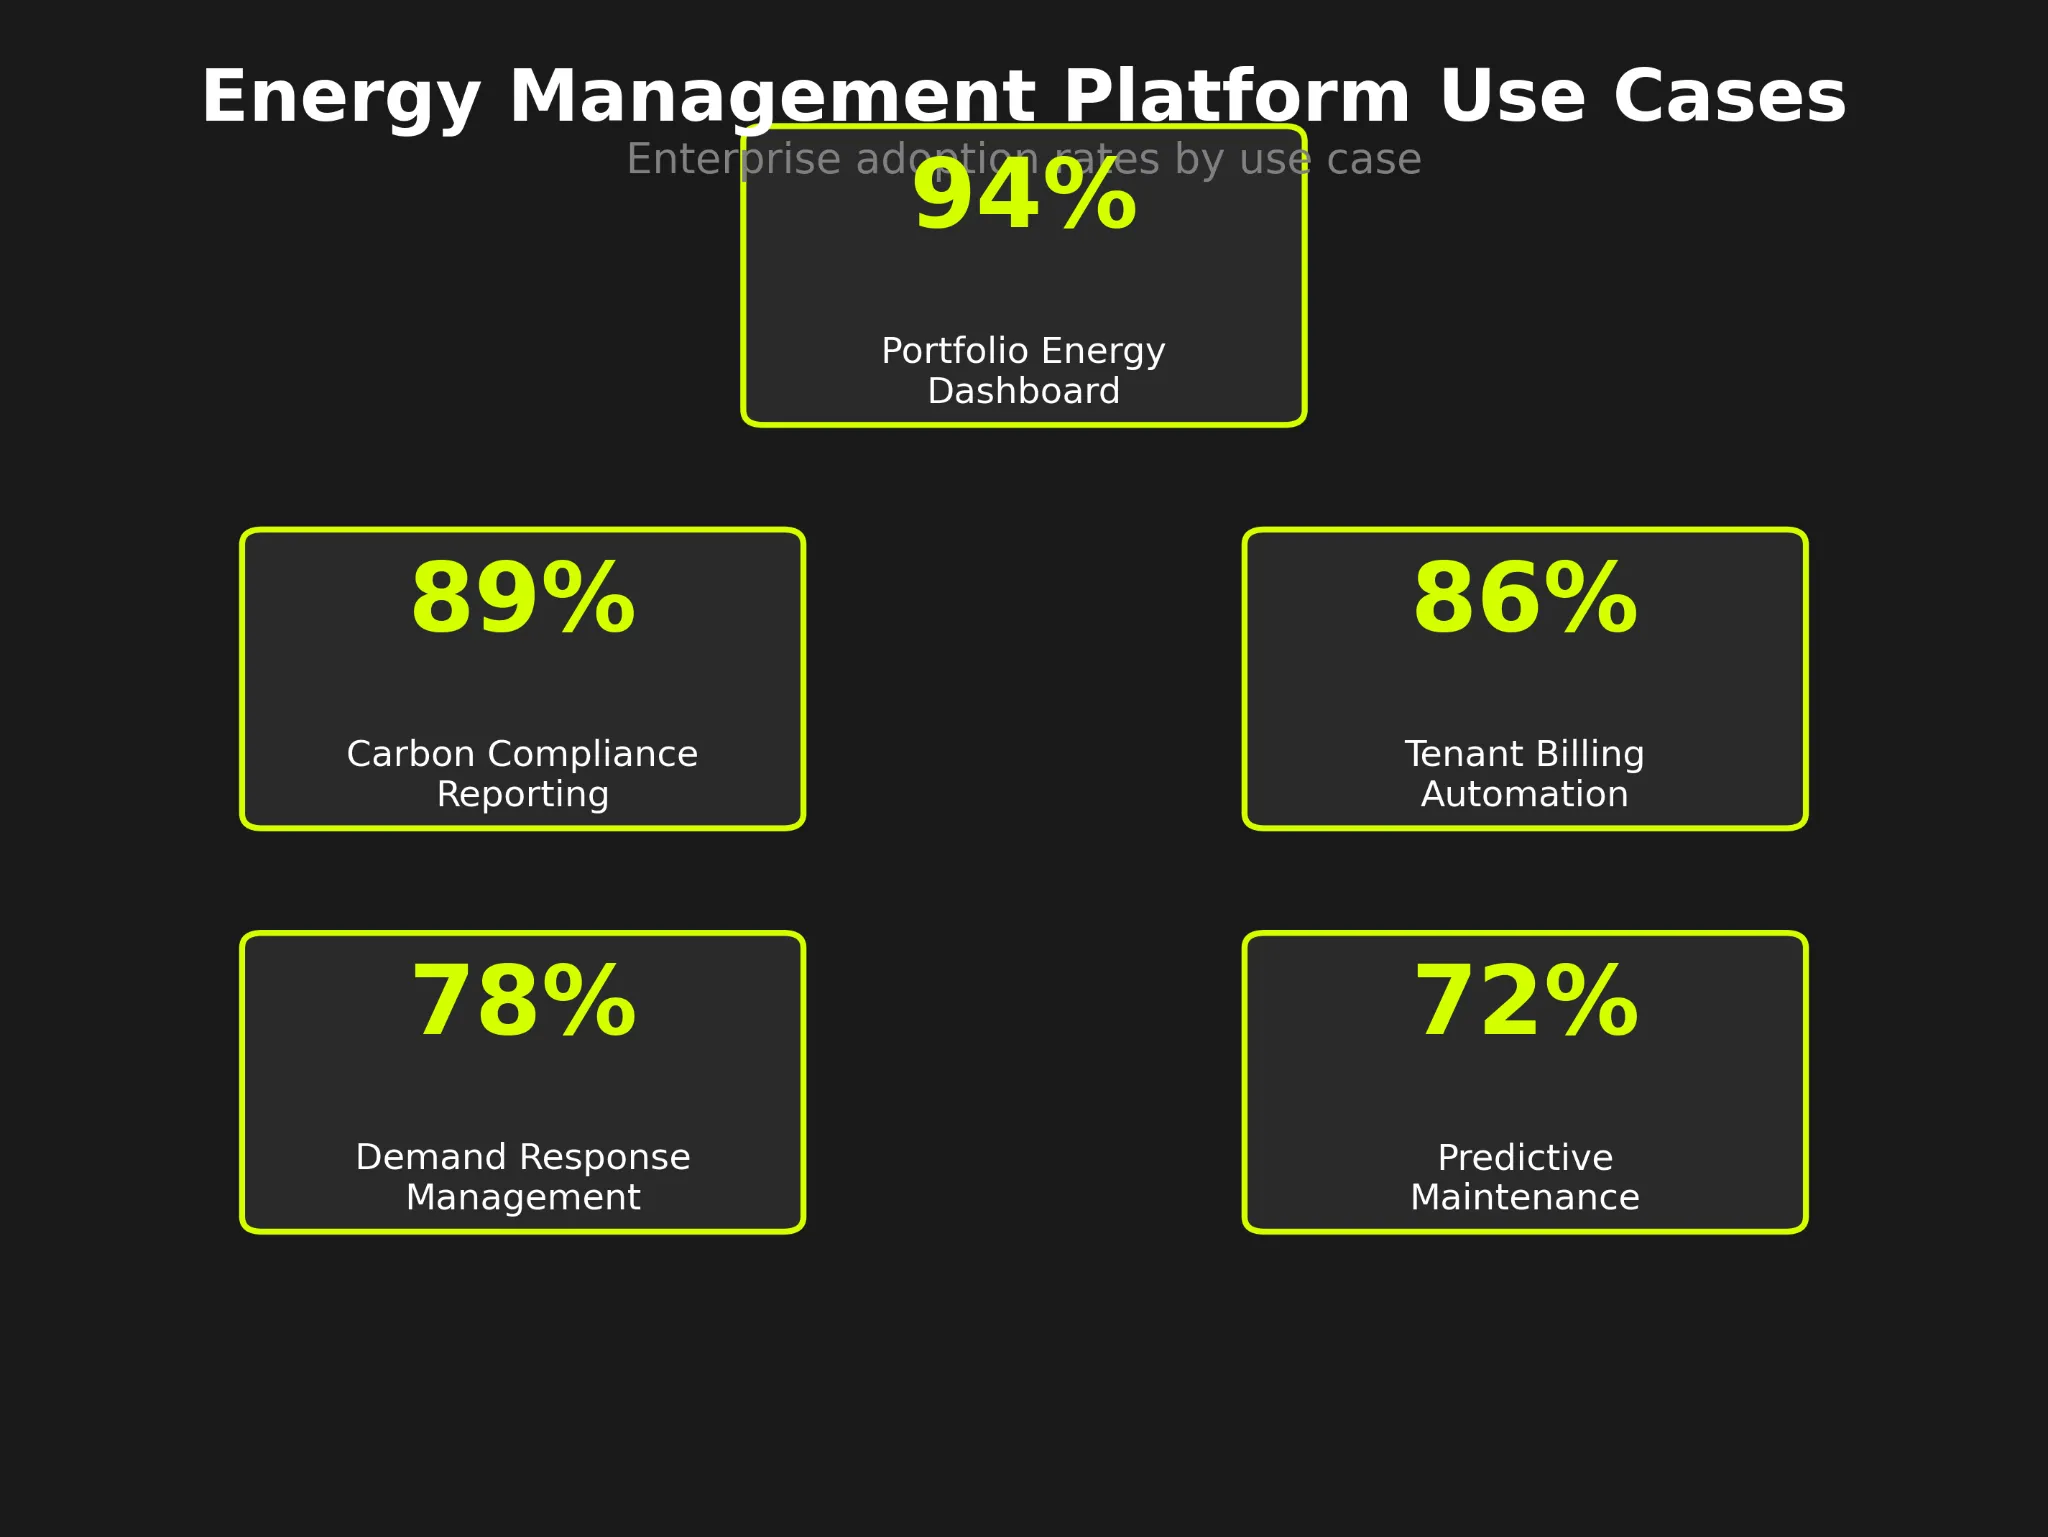
Portfolio Energy Dashboard
This is the primary interface where corporate teams monitor entire real estate or facility portfolios. It needs real-time energy consumption aggregated across all buildings with drill-down capability to individual meters. Cost analytics show utility spending trends, budget variance, and forecasted expenses. Performance benchmarking compares buildings against internal peers and industry standards identifying underperformers requiring intervention.
The dashboard must update continuously as meter data arrives. Energy managers checking portfolio status at 9 AM need data current within the last 15 minutes, not yesterday's totals. Alerts must surface automatically when buildings exceed thresholds, meters stop reporting, or costs spike unexpectedly.
Carbon Compliance Reporting
Sustainability teams need automated Scope 1, 2, and 3 emissions calculations following GHG Protocol methodologies. The platform must maintain emission factor libraries updated as regulatory agencies publish new values. Reports must export in formats satisfying CSRD, TCFD, ISSB, SBTi, CDP, and other frameworks without manual reformatting.
The compliance workflow includes data quality assurance flagging incomplete information before report generation. Audit trails must document every calculation, estimation, and assumption enabling third-party verification. Scenario modeling lets teams forecast emissions impacts of proposed efficiency projects or renewable energy purchases.
Carbon reporting has become the highest-value upsell in energy management platforms. Enterprises pay premium pricing for audit-ready disclosures reducing compliance risk and accelerating regulatory filings. Your platform needs compliance capabilities matching what specialized carbon accounting software provides while leveraging energy data already flowing through your system.
Tenant Billing Automation
Property managers need automated tenant invoice generation based on submeter readings, lease terms, and utility rate structures. The system must handle complex allocation methodologies, graduated rate tiers, and custom billing cycles per tenant. Tenant portals provide consumption visibility, historical comparisons, and bill validation before payment processing.
Automated billing reduces property management overhead by 70% while improving accuracy and reducing tenant disputes. When tenants access real-time consumption data and understand how charges are calculated, billing questions decrease dramatically. The platform becomes indispensable to property operations rather than optional analytics.
Integration with property management systems and accounting software eliminates double-entry. Meter readings automatically generate invoices that flow into accounts receivable without manual intervention. Exception handling flags anomalies requiring human review before billing tenants for clearly erroneous charges.
Demand Response Management
Energy platforms enable participation in demand response programs paying facilities to reduce consumption during grid stress events. The platform must monitor utility signals, forecast revenue opportunities, and automate load curtailment strategies maximizing payments without disrupting operations.
Demand response revenue often covers platform subscription costs entirely. A 50-building portfolio earning $200,000 annually from demand response programs views energy management software as cost-neutral while gaining all monitoring and compliance benefits. Your platform needs demand response capabilities as competitive differentiation, not optional features.
Automated controls ensure facilities meet curtailment commitments during events. The platform schedules HVAC setbacks, lighting reductions, and non-critical equipment shutdowns optimizing comfort while satisfying utility requirements. Historical performance tracking documents program compliance and revenue earned per building.
Predictive Maintenance
Facilities teams need equipment performance monitoring detecting efficiency degradation before failures occur. Machine learning models analyze consumption patterns identifying HVAC systems, lighting circuits, and other equipment operating outside normal parameters. Automated work orders trigger maintenance preventing costly emergency repairs and energy waste.
Predictive maintenance transforms energy platforms from monitoring tools into operational systems. Facility managers viewing energy dashboards also receive equipment health scores, maintenance recommendations, and failure risk assessments. The platform becomes central to facility operations rather than a separate analytics application.
Integration with CMMS and work order systems closes the loop. Anomaly detection identifies degraded equipment, the platform generates maintenance tickets, technicians resolve issues, and the system verifies performance returns to normal. This workflow demonstrates measurable value beyond energy cost savings.
Build vs Buy: The TCO Reality
Platform teams at energy management companies face a fundamental question: build analytics infrastructure internally or embed a specialized analytics platform?

The Build Path
Building comprehensive analytics in-house requires 18-24 months of sustained engineering effort. Your team needs data engineers building ingestion pipelines handling diverse meter protocols and data formats. Frontend developers creating dashboards, reports, and mobile interfaces. Backend engineers implementing anomaly detection algorithms, carbon accounting methodologies, and compliance frameworks. DevOps ensuring system reliability, security, and scalability.
Total cost reaches $2.5 million including direct engineering costs, infrastructure expenses, and opportunity cost from delaying feature releases. The timeline assumes no major setbacks, experienced teams, and clear requirements—optimistic assumptions rarely matching reality.
Maintenance costs persist indefinitely. Carbon accounting frameworks evolve annually. Anomaly detection models require retraining as building portfolios grow. Dashboard features need continuous enhancement matching competitor capabilities. Budget $500,000 annually maintaining internally-built analytics staying competitive.
Opportunity cost hits hardest. Those 18-24 months could have been spent on meter hardware improvements, BMS integration partnerships, IoT sensor innovation, or market expansion that actually differentiates your energy management platform. The engineering team building dashboards isn't building the energy technology that creates competitive advantage.
The Embed Path
Embedding specialized analytics platforms like Luzmo offers a dramatically different timeline and cost structure.
Weeks 1-2 cover data integration establishing API connections to your meter databases, BMS systems, and utility data sources. Historical data imports populate dashboards with baseline context. Building hierarchies and organizational structures map to your customers' portfolios.
Weeks 3-4 handle multi-building configuration setting up portfolio rollups, building-level isolation, and user permissions. Carbon accounting frameworks configure emission factors, reporting templates, and compliance workflows. Custom KPI definitions map your customers' energy metrics into dashboard components.
Weeks 5-6 focus on dashboard customization adapting pre-built templates to customer branding, configuring alert thresholds, and enabling tenant portal features. Mobile and desktop interfaces optimize for different user workflows. API access enables integration with customer ERP, CMMS, and accounting systems.
Week 6 completes pilot and rollout through beta testing with 2-3 customer portfolios, user training sessions, and full production deployment.
Total time: 6 weeks to production-ready analytics. Total cost: $90,000 annually depending on data volumes and building count.
The vendor handles framework updates when CSRD requirements change, performance optimization as customer portfolios grow, new compliance templates as regulations evolve, and mobile interface improvements matching user expectations. Your team focuses on meter accuracy, BMS integration quality, and energy technology innovation that actually differentiates your platform.
The cost comparison is stark. Build in-house: $2.5 million initial plus $500,000 annual maintenance equals $4 million over three years. Embed specialized platform: $270,000 over three years. The embedded solution achieves 89% cost savings while delivering 4X faster time-to-market.
Why Luzmo Wins for Energy Management Platforms
Luzmo was built for exactly this use case: product teams at B2B energy platforms that need to embed portfolio analytics without becoming analytics companies themselves.
Multi-Building Portfolio Intelligence
Row-level security ensures perfect data isolation between buildings while enabling portfolio-wide aggregation. Each building gets isolated dashboards and custom permissions. Corporate teams get portfolio rollups and benchmark analytics. Property managers see only their buildings rendered in custom branding with building-specific KPIs.
Real-Time Data Ingestion
Sub-second query latency handles millions of meter readings without dashboard lag. Pre-built connectors integrate with major BMS protocols, utility data APIs, and IoT meter platforms. The corporate sustainability dashboard updates in real-time as building data streams from facilities.
Carbon Compliance Frameworks
Built-in support for CSRD, TCFD, ISSB, SBTi, and CDP reporting templates. Automated emission calculations following GHG Protocol methodologies. Audit trail documentation proving data lineage from meter readings through emission factors to final disclosures. One-click exports generating compliance reports satisfying multiple frameworks simultaneously.
Tenant Portal Architecture
White-label tenant portals enabling consumption visibility, historical comparisons, and bill validation. Multi-tenant access controls ensure tenants see only their spaces. Automated billing integration generates invoices from meter readings without manual property management effort.
API-First Architecture
RESTful APIs enable integration with property management systems, accounting software, CMMS platforms, and ERP systems. Webhook support triggers workflows in external systems when anomalies are detected or thresholds exceeded. Custom integrations extend platform capabilities matching unique customer requirements.
Scales from 10 Buildings to 500+ Properties
The same architecture serves small commercial portfolios and multinational real estate enterprises. Multi-building performance doesn't degrade as property count increases. Corporate sustainability teams manage hundreds of facilities from a single control panel.
SOC 2 Type II Compliant
Security certifications ensure energy data protection meets enterprise standards. Compliance with GDPR for European operations, industry-specific regulations, and utility data protections gives legal teams confidence in platform security.
The Competitive Reality for Platform Builders
You're building in a market where hardware specs and BMS integration quality have largely commoditized. The competitive differentiation happens in the analytics layer: which platform turns energy data into cost savings, carbon reductions, and compliance confidence faster, more accurately, and with better portfolio intelligence.
Your platform competes on four dimensions: data integration breadth (how many meters, BMS systems, and utility APIs connect seamlessly), analytics depth (anomaly detection accuracy, carbon accounting comprehensiveness, predictive capabilities), compliance coverage (which regulatory frameworks the platform satisfies), and user experience (how quickly corporate teams and facility managers extract value from dashboards).
Market consolidation shows analytics quality drives M&A activity. Energy management companies recognize that embedded analytics capabilities—not meter specifications or BMS protocols—determine competitive advantage and enterprise customer retention.
Without embedded analytics infrastructure, your platform delivers:
- Generic dashboards that don't match enterprise portfolio workflows
- Manual carbon reporting requiring sustainability teams to export data into spreadsheets
- Inability to scale beyond 100 buildings without performance degradation
- Customer churn to competitors with better compliance reporting and portfolio intelligence
With embedded analytics infrastructure, your platform delivers:
- Portfolio-specific templates and carbon frameworks out of the box
- Multi-building analytics at scale (10 buildings to 500+ properties)
- Audit-ready compliance reports without custom development per customer
- Customer retention through data lock-in (switching means losing historical baselines and compliance continuity)
The platform choice determines your business model. Basic monitoring tools support single-site subscriptions at commodity pricing. Sophisticated analytics enable enterprise portfolio contracts, carbon reporting premium tiers, and retention rates exceeding 90% through irreplaceable institutional knowledge.
The Path Forward
If you're building an energy management platform, you face a decision point. The market is growing—projected to reach $132 billion by 2030 as carbon regulations tighten and enterprises commit to net-zero targets.
Your customers' expectations are accelerating. Real-time portfolio dashboards are now standard at enterprise scale. Carbon compliance reporting is becoming a mandatory platform capability as CSRD, TCFD, and other frameworks expand. Multi-building analytics performance determines which platforms win large commercial real estate and industrial facility customers.
Option 1: Build analytics infrastructure in-house
- 18-24 months development timeline
- $2.5 million total cost (engineering + opportunity cost)
- Engineering capacity diverted from meter innovation, BMS integration partnerships, and energy technology that actually differentiates your platform
- Risk of technical debt as compliance frameworks evolve and customer requirements expand
Option 2: Embed proven analytics infrastructure
- 6 weeks integration timeline
- $90,000 per year ongoing cost
- Engineering focus maintained on energy management innovations
- Production-grade dashboards, carbon compliance, and portfolio analytics handling enterprise requirements
The question isn't whether your platform needs embedded analytics. The market has answered: enterprise customers selecting energy management platforms prioritize analytics quality, compliance coverage, and portfolio scalability over meter specifications and BMS protocol support.
The winner in energy management platforms will be whoever makes multi-building intelligence seamless, carbon compliance automated, and portfolio management data-driven without 24-month build timelines diverting engineering from core energy technology differentiation.
The technical foundation exists. The business case is clear. The only question is whether your product team will deploy it before competitors do.
Enterprises don't renew energy management platforms for better meters. They renew for better portfolio intelligence.
Written by

Ship the future of your data
Let us show you what Luzmo can do for your product.

Leave your e-mail and one of our analytics experts will reach out to you