Iframe vs Web Component for Analytics: Updated Guide [2026]
![Iframe vs Web Component for Analytics: Updated Guide [2026]](/assets/migrated/c3af465b053d6f16.webp)
Iframes have been around since the early days of the internet. For years, web developers relied on these simple HTML elements to embed all types of content in their web pages. But technology evolves — and today, for embedded analytics specifically, the iframe is no longer just going out of fashion. It's becoming a product liability.
In this updated guide, you'll learn why the iframe vs SDK decision has become a product quality question, not just a technical one. We cover what's changed since we last wrote about this, walk through the honest pros and cons of each approach, and explain what composable analytics with the Analytics Component Kit (ACK) means for teams who want to go further than a standard dashboard embed.
Why say goodbye to iframes?
In modern software development, using iframes for analytics is like using a flip phone instead of a smartphone. If you want to embed external content on a webpage, iframes do the job just fine — but they lack the speed, integration, and user experience that modern embedding approaches offer.
The familiar limitations haven't changed:
- They can be slow to load
- They can pose security risks
- Embedded content can't always be indexed properly by search engines
- There's no communication between an iframe and other content on your webpage
- They're inflexible, posing issues for styling and responsiveness
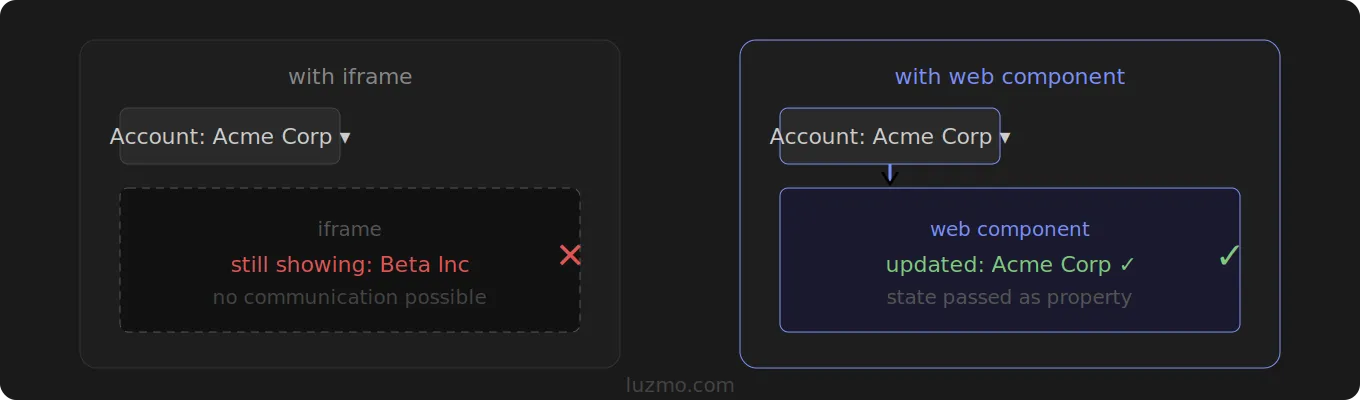
But in 2026, one limitation matters more than the others: iframes make analytics feel like a product inside your product, rather than part of it. When your user applies a filter elsewhere in your app, the iframe doesn't respond. When your user opens the analytics section on mobile, the fixed-width embed breaks. When you want to surface a single chart inside a workflow — not on a dedicated Reports page — the iframe forces you into workarounds.
These aren't just technical inconveniences. They're the kind of friction that quietly kills analytics adoption. Users don't file support tickets. They just stop opening the analytics tab.
What are web components?
Web components are a set of JavaScript APIs for developers to create reusable, custom elements that can be embedded in web pages and platforms. These widgets operate independently, so they don't interfere with other parts of your code.
Web components are based on 4 main specifications:
- Custom Elements: APIs that let you define new HTML tags and extend existing ones to create reusable web components.
- Shadow DOMs: define the CSS styles and markup of your web components.
- HTML Templates: define fragments of markup that are unused at page load, but can be instantiated later.
- ES Modules: a standardized system for JavaScript to import and export modules.
Web components are essential building blocks in a composable architecture. They help you break up a complex SaaS product or web app into smaller, manageable pieces of code that you can develop and maintain independently.
Although these components can exist independently, they can still interact with each other. Embedding dashboards or charts as web components makes them truly feel part of your app. Unlike iframes, web components can easily communicate with other parts of your application — filter elements, dropdowns, and other components — and they inherit your design system rather than fighting it.
Iframes vs web components: pros and cons
Is the iframe dead? Or are they still worth using in some use cases? Let's look at a quick comparison, including what's changed in 2026.
Iframe
Although iframes are considered outdated for analytics, they're still a reasonable choice when you want:
- Isolated environment: styles and scripts in the iframe can't affect the parent page.
- Extra security: sandboxing protects sensitive parent app data.
- Easy implementation: just drop in a simple HTML snippet — minimal dev lift.
On the flip side, forget about iframes if you want to avoid:
- No interactivity: iframes can't communicate with the parent app or other embeds.
- Accessibility issues: tricky for keyboard navigation and screen readers.
- Performance hit: slow to load, especially with multiple iframes or on mobile.
- Design inconsistency: iframes can't inherit your CSS variables or design tokens. Your analytics will always look slightly foreign inside your product.
Web components
While iframes are rigid, web components are designed for integration:
- Highly flexible: works with any JS framework (Angular, React, Vue, or vanilla JS).
- Encapsulation: no style or script leakage into the rest of the app.
- Customizable: create custom HTML tags and attributes to your liking.
- Low-maintenance & reusable: pick from a set of UI components and reuse them across projects.
- Interactive: can easily communicate with the parent app and other components.
- Design-system-aware: inherit CSS variables from your product, so analytics match your brand natively.
On the downside, there's still a learning curve:
- Requires JavaScript API knowledge to set up properly.
- Complex projects may need workarounds for older browser integration.
- Debugging quirks: occasional issues with Edge and Firefox.
Why web components are the new standard for embedded analytics
Web components offer a faster, smarter, and more integrated way to embed analytics into any software product. They're built for flexibility, making charts, dashboards, and other data experiences feel like a native part of your app — instead of being bolted on.
Platforms like Luzmo build on this approach with tools designed specifically for modern embedded analytics. With Luzmo Studio, teams can design and embed dashboards that integrate seamlessly with their product UI. Luzmo IQ lets users explore data through AI-powered conversational queries embedded inside the product. Together, these capabilities make it easier to move beyond static iframe embeds and build truly interactive analytics experiences.
Embed: https://www.youtube.com/watch?v=EVdnZv2IKNU
Here are three powerful ways to use web components right now to level up your embedded analytics.
Single embedded charts for faster performance
Sometimes you don't want to embed an entire dashboard. You just want to blend charts with other content — inside a project view, a customer record, or a report page.
With iframes, adding multiple charts drags down load times and limits your display options.
Web components keep things fast and flexible, letting you place each chart exactly where and how you want it.
Interaction between charts and parent app
The biggest advantage of web components is their interactivity. Two charts embedded as separate web components can easily interact with each other — and with the rest of your app.
For instance, a dropdown in your main navigation can instantly update all embedded charts on the page. Or one chart can filter another. This is the kind of experience that makes analytics feel like a first-class feature rather than a reporting sidebar.
From dashboards to composable data experiences
Iframes are great for embedding whole dashboards with minimal developer effort. But users expect more than a static dashboard full of charts. They expect smart insights where they need them — inside workflows, not beside them.
Web components are the first step toward composable analytics. You can drop individual charts, tables, or filters straight into your app — mixing and matching components exactly where they create value.
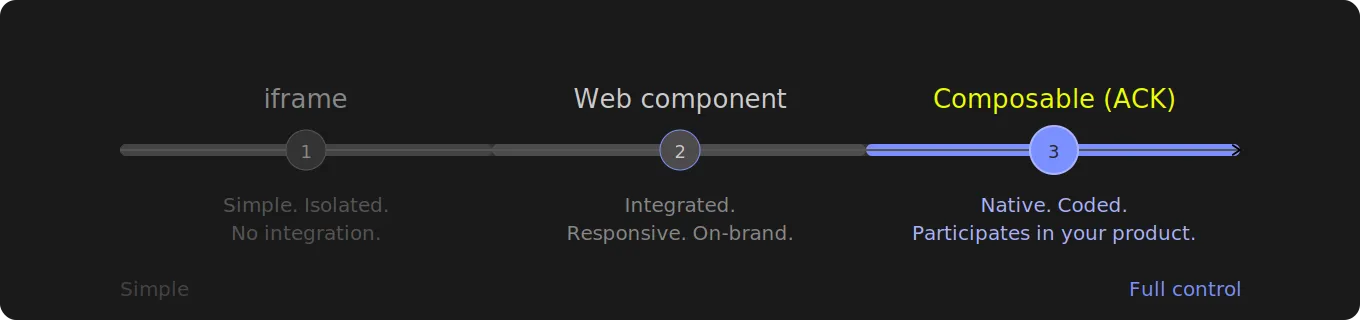
The 2026 update: composable analytics and ACK
When we first published this comparison, the choice was essentially binary: iframe for simplicity, or web component for better integration.
That framing is now incomplete.
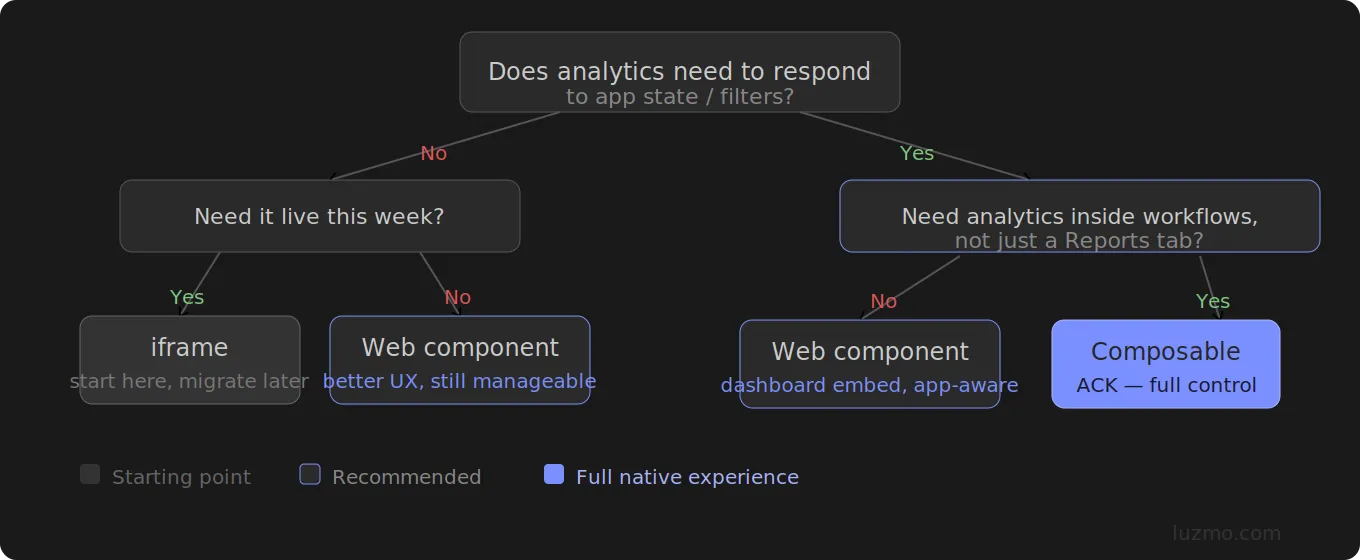
The more relevant question in 2026 is: how composable do you want your analytics to be?
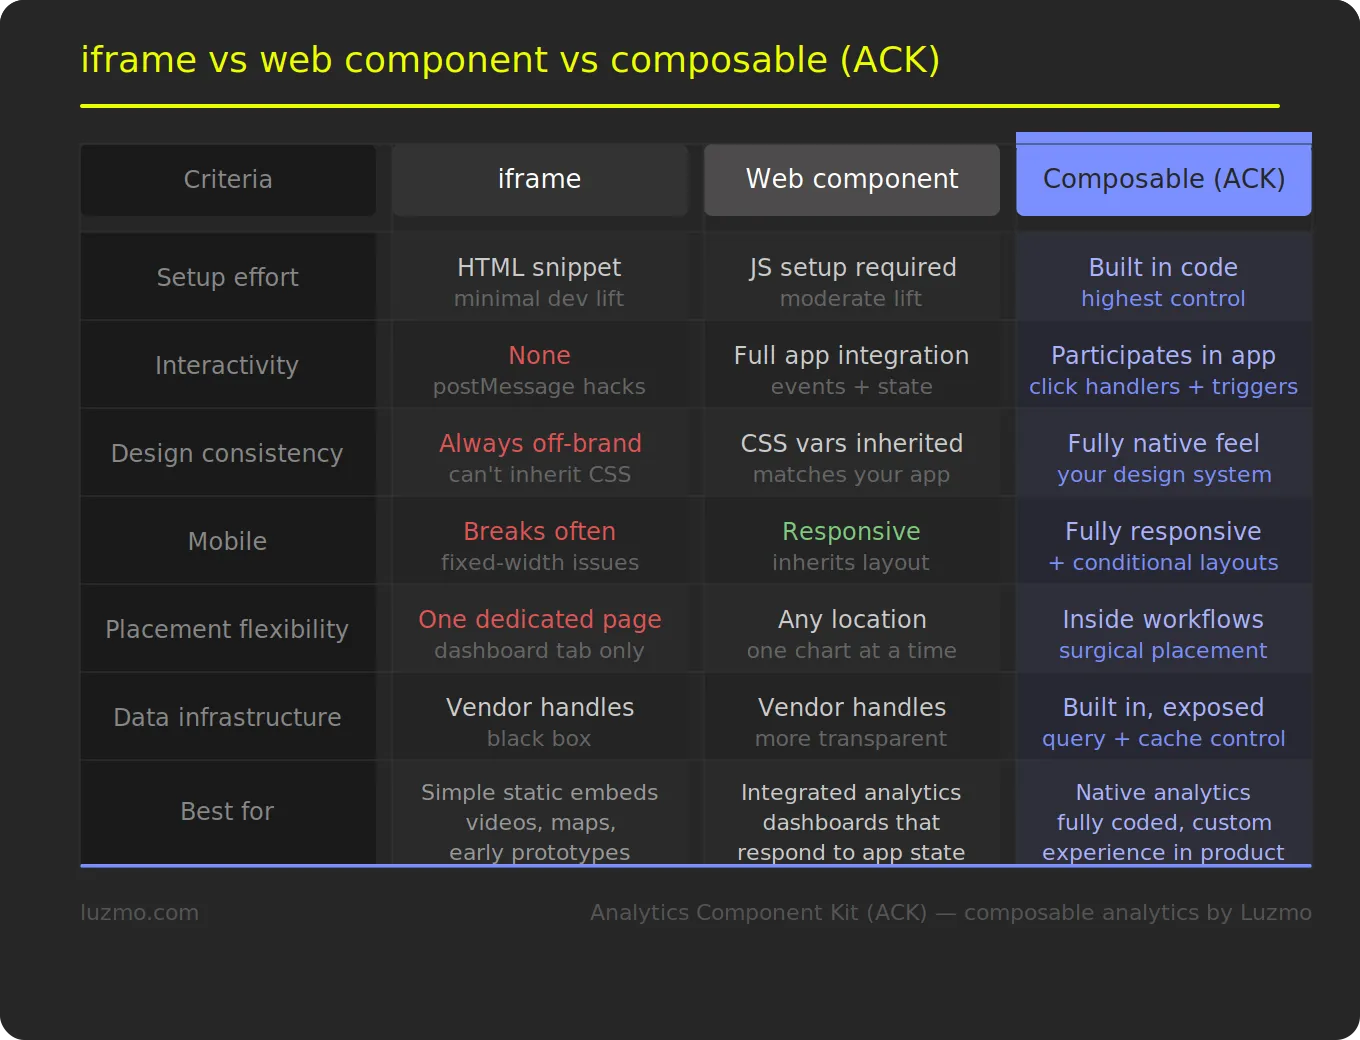
Luzmo's Analytics Component Kit (ACK) takes web component embedding to its logical conclusion. Instead of embedding a dashboard as a single web component, ACK gives development teams a library of modular analytics building blocks — individual chart types, filter controls, data tables, export functions, AI query interfaces — that can be assembled into a fully custom experience using code.
The components handle the hard infrastructure: data connectivity, query generation, caching, multi-tenancy, row-level security. Your team controls the experience layer: what gets displayed, where, how it looks, and how it interacts with the rest of the product.
The practical difference:
Standard web component embed: You take a dashboard built in a visual editor and embed it as a web component. Better than an iframe. But you're still constrained by the dashboard layout that was configured in the editor.
Composable with ACK: You build the analytics experience in code from the start. A bar chart here, a trend line there, a natural language query box below the fold. Charts wired to click handlers that trigger actions in your app. Analytics that don't just sit in your product — they participate in it.
This is what the composable analytics page covers in more detail. If you want the full technical picture — SDK setup, React/JS embedding, component API reference — the developer documentation is the right starting point.
Get started
At Luzmo, we support both approaches — web component embedding for teams who want better integration today, and ACK for teams who want to build fully composable analytics experiences.
With Luzmo's embedded analytics platform, product teams go from idea to integrated analytics in days, not months. See it in action with a free 10-day trial or book a demo with our experts.
FAQ
All your questions answered.
Are iframes still used in modern web development?
Yes — for certain use cases like embedding videos, maps, or third-party widgets, iframes still make sense. They provide an isolated environment and are simple to implement. But for complex applications like embedded analytics, they lack the flexibility, interactivity, and design consistency that web components provide.
Why are web components better than iframes for embedded analytics?
Web components integrate directly with your application, allowing charts and dashboards to interact with filters, dropdowns, and other UI elements. They communicate with the parent app, inherit your design system, and create a native-feeling experience. Iframes can't do any of that without fragile workarounds.
When should you use web components instead of iframes?
When you need deep integration between your analytics and the rest of your product. If you want charts that react to app state, filters that work across the whole UI, or analytics that appear inside workflows rather than on a separate Reports page — web components are the right choice.
What is the Analytics Component Kit (ACK)?
ACK is Luzmo's library of pre-built, modular analytics components — charts, filters, data tables, AI query interfaces — built on web component standards. It's designed for development teams who want to build a fully custom analytics experience in code, without having to build the data infrastructure underneath. See the composable analytics page for more.
What's the difference between Luzmo Flex and ACK?
Luzmo Flex is the developer SDK that handles the data layer — connections, queries, caching, multi-tenancy. ACK is the component library you compose on top of it. They work together: Flex does the data heavy-lifting, ACK provides the UI building blocks.
Written by

Ship the future of your data
Let us show you what Luzmo can do for your product.

Leave your e-mail and one of our analytics experts will reach out to you