Which Vue Chart Library To Use in 2025? The Definitive Guide

Vue is one of the fastest-growing web development frameworks. According to GitHub data, around 3 million people used Vue in 2022 to build front-end web applications. Fast-forward to today: the State of Vue.js 2025 report confirms that Vue now powers over 3.3 million live sites, nearly doubling since 2022.
It’s not just growth in numbers. Vue has matured into one of the top two most popular JavaScript frameworks worldwide, with 93% of developers likely to use it for their next project.
All these platforms generate a ton of data, but turning that data into visual dashboards for your users can be a challenge.
Luckily, there are many chart libraries for Vue that developers can use to build and integrate data visualizations quickly. But how quickly… that all depends on which library you decide to use.
In this article, we’ll compare the most popular Vue chart libraries, and walk you through the steps to build an insightful dashboard for your customers.
What is Vue.js?
Vue.js - or Vue in short - is a front-end web development framework for building web applications, especially single-page apps. This open-source JavaScript framework is a more lightweight alternative to heavier options like Angular or React.
Vue is particularly strong at building dynamic UIs, because its core library focuses on the view layer and automatically updates the interface when the underlying data changes. And thanks to its progressive nature, you can start small and scale at your own pace - perfect whether you’re adding a single chart widget or a full analytics suite.
The State of Vue.js 2025 report highlights a few important milestones:
- Vue 2 reached End of Life in Dec 2023, leaving Vue 3 as the ecosystem standard.
- Vue 3 has received major upgrades like Vue 3.4 “Slam Dunk” and Vue 3.5 “Tengen Toppa”, both improving reactivity and SSR performance.
- Vue 3.6 shipped in January 2025, introducing a reactivity refactor and an experimental ‘Vapor Mode’ for better runtime performance.
With these improvements, Vue is more performant and enterprise-ready than ever - making it a strong base for data visualization.
Why use Vue chart libraries for data visualization?
Analytics dashboards are just one of the many features you can add to a Vue-based app. But building data visualizations from scratch is resource-intensive. Especially as customer expectations grow. Today, users don’t just want static charts; they expect:
- Interactivity (filters, drilldowns, responsive tooltips)
- Advanced capabilities (forecasting, anomaly detection, real-time updates)
- Customization (dashboards tailored to their workflow)
These aren’t trivial to build. In fact, the survey behind the State of Vue.js 2025 shows that:
- 45% of Vue developers rely heavily on third-party chart libraries (making it one of the most common add-ons after UI frameworks).
- 80% of teams have standardized on Pinia for state management - proof that simplicity and maintainability win out as projects scale.
- 82% prefer TypeScript in their Vue projects, meaning strong type support in chart libraries is now a must-have.
Vue chart libraries address this need by offering pre-built, customizable components that help you ship dashboards faster. They let you focus on the business logic and user experience instead of reinventing visualizations.
More and more developers are choosing this path. With over 7.1 million weekly npm downloads as of Q1 2025, Vue has firmly established itself as the second-most downloaded JavaScript framework behind React. The majority of that growth is fueled by teams embedding charts, dashboards, and analytics into Vue-based SaaS and enterprise products.
Best Vue charting libraries to use in 2025
Just like you can build dashboards in React or Angular, there are many data visualization libraries you can leverage to add charts to your Vue application. Let’s look at some of the top Vue chart libraries.
Luzmo
If you want a solution that has all the bells and whistles - from deep interactivity to a seamless integration - Luzmo’s embedded analytics platform is the best choice. Besides data visualization libraries for Angular and React, they also have a Vue component for dashboards.
It works for Vue 2 and Vue 3 applications, and is installed and embedded with just a few lines of code. You can build dashboards and data visualizations straight from their drag-and-drop UI, and embed them into any Vue app.
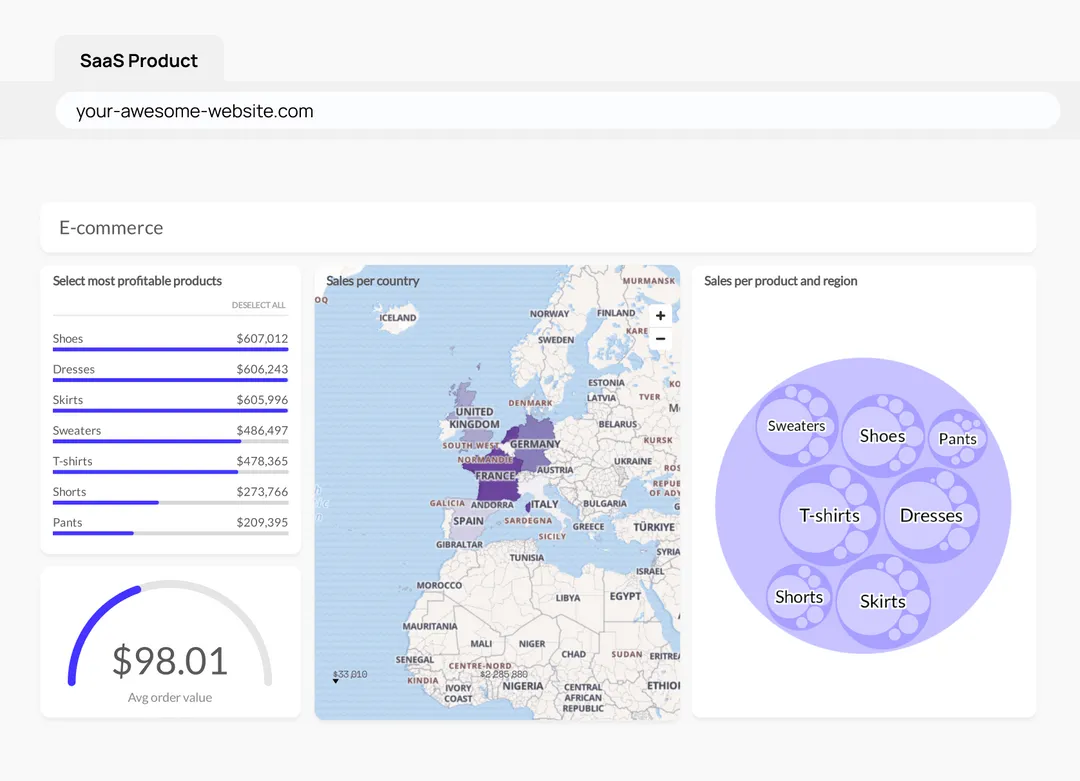
It comes with full white-labeling, the option to customize dashboards based on who’s using your app, secure authentication and many more features. Using their API, you can set up deep interaction with your app, and adapt the analytical features exactly to your liking.
Luzmo is especially great for product teams where non-technical people need to make adjustments to the dashboards, since you don’t need a developer to do so. The combination of easy set-up for devs and business users makes it stand out from other libraries that require the help of a developer for every small change.
vue-chartjs
Chart.js is one of the most popular JavaScript chart libraries, alongside of D3.js. Vue-chartjs is their wrapper for creating charts in Vue. It lets you build out charts and graphs as Vue components, which you can then easily integrate within any Vue application. It also integrates well with apps built in Nuxt.js.
Vue-chartjs is a great option if you need a component-based structure. It uses reactive charts, meaning if your chart data or options change, your charts will automatically update. Although less customizable than tools like Luzmo, you can change a range of options like colors, labels, responsiveness and more.
ApexCharts
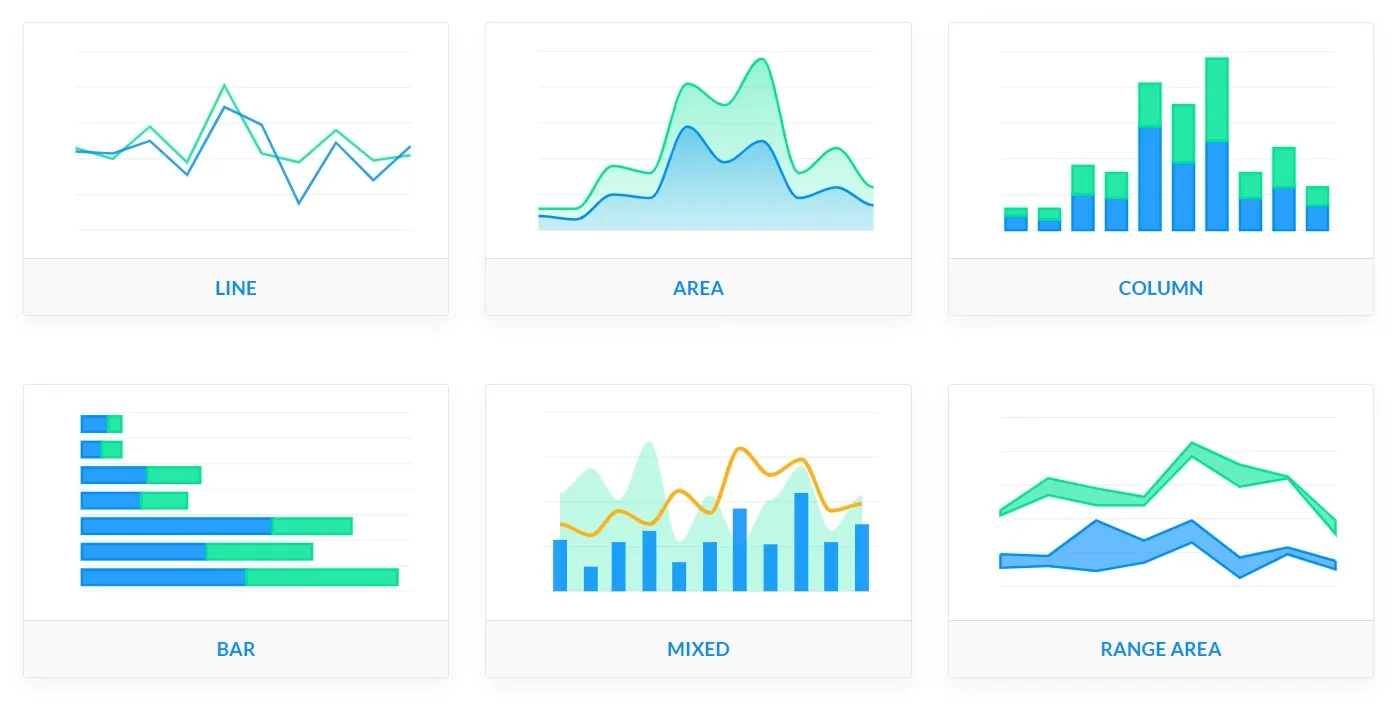
ApexCharts is another open-source library with integrations for Vue. If you have an eye for nice design, ApexCharts is worth considering for its beautiful charts. Their interactivity is pretty impressive too, offering animations, tooltips, zooming and panning, and more.
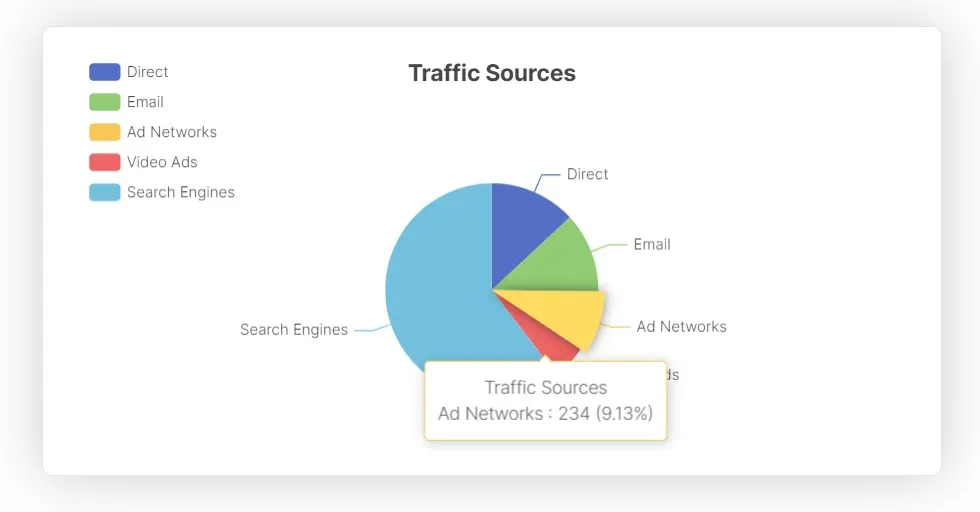
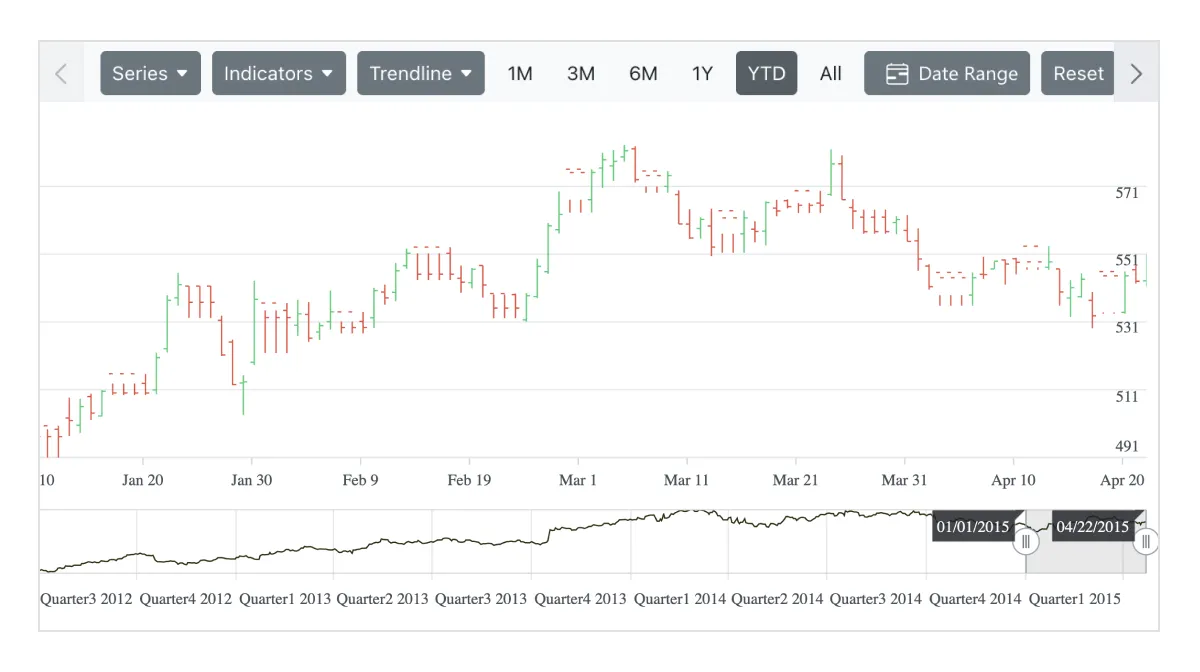
Besides the common bar chart, line chart and donut or pie chart, it also supports more complex types like heatmaps, radar charts or candlestick charts. Although less comprehensive in features than embedded analytics tools, it can be a good free alternative if you want something that looks good.
Fusioncharts
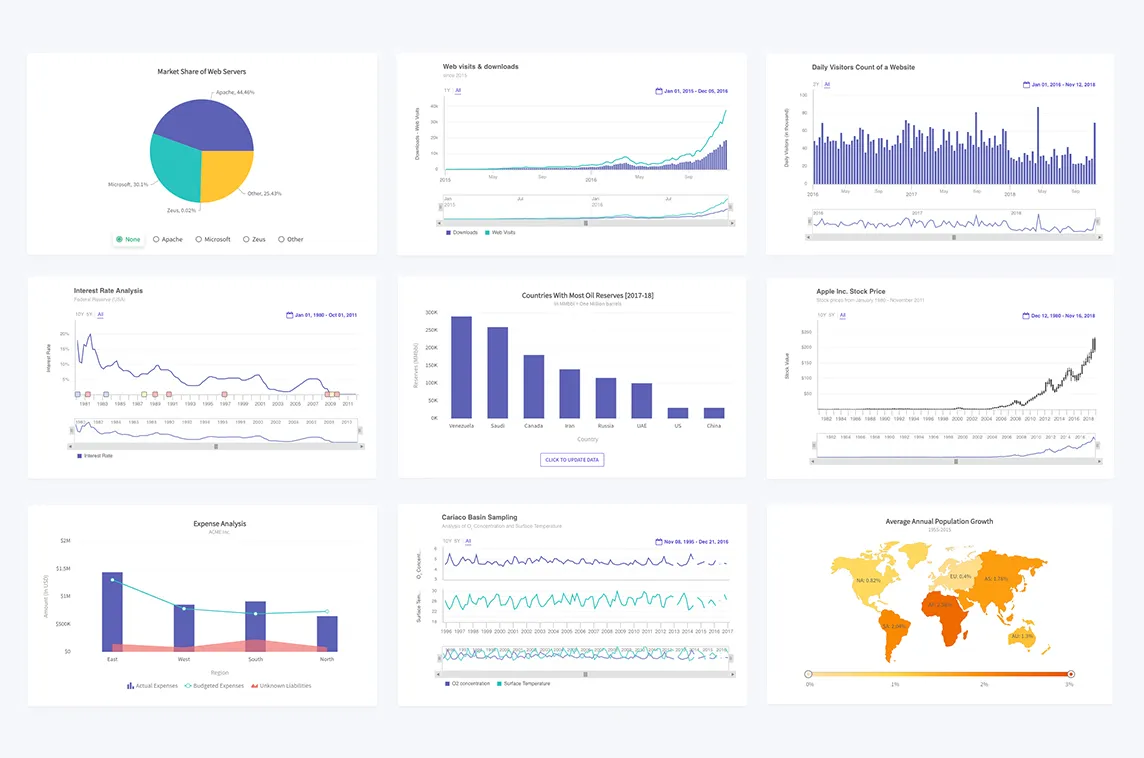
FusionCharts is one of the oldest charting libraries, and therefore deserves its place on this list. Its main draws are the many types of charts, the data formats supported - including JSON and XML files - and the deep interactivity options with drilldown, chart exports and annotations.
If you’re looking for a TypeScript-friendly library, Fusioncharts is one of the best options on this list because it was written using TypeScript.
Although it is a robust framework with a Vue-specific wrapper, it feels less modern and intuitive than some of the newer chart libraries. The learning curve is a bit steeper, and it’s on the heavier side which means performance may not be great.
Since being acquired by Idera, FusionCharts development has slowed, and many developers now lean toward more modern libraries like ApexCharts or ECharts for long-term support.
vue-echarts
Similar to vue-chartjs, vue-echarts is a wrapper around ECharts, a popular library for data visualization, specifically for integrating in Vue projects. Like most chart libraries mentioned here, it comes with many different chart types and lots of customization options to control the look and feel of your data visualizations.
Their SVG rendering is a nice bonus if you need high-resolution graphics or deep CSS styling. But what really sets vue-echarts apart is performance: it’s great for handling a large amount of data points. However, its many customization options can be overwhelming and less user-friendly for beginners.
Syncfusion vue charts
Syncfusion offers a library of UI components for building web and mobile apps. Among them, they have chart components for Vue ranging from simple to more complex chart types, and a range of interactivity features.
If you are using Syncfusion to power other components of your Vue app, like grids or event scheduling, it is a more holistic library than others on this list. However, if you are laser-focused on data visualization and analytics, it can be a hassle to integrate only the specific Syncfusion components you need. In that case, easily integratable tools like Luzmo may be a better fit.
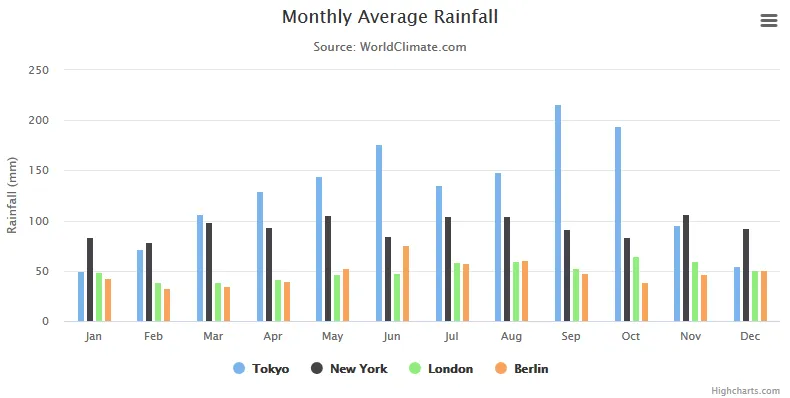
Highcharts Vue
Like most libraries on this list, Highcharts is a popular data visualization library that you can use for different front-end frameworks. With its specific wrapper for Vue, you can take advantage of Vue’s reactivity, meaning any updates to your data or structure will run smoothly and automatically.
Besides many chart types and customizations, Highcharts Vue is particularly good for accessibility and internationalization. However, unlike many open-source alternatives on this list, Highcharts comes with a license cost. Even though it’s one of the more premium options on this list, its API still has a pretty steep learning curve compared to easier-to-use tools on this list, like Luzmo.
How to build a Vue dashboard with Luzmo
In this short tutorial, you’ll learn how to add a customer dashboard to your Vue app using Luzmo’s Vue component. If you’re using a different library mentioned above, you might need a few extra steps.
1. Install npm package
First, you’ll install the Vue npm package to start using the data visualization library. If you don’t have a Luzmo account yet, you’ll also need to create one (free trials are available).
2. Connect data
If you’re using a database or data warehouse like Snowflake or Redshift, you can connect new datasets in just a few clicks. If we don’t support your favorite data source yet, you can easily plug them into your dashboard with Luzmo’s plugin API.
3. Create the dashboard
You can now create interactive charts and dashboards on top of your new datasets. All you need to do is drag and drop data and charts onto a canvas. Developers love it, because they don’t have to spend time on maintenance and updates. Instead, their colleagues in customer success or account management can easily make changes and publish updates to your app, without having to touch a single line of code.
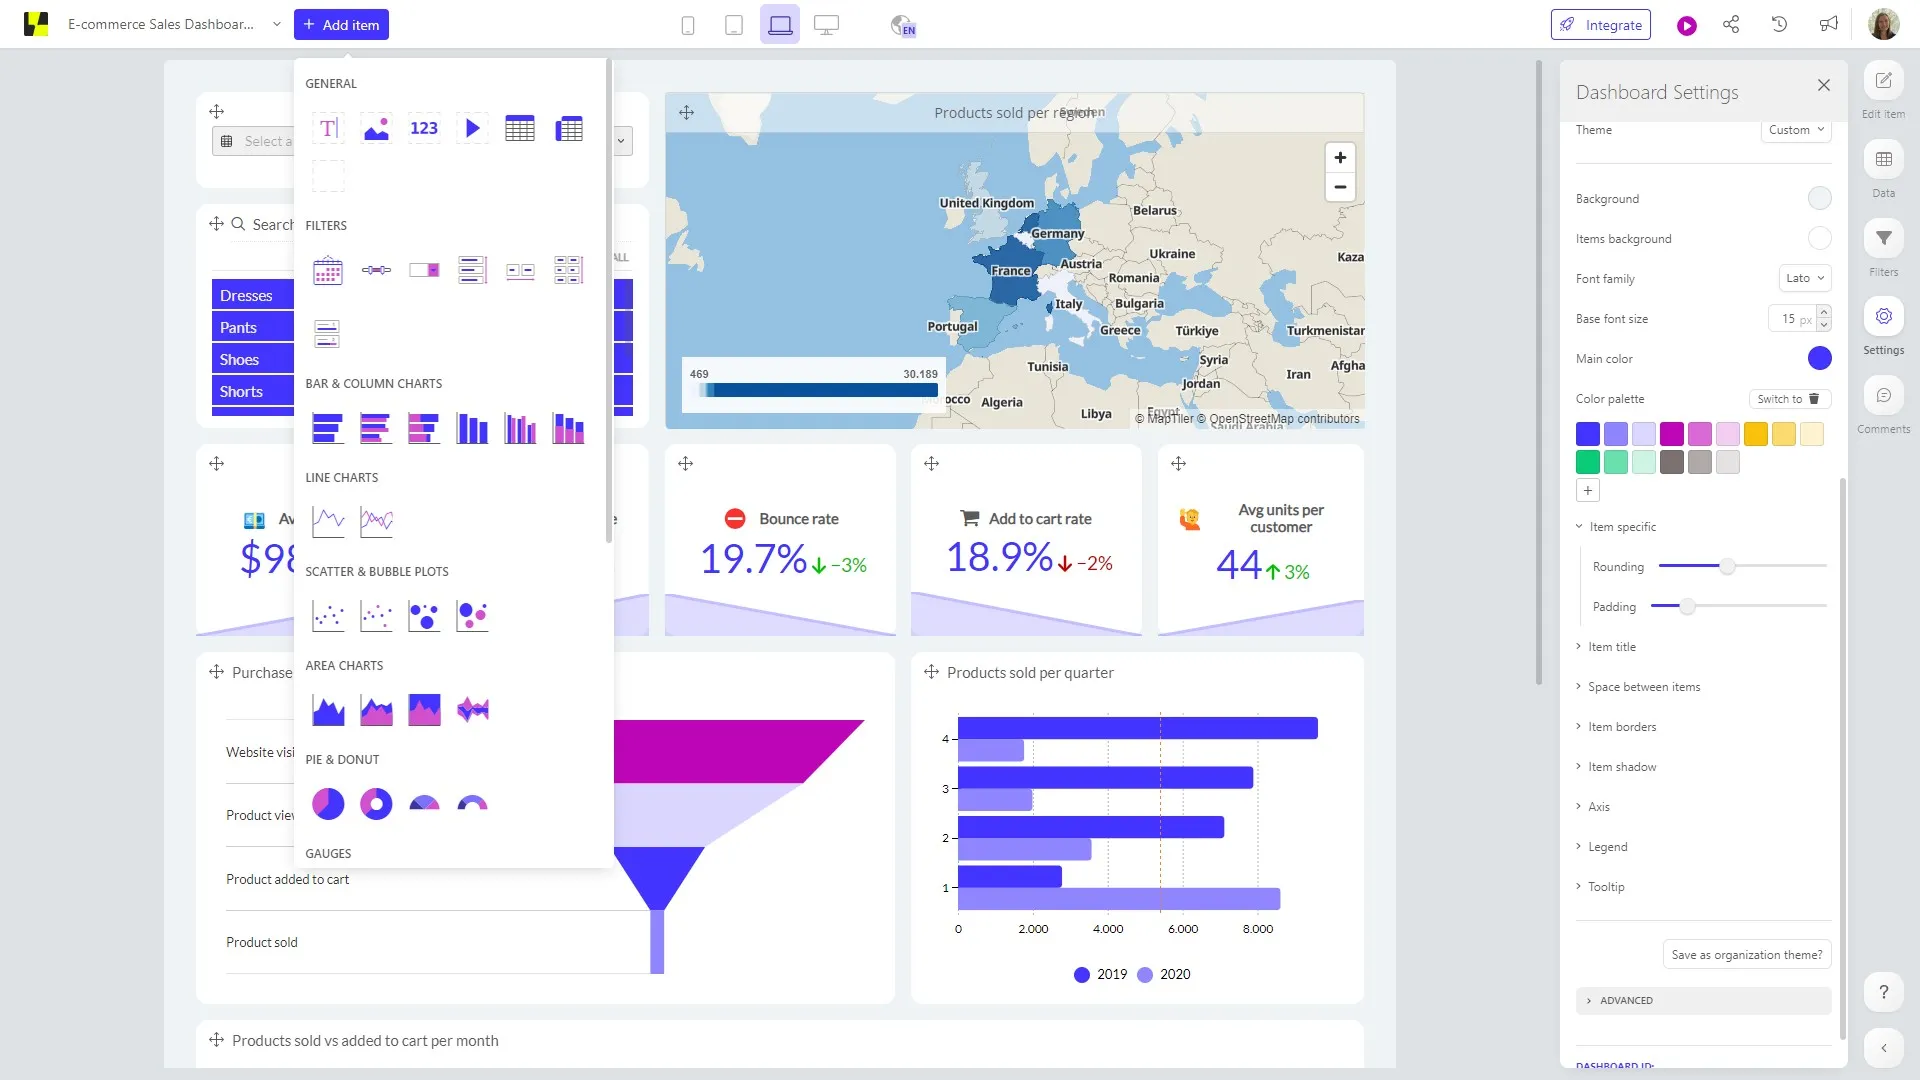
4. Embed dashboards in your Vue app
When your dashboard is ready, you’ll use the Vue library to embed dashboards into your application. You can customize the fonts, colors, background, spinners, or even the timezone you want to use in your dashboard.
If you want to go the extra mile and personalize dashboards for your customers, you can set access rules with Luzmo’s Vue library. Depending on which user is logged in, they will see different data or dashboards.
If you want to make the dashboards interact with other parts of your applications, you can easily do so by adding just a few lines of code to the library. You can find more instructions to set this up on npm and in Luzmo’s developer documentation.
5. Publish
You’re all set to launch analytics dashboards in your SaaS app during your next deploy!
Getting started with Vue dashboard libraries
The amount of options to build dashboards in Vue can be overwhelming. Embedded analytics tools are a great future-proof solution. As your customer base grows, you can scale up your dashboards, and add more features if your customer needs change.
Luzmo integrates seamlessly with Vue applications. With its easy-to-use Vue library, you’ll get the job done in days, not months. The intuitive BI interface is a huge advantage if you don’t want to worry about maintenance and dashboard upgrades. Your client-facing team members can manage everything without writing a single line of code.
Sign up for a free trial - no strings attached - and find out if Luzmo is right for you!
Written by

Ship the future of your data
Let us show you what Luzmo can do for your product.

Leave your e-mail and one of our analytics experts will reach out to you