 ChatGPT
 Perplexity
.png)
.png)
.png)
Build your first embedded data product now. Talk to our product experts for a guided demo or get your hands dirty with a free 10-day trial.

.png)
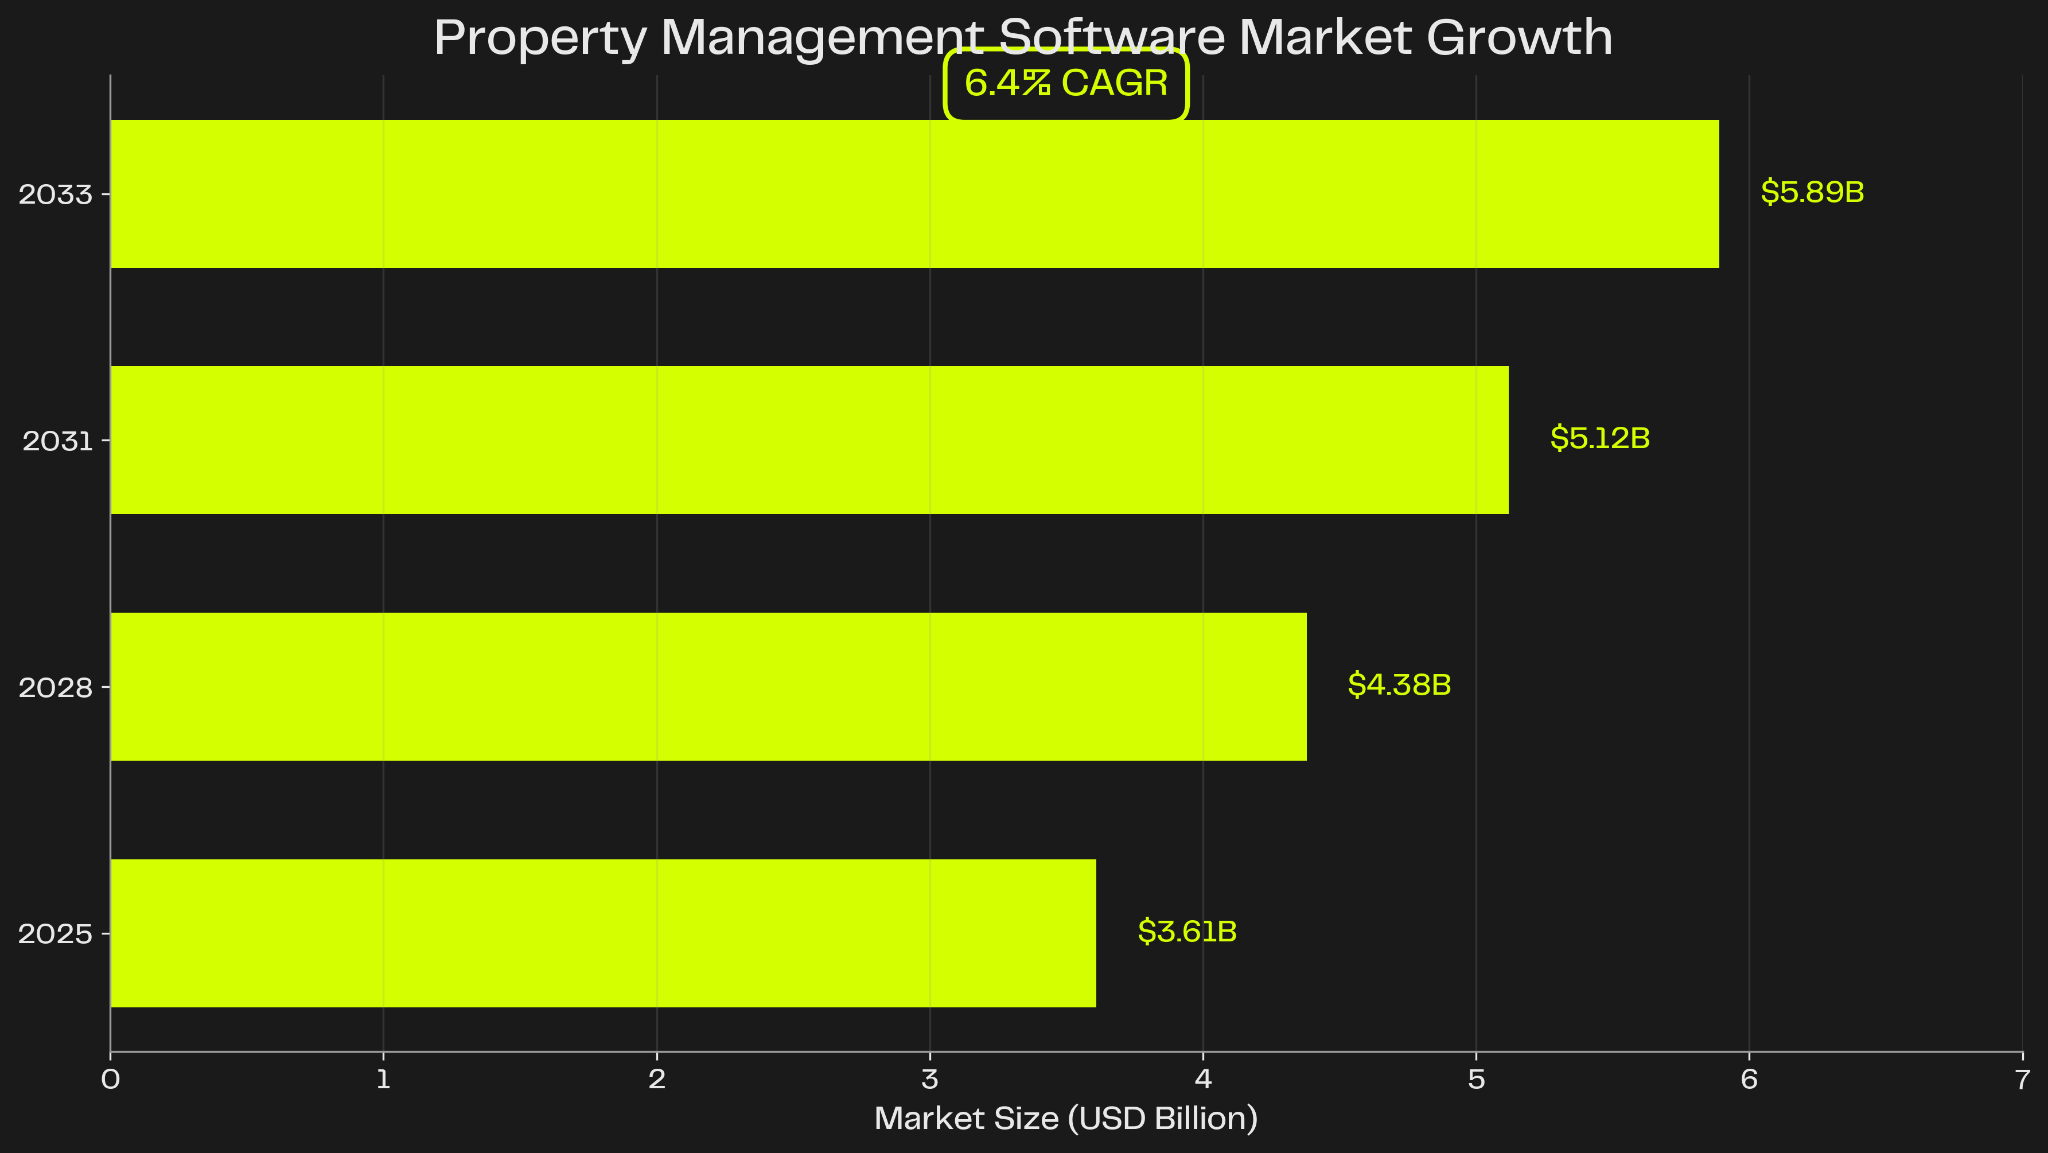
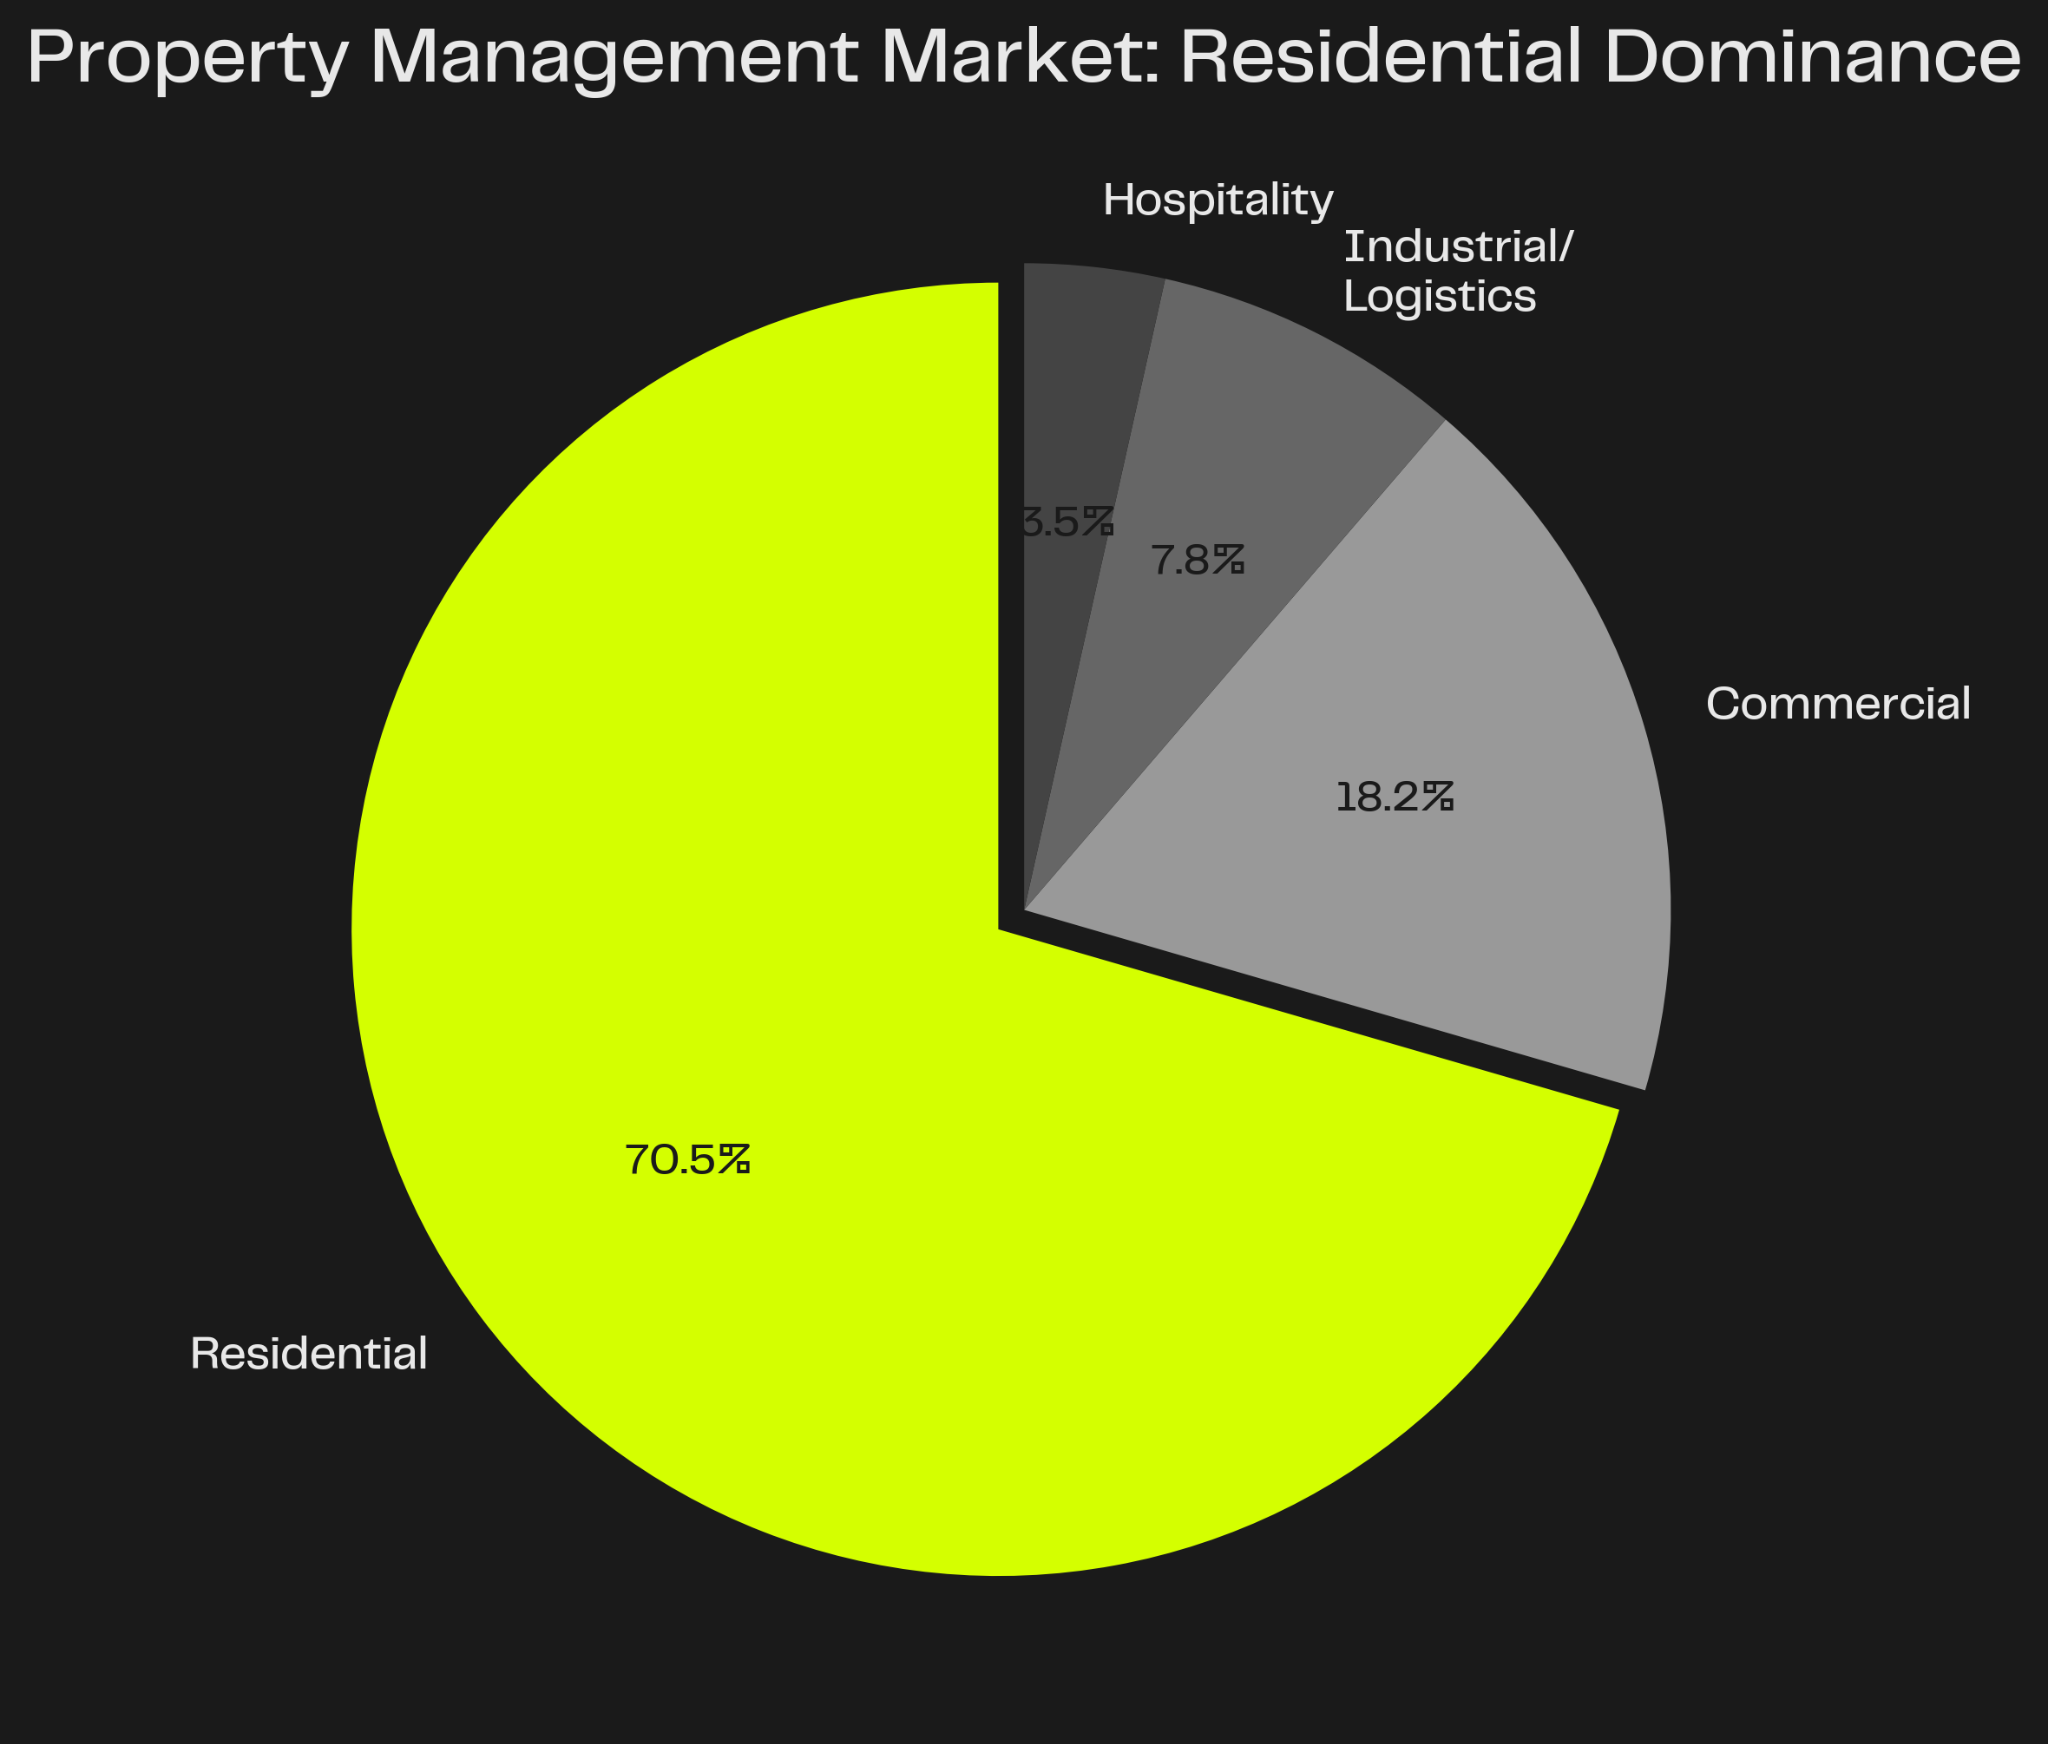
The property management software market is growing fast—from $3.61 billion in 2025 to $5.89 billion by 2033, driven by cloud adoption, AI integration, and the digitization of residential real estate operations. But as platforms like Buildium, AppFolio, Rent Manager, and Propertyware compete for property manager market share, one feature has quietly become the retention battleground: property analytics.
Property managers don't just need software to collect rent and track leases. They need to understand portfolio performance at a glance. Which properties have the highest occupancy? Which units are bleeding cash on maintenance? Where are late payments clustering? When are lease expirations creating vacancy risk?
When PropTech platforms fail to surface these insights—or bury them behind clunky exports and manual spreadsheets—property managers churn to competitors. When platforms nail property analytics, they unlock premium tier revenue, slash support costs, and build long-term stickiness with customers who depend on their dashboards every single day.
This article explores why property analytics has become non-negotiable for residential PropTech platforms, which infrastructure challenges make in-house builds expensive and slow, and how embedded analytics solutions like Luzmo let platforms ship landlord dashboards in weeks instead of months.
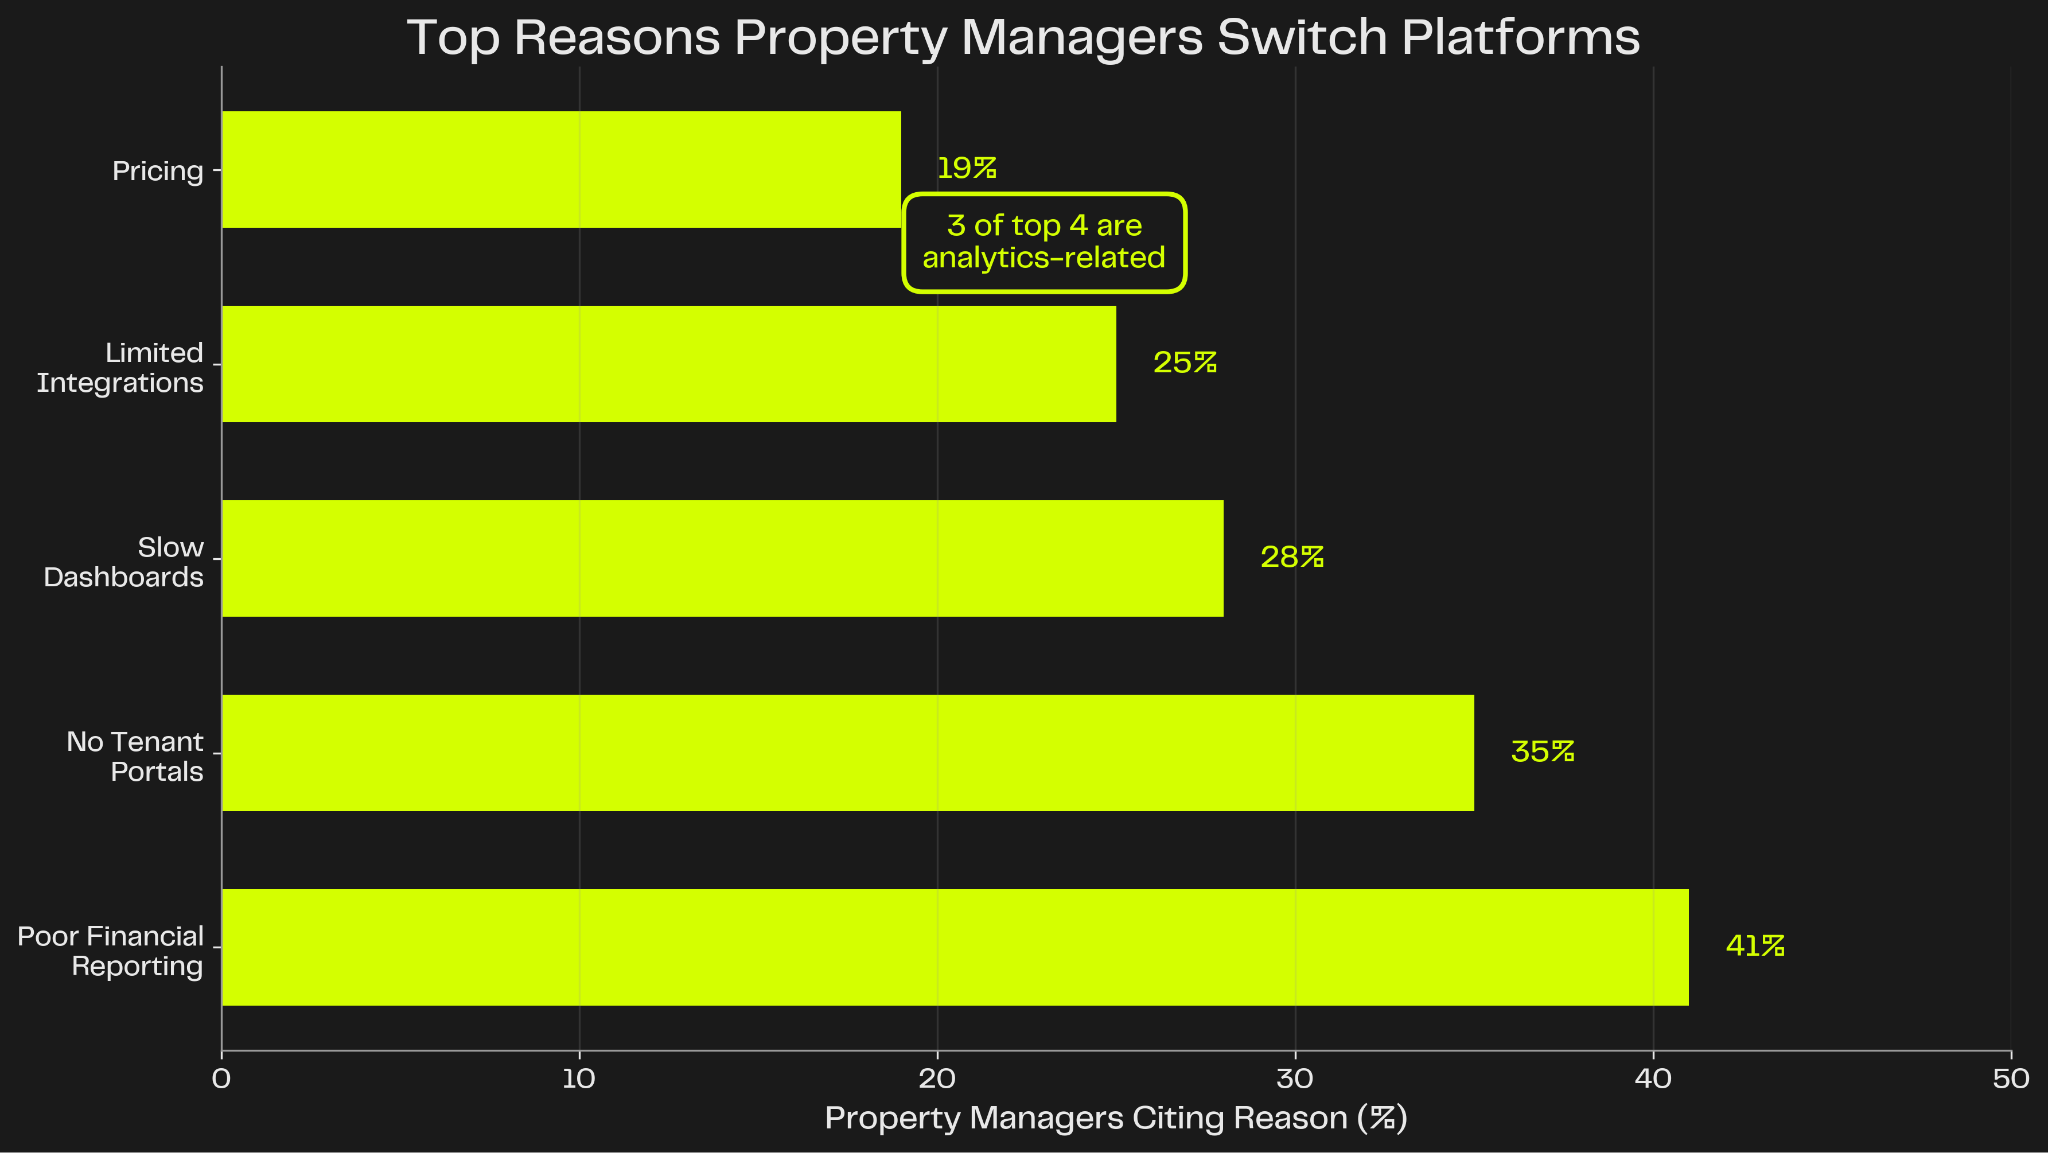
Here's the data that should concern every PropTech product team: 41% of property managers cite poor financial reporting as their primary frustration with property management platforms. Add in lack of tenant self-service portals (35%) and slow dashboards (28%), and analytics-related pain points dominate the top four churn drivers in the residential PropTech space.
Property managers live in dashboards. A Buildium user checking this month's rent collection. An AppFolio customer tracking occupancy across a 50-unit portfolio. A Rent Manager landlord reviewing maintenance costs by property. These aren't occasional check-ins—they're daily operational workflows that directly impact cash flow decisions.
When property managers can't answer basic questions like "What's my portfolio-wide occupancy rate?" or "Which properties are profitable this quarter?" without exporting CSVs or opening support tickets, frustration compounds. Support teams get flooded with "How do I run this report?" requests. Property managers start evaluating competitors who make data accessible. Churn accelerates.
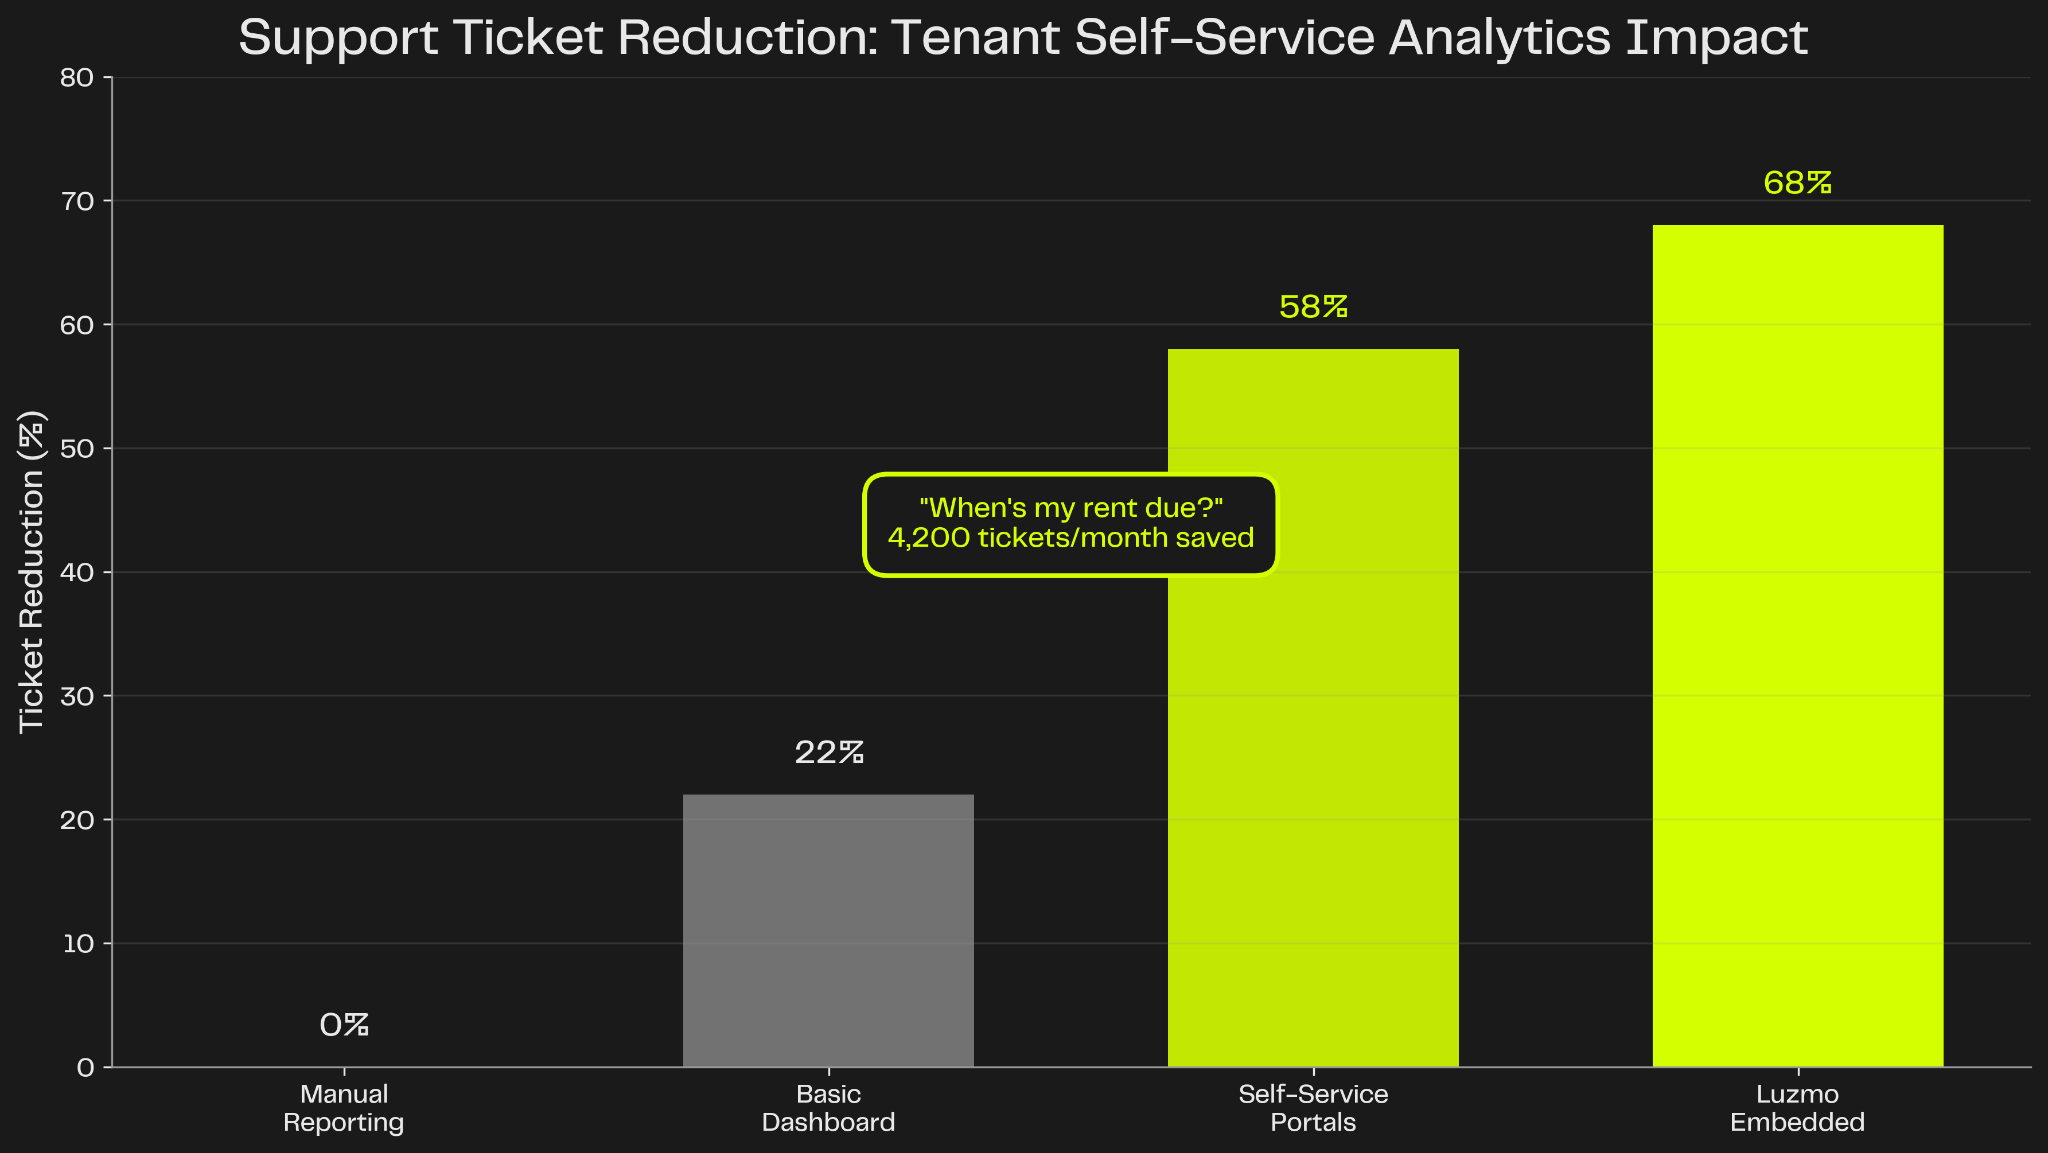
The gap isn't about having some reporting—it's about having self-service analytics that property managers can explore independently. Platforms that implement robust tenant self-service portals and property manager dashboards reduce support volume by 58-68%, directly translating to lower operational costs and higher customer satisfaction.
Most PropTech engineering teams underestimate the complexity of building property analytics at scale. Creating a rent roll report is straightforward. Building multi-tenant, real-time, white-labelable analytics infrastructure that scales to thousands of property managers (each overseeing dozens of properties with hundreds of tenants)? That's a fundamentally different engineering challenge.
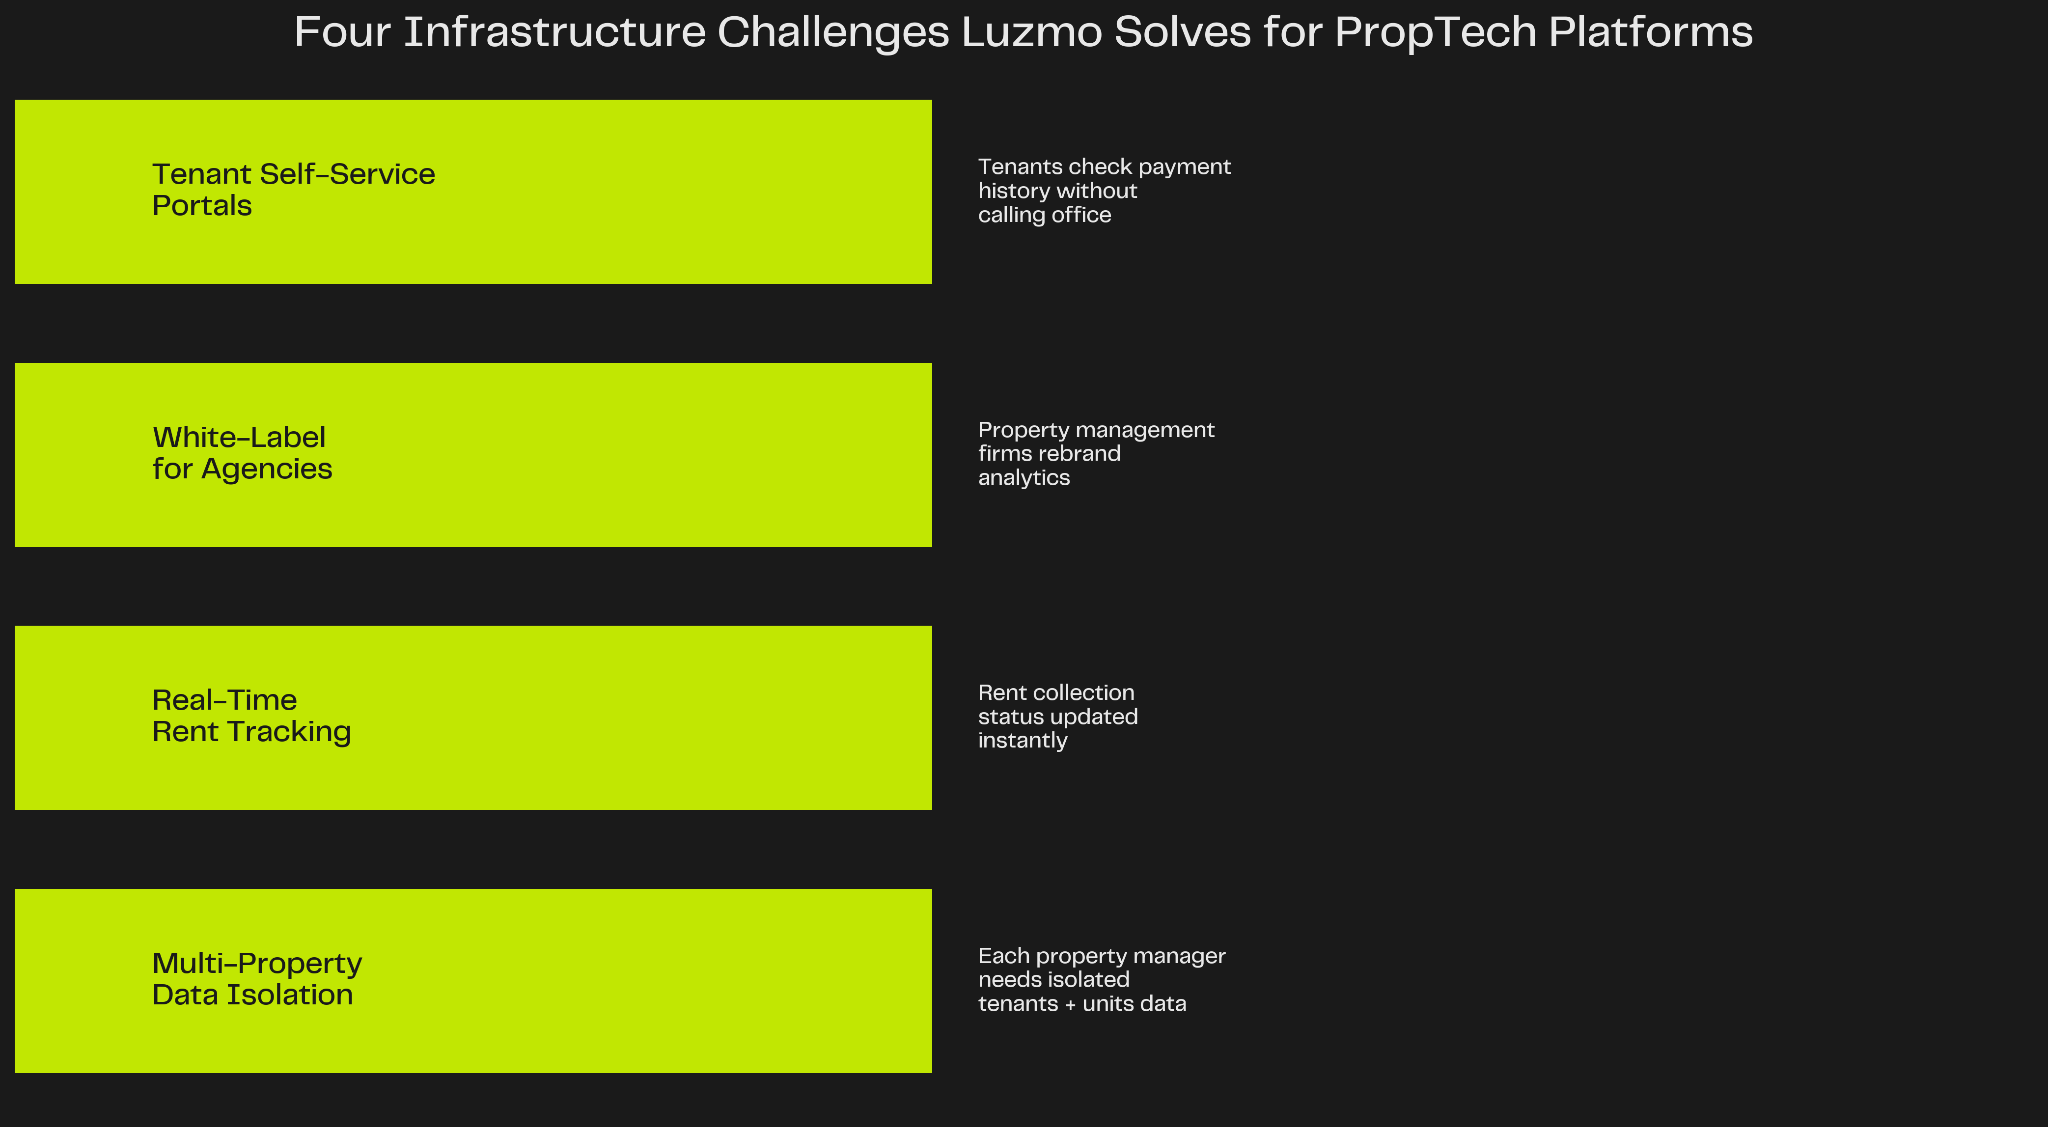
Each property manager's data must be completely isolated. Accidentally showing Property Manager A's tenant payment data to Property Manager B is a catastrophic compliance failure and instant trust violation.
Multi-tenant architecture for PropTech requires:
Building secure, performant multi-tenant property analytics typically adds 4-6 months to project timelines.
Property managers need instant visibility into rent status. Who paid today? Who's late? What's the total collected this month vs. last month? Batch processing that updates dashboards once per night feels broken when dealing with time-sensitive rent collection workflows.
Real-time rent tracking infrastructure means:
PropTech platforms building real-time infrastructure typically invest 5-8 months before dashboards feel responsive.
Many property management firms want to resell branded portals to property owners. Those owners should see the firm's branding—not the underlying PropTech platform's logo.
White-labeling property analytics requires:
Implementing true white-label capability typically takes 3-5 months and creates ongoing maintenance overhead as design systems evolve.
Tenants don't want to call the office to check when rent is due or view their payment history. They want self-service portals where they can see lease details, payment schedules, and maintenance request status without human intervention.
Self-service tenant portals require:
Building robust self-service portals that property managers and tenants use—without generating support tickets—typically takes 4-7 months of iteration based on user feedback.
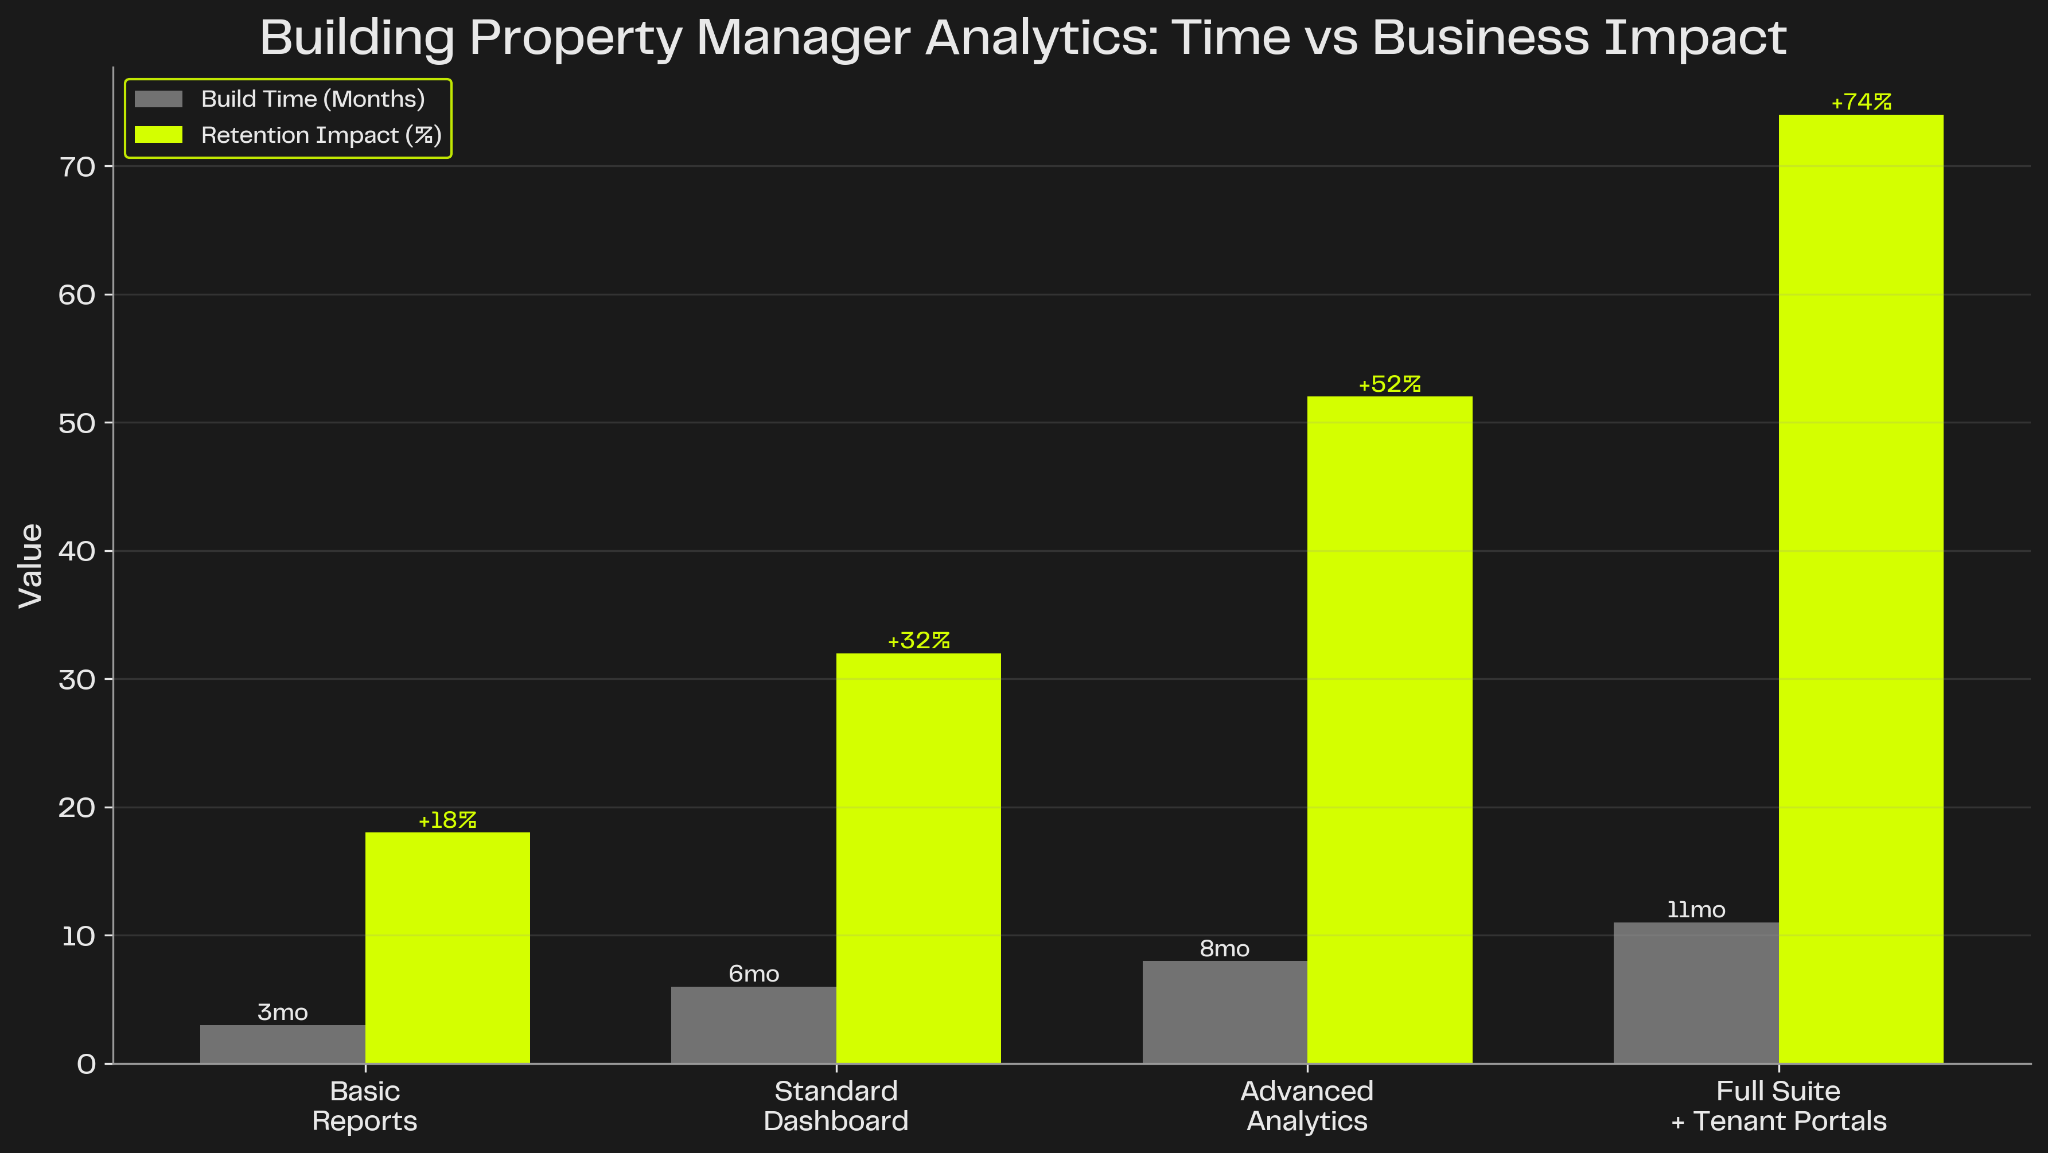
When you add up these timelines, building property manager and tenant analytics in-house becomes an 8-11 month commitment before shipping anything to customers. And that's just the initial build—ongoing maintenance, feature requests, and performance optimization continue indefinitely.
Property analytics isn't just a retention play—it's a direct revenue driver. PropTech platforms that embed robust analytics capabilities unlock three monetization opportunities:
Platforms can gate advanced analytics behind higher-priced plans. Basic property managers get rent rolls and occupancy summaries. Premium customers get portfolio-level financial reporting, tenant cohort analysis, maintenance cost breakdowns by property, and white-label capabilities for owner reports.
Platforms offering premium analytics tiers see 20-30% of their property manager base upgrade to access better reporting. For a platform with 5,000 property managers paying $89/month on average, a premium analytics tier priced at $199/month that converts 25% of the base represents an additional $137,500 in monthly recurring revenue.
Every "How do I run an occupancy report?" ticket costs $6-12 in support time. For a mid-sized PropTech platform serving 3,000 property managers, analytics-related support tickets can easily hit 3,500-5,000 per month, representing $21,000-$60,000 in monthly support costs.
Platforms that implement self-service property dashboards and tenant portals see 58-68% reductions in analytics-related tickets, directly cutting operational overhead and freeing support teams to focus on complex technical issues that actually require human intervention.
Property managers who actively use platform analytics demonstrate 30-45% lower churn rates than those who don't engage with dashboards. When property managers rely on your platform for portfolio intelligence—not just rent collection—they become deeply embedded in your ecosystem.
Higher retention translates to higher customer lifetime value (LTV). For a PropTech platform with average property manager LTV of $3,200, reducing churn by even 10% adds hundreds of thousands in long-term revenue across the customer base.
PropTech platforms that nail property analytics focus on five core use cases that 85%+ of property managers need:
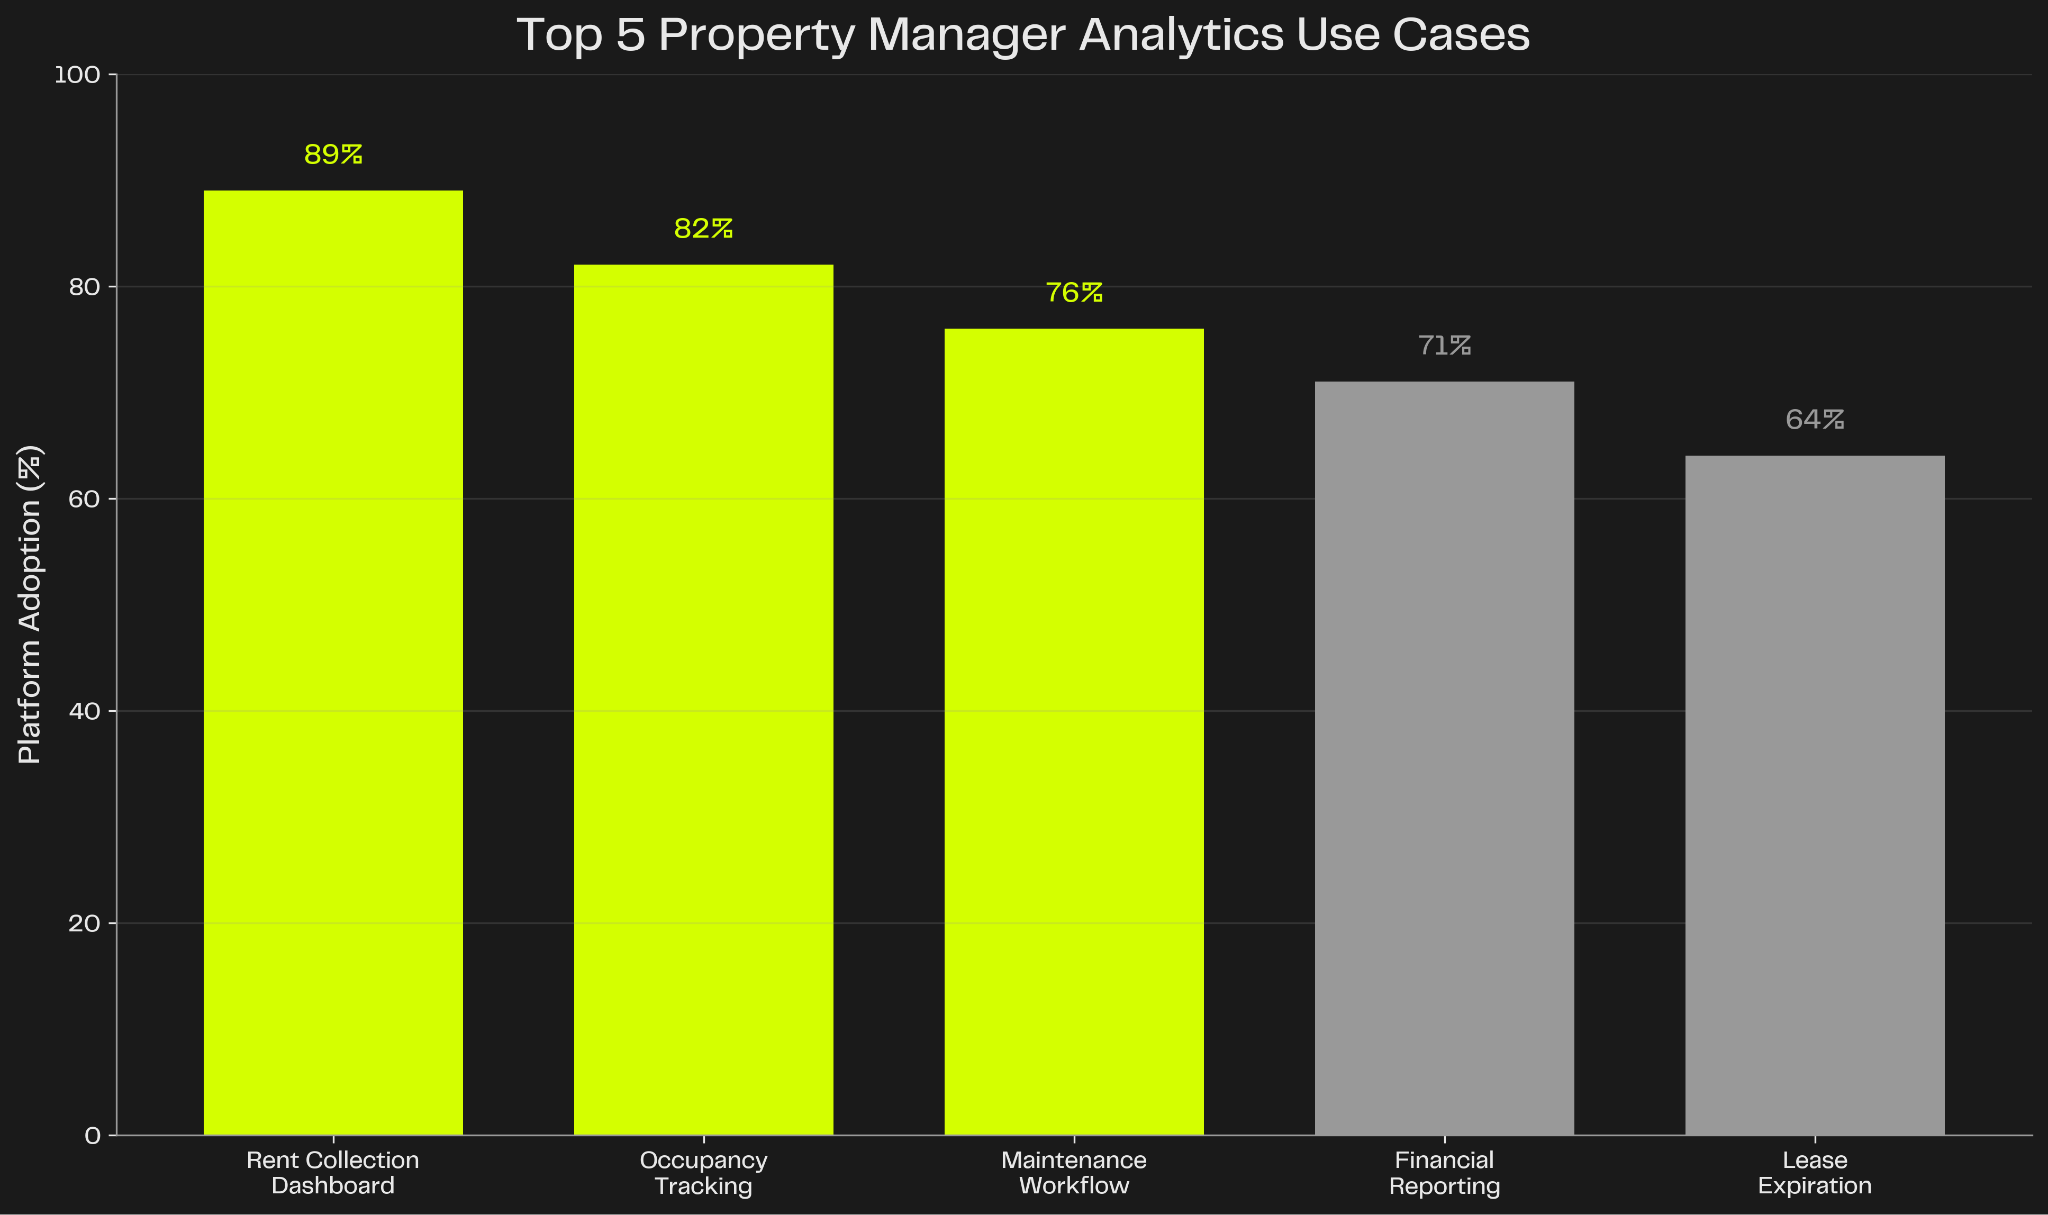
The foundational view. Who paid this month? Who's late? What's the total collected vs. expected? Rent collection status by property, by unit, by tenant. Simple, clean, updated in real-time as payments process. 89% of residential PropTech platforms prioritize rent collection dashboards as the first analytics feature.
Which properties have vacancies? When do leases expire? What's the portfolio-wide occupancy rate? Lease expiration calendars, move-in/move-out tracking, and vacancy duration metrics help property managers minimize revenue loss from empty units. 82% of platforms include occupancy analytics in their core offering.
How quickly are maintenance requests being resolved? Which properties have recurring issues? What's the average cost per work order? Maintenance completion metrics, vendor performance tracking, and cost breakdowns by property help property managers optimize operations. 76% of platforms build maintenance analytics.
Which properties are profitable? What are the biggest expense categories? How does this quarter compare to last quarter? Property-level profit & loss statements, expense categorization, and trend analysis let property managers identify underperforming assets. 71% of platforms offer financial reporting.
When are leases expiring? Which tenants are likely to renew? What's the pipeline for upcoming vacancies? Lease expiration calendars, renewal probability scoring, and pre-expiration alerts help property managers proactively manage turnover. 64% of platforms include lease analytics.
When PropTech product teams evaluate property analytics solutions, they face the classic build vs. buy decision. Here's the realistic math over a three-year period:
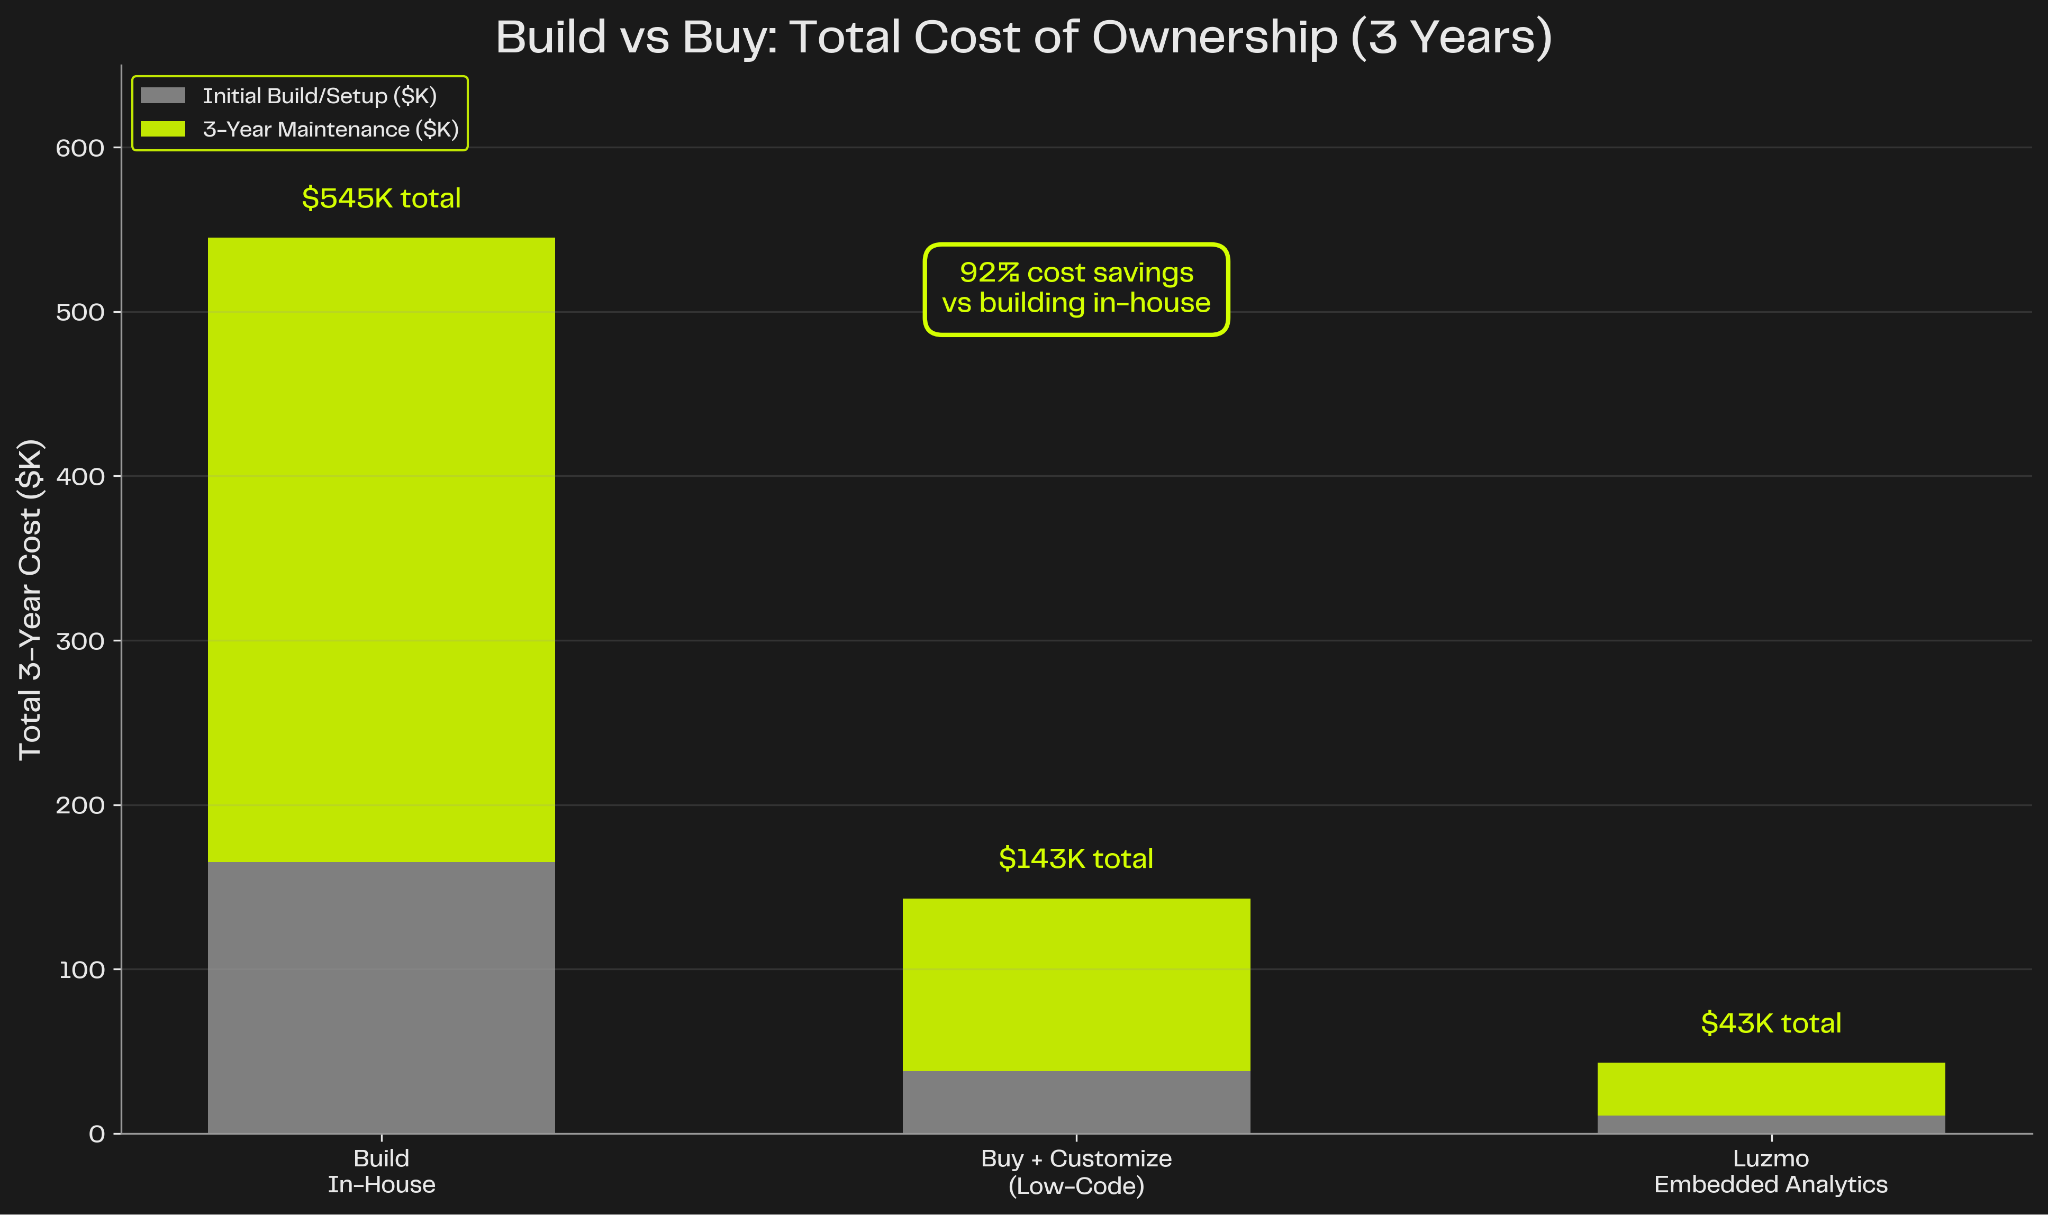
The cost difference is substantial. Embedded analytics solutions like Luzmo deliver 92% cost savings versus building in-house, while cutting time-to-market from 8-11 months to 8-10 weeks.
Speed matters in competitive PropTech markets. Here's how timelines compare:
In-House Build (8-11 Months):
Luzmo Embedded Analytics (8-10 Weeks):
Luzmo's embedded solution compresses an 8-11 month project into 2-3 months, letting PropTech teams ship property analytics 4-5X faster than in-house builds.
Embedded analytics solutions like Luzmo solve the core infrastructure challenges that make in-house builds expensive and slow:
Luzmo's architecture handles property manager data isolation, per-tenant permissions, and role-based access out of the box. No need to architect tenant separation from scratch—just connect your property management data and define property manager boundaries.
Custom branding, embeddable dashboards, and subdomain support ship as core features. Property management firms can resell analytics under their own brand without seeing Luzmo's logo anywhere.
Property managers get drag-and-drop report creation, saved custom dashboards, and scheduled email reports without requiring SQL knowledge or engineering support. Tenants get clean, simple portals that answer their questions without calling the office.
Luzmo's infrastructure handles millions of rent transactions, sub-second query performance, and WebSocket-based live updates. PropTech teams don't need to become experts in stream processing or caching strategies.
REST APIs, embeddable SDKs, and webhook support make integration straightforward. Most PropTech platforms go live in 8-10 weeks—not 8-11 months.
In the residential PropTech market, property manager and tenant analytics have shifted from "nice to have" to "table stakes." Platforms that treat analytics as an afterthought—offering basic rent rolls buried in admin menus—lose property managers to competitors that make data accessible, actionable, and beautiful.
The PropTech platforms winning property manager share in 2026 are those that:
Property analytics is no longer a backend engineering problem—it's a product strategy that directly impacts retention, revenue, and competitive positioning in the residential PropTech market.

All your questions answered.
Build your first embedded data product now. Talk to our product experts for a guided demo or get your hands dirty with a free 10-day trial.


